26 F. average high on February 3.
16 F. high on February 3, 2015.
7" snow on the ground at KMSP.
February 4, 1984: The event termed the 'Surprise Blizzard' moves across Minnesota and parts of the Dakotas. Meteorologists were caught off guard with its rapid movement. People described it as a 'wall of white.' Thousands of motorists were stranded in subzero weather. Only a few inches of snow fell, but was whipped by winds up to 80 mph. 16 people died in stranded cars and outside.
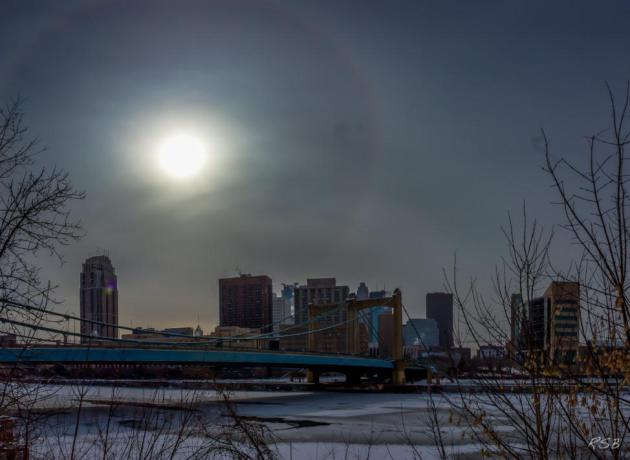
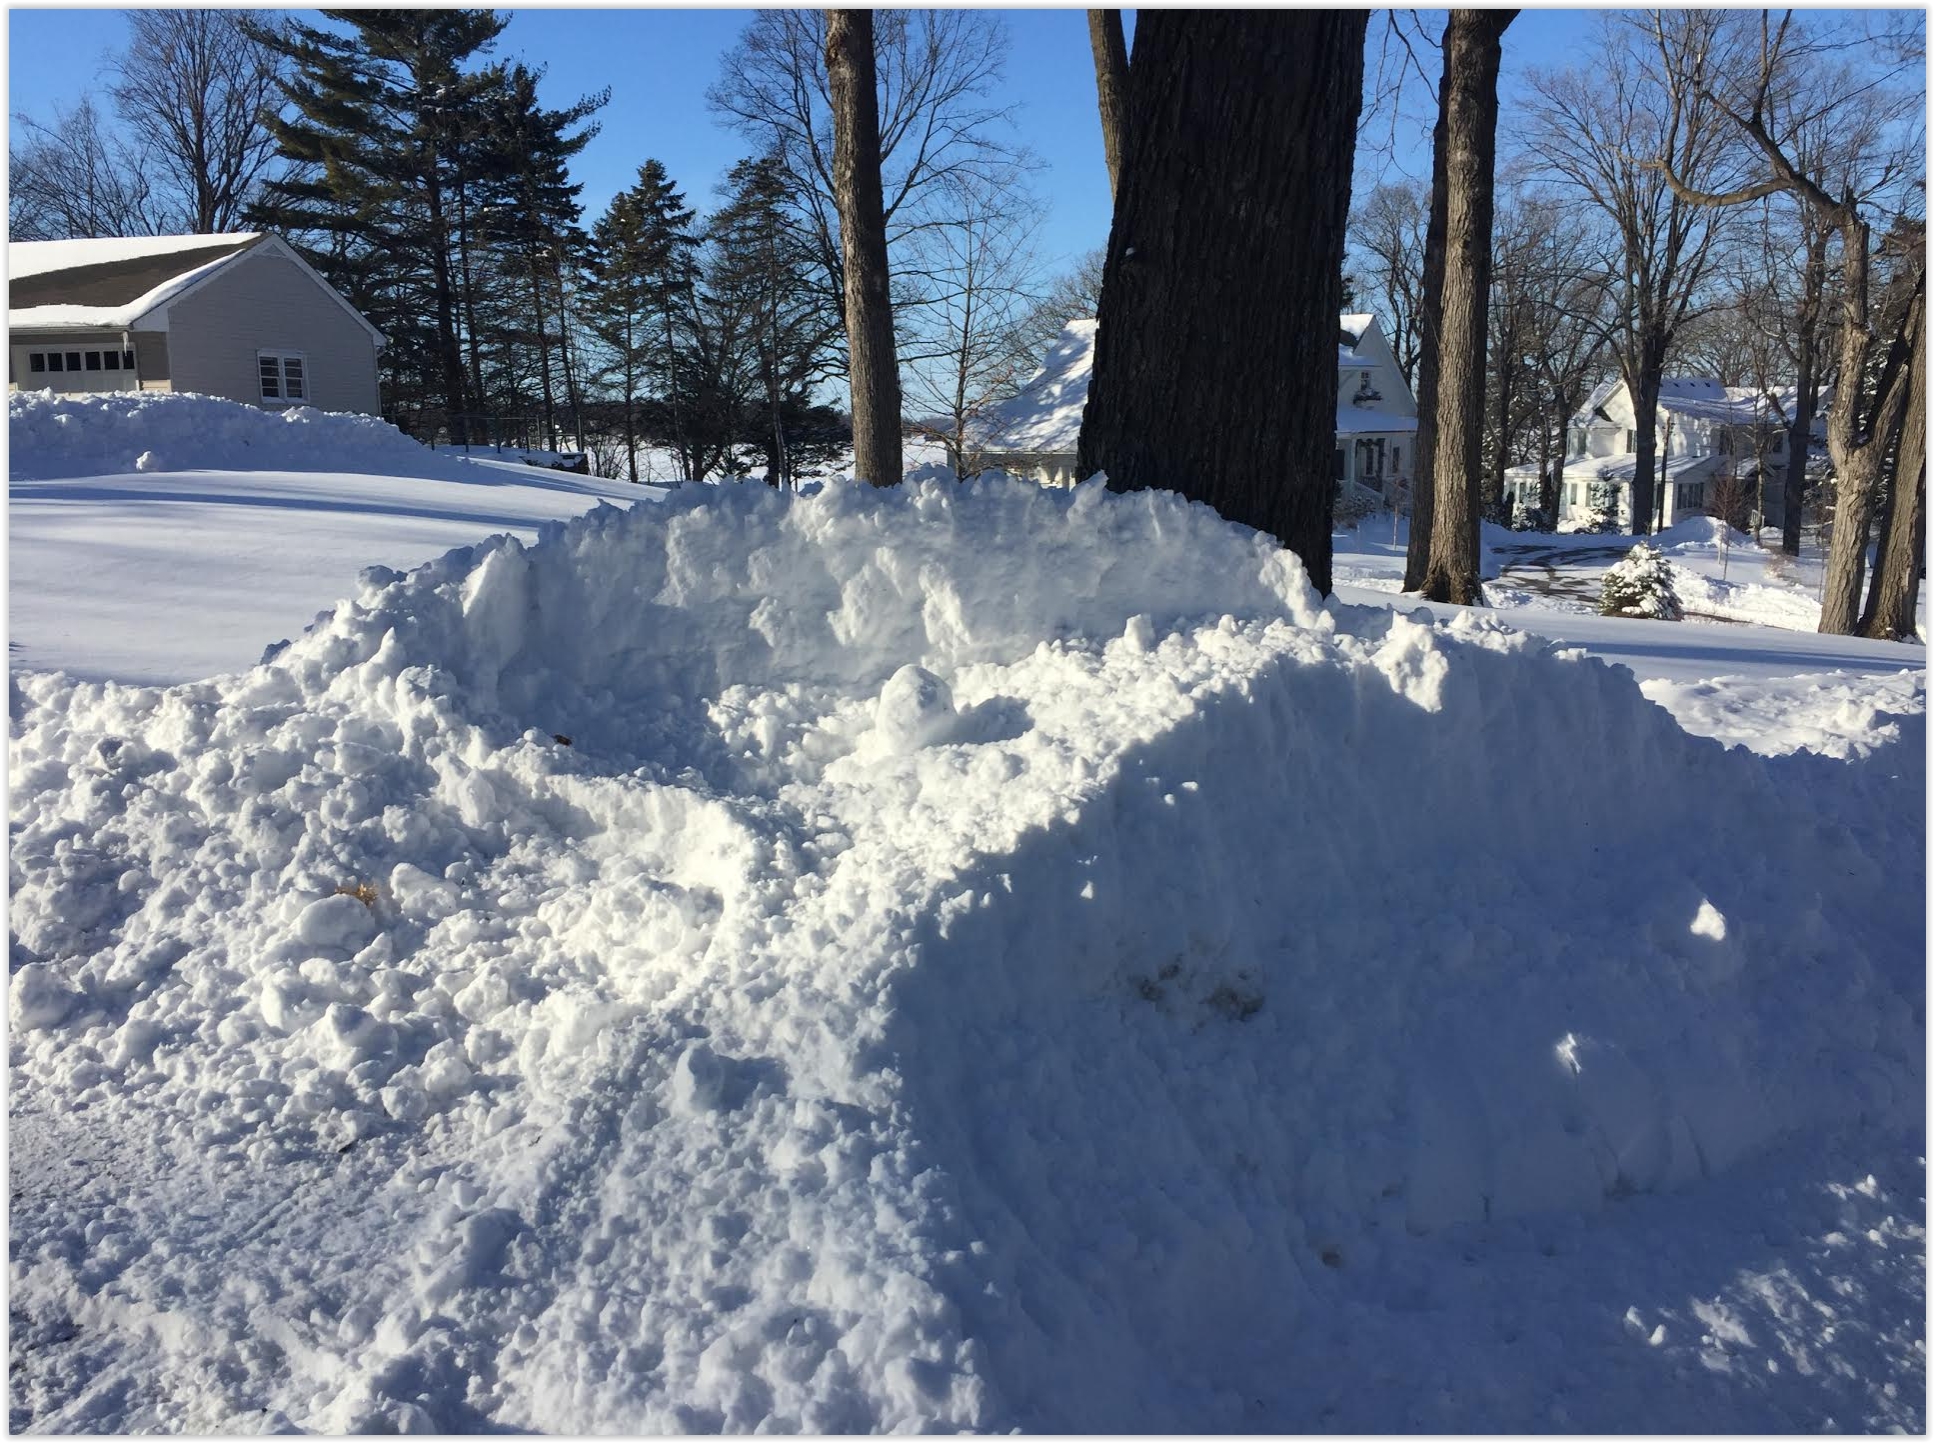
Heavy Snowfalls at MSP: Perception versus Reality
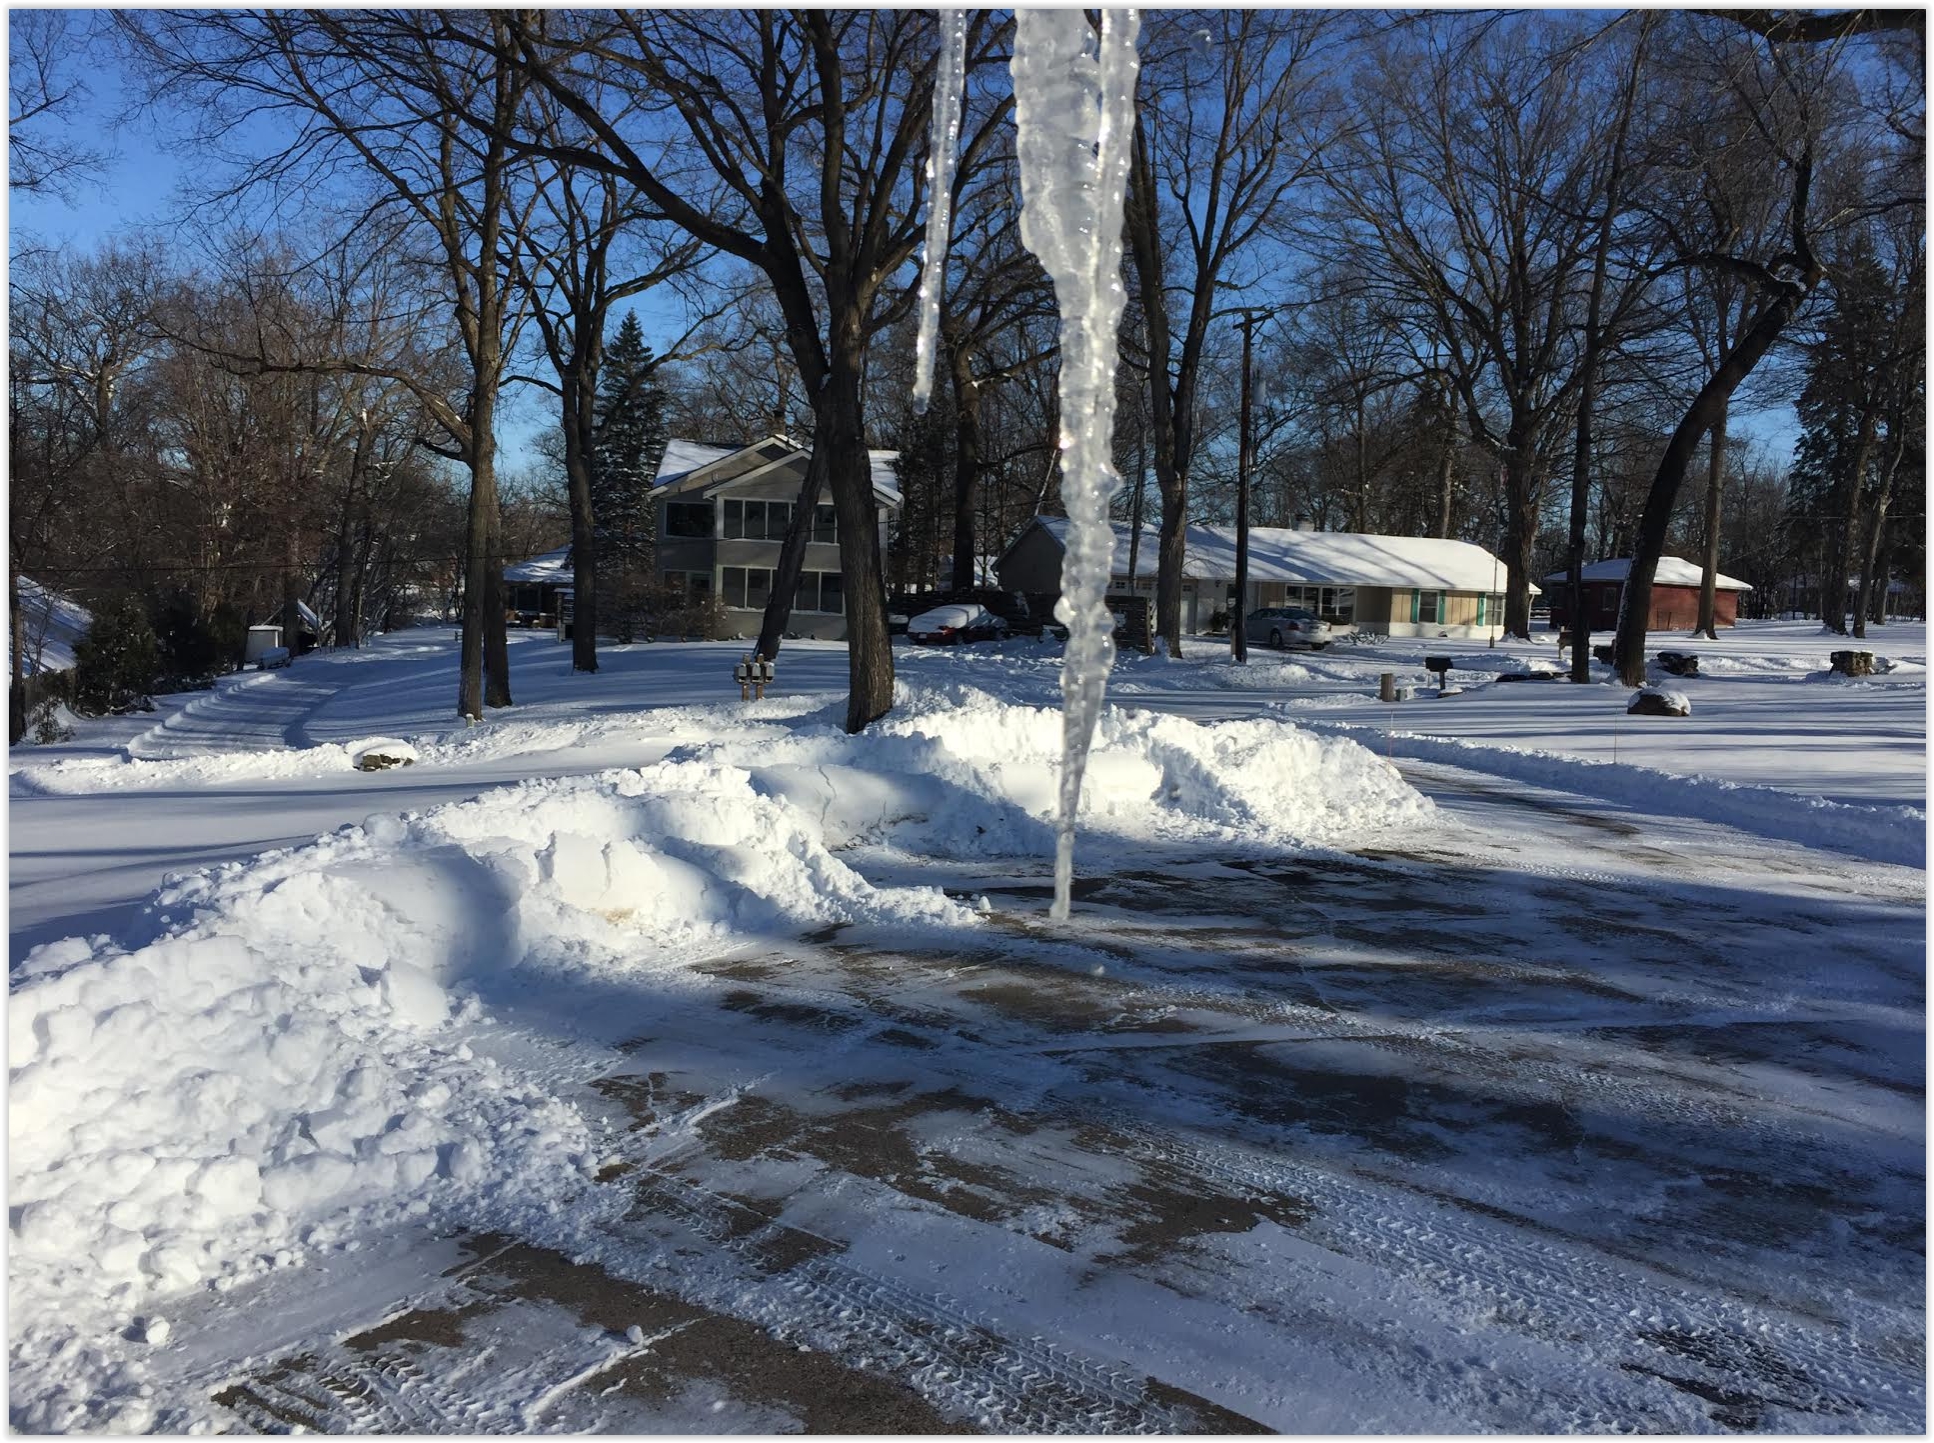
It's nice to know it can still snow in the Twin Cities. I was beginning to wonder.
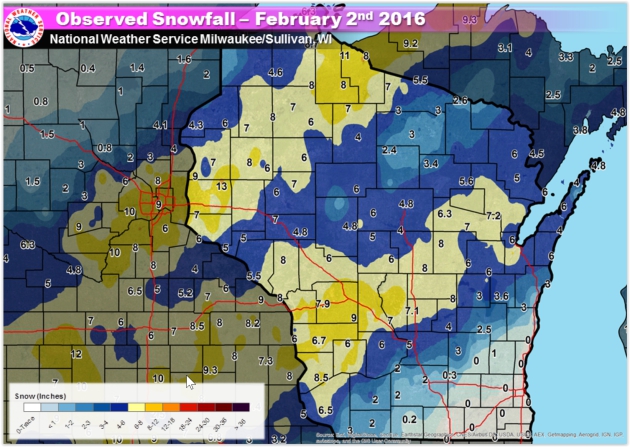
3 observations from Tuesday's snowy dumping: if it's snowing hard enough and traffic is heavy enough the plows just can't keep up, in spite of best intentions. Lower your expectations. If a meteorologist predicts 4-8 inches (most) people hear 8 INCHES! And if that much falls in a band 20 miles away from your house, but you see less, the forecast is wrong. Predicting down to the inch is about as challenging as handicapping the U.S. presidential race right now. Good luck.
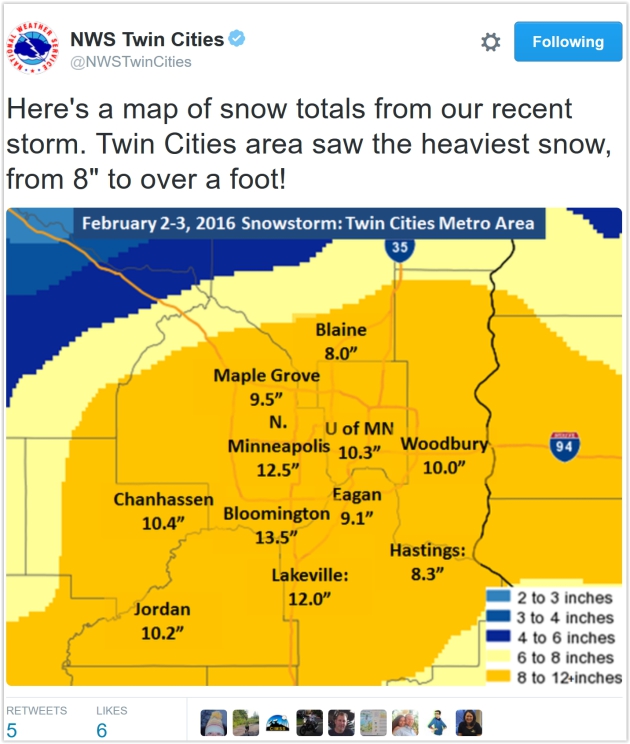
Bob Seward sent me an e-mail, wondering why one-foot snows in the metro are so rare? According to climate guru Pete Boulay MSP has picked up 10 separate 8" snows since 2000. That compares with 12 snows over 8" from 1983-1999 and only 7 between 1966 and 1982. Details below.
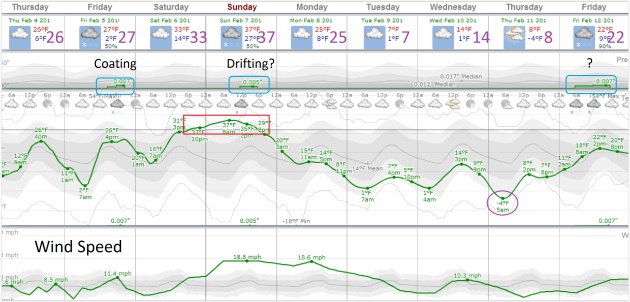
No more monster-storms are brewing, just a coating to 1 inch today, maybe an inch or two Sunday PM. The approach of a numbing shot may whip up strong winds late Sunday. Getting home from that Super Bowl party may be slow and tricky.
Next week looks cold. Not brutal, just mildly "character-building".
"Where can I find current snow depth data for Minnesota? By current, I mean within 24 hours of a snow storm. I was looking this morning for snow depth at my cabin which is between Hackensack and Longville. I normally use the MN DNR snow depth site but it is updated only weekly after 2:00 PM on Thursdays. I’ve been waiting for there to be enough snow for snowshoeing this winter. Any help you could give me would be greatly appreciated."
- Doug Stark

"Why have a majority of snowstorms tracked south into Iowa the past few years? It seems likes snowfall of 12" is a rare event in the Twin Cities..."
- Bob Seward
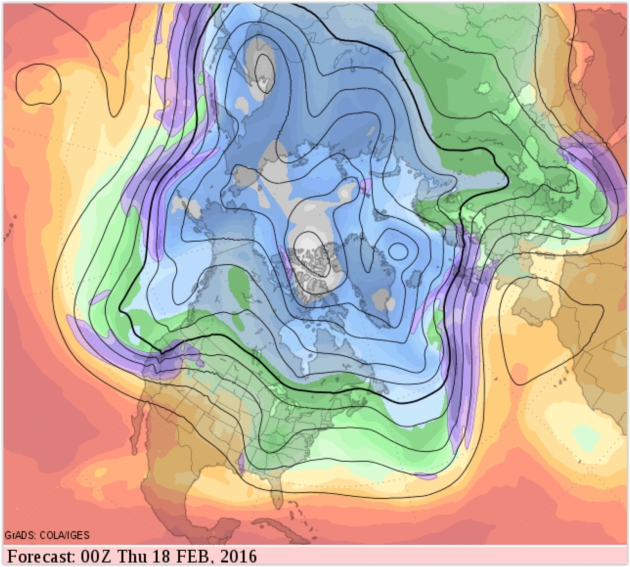
Bob - El Nino winters tend to energize the southern branch of the jet stream, the prevailing winds aloft, whisking many (but not all) big storms south of Minnesota. There are exceptions to every rule, as was demonstrated on Tuesday. I turned to Pete Boulay for an answer. He sifted through Twin Cities weather records and this was his response:
"It's hard to parse out individual snowstorms (when does one end and another begin?) but I did look at the largest snowstorm for each year for the past 10 years in the Twin Cities for the 'CCO Good Question:
2006-07 February 28 to March 2, 2007 12.3 inches
2007-08 March 31 to April 1, 2008 5.9 inches
2008-09 January 12-13, 2009 6.0 inches
2009-10 December 23-26, 2009 9.4 inches
2010-11 17.1 inches December 10-11, 2010 (Note there was also a 13.8 inch event Feb 20-21 2011)
2011-12 4.4 inches December 3-4, 2011
2012-13 10.6 inches December 8-9, 2012
2013-14 9.9 inches February 20-21, 2014
2014-15 4.2 inches December 26-27, 2014
2015-16 9.2 inches February 2-3, 20156 (so far.. could still be a little more added)
So that is 4 events over the past 10 years...
It might be easier to look at eight inch snows in a calendar day. I took a look at the last 17 years and looking back in 17 year chunks...
8 inch snows:
10 times from 2000 to 2016
12 times from 1983 to 1999
7 times from 1966 to 1982
6 times from 1949 to 1965
"It is hard to beat the snowy 80's but there have been more 8 inch events in recent years compared to the 50's to the 70's."
- Pete Boulay, State Climatology Office. DNR - Division of Ecological and Water Resources.
The Mathematical Challenge of Answering a Simple Question. Minnesota State Climatologist Greg Spoden adds additional insight and perspective. Distinguishing "noise" from "trends" is easier said than done. Here is an excerpt of an e-mail I received from Greg on Wednesday:
Hello all,
"As Pete's review shows, double-digit snowfall totals in the Twin Cities are uncommon. By definition extreme events are rare. Trend detection in extreme events is a statistical challenge that goes beyond my simple-minded use of least squares regression. The author of (this post) touches on the problem. I note that Harold Brooks chimes in with a comment about this post. If anyone knows a thing or two about detecting trends in rare events, it's Harold.
If you want to dive into the deep end of the statistical pool, the Journal of Climate paper describes a methadology for detecting trends in rare events. The author's cautionary talke, found in the abstract, is worth noting:
"The results demonstrate the difficulty in determining trends of very rare events, underpinning the need for long-period data for trend analysis, and point toward a careful interpretation of statistically nonsignificant trend results"
- Greg Spoden, State Climatologist, Minnesota DNR - State Climatology Office, Division of Ecological and Water Resources
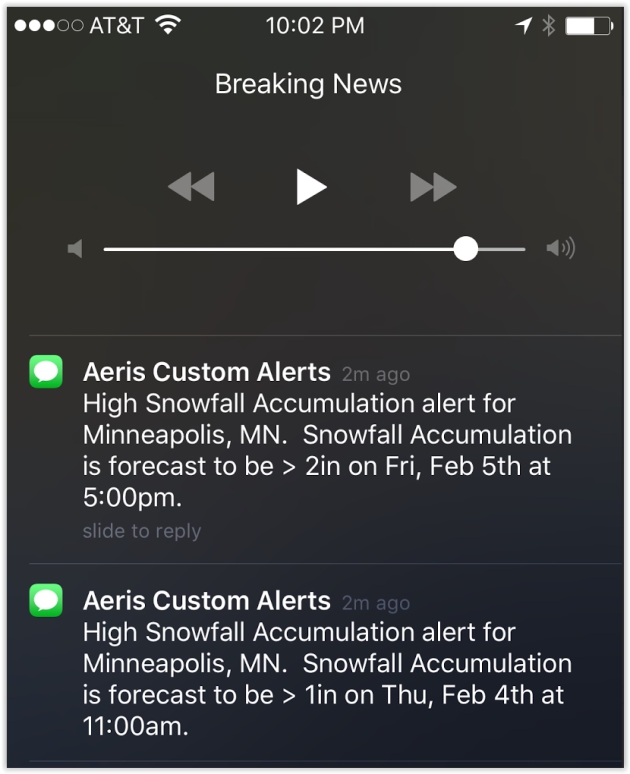
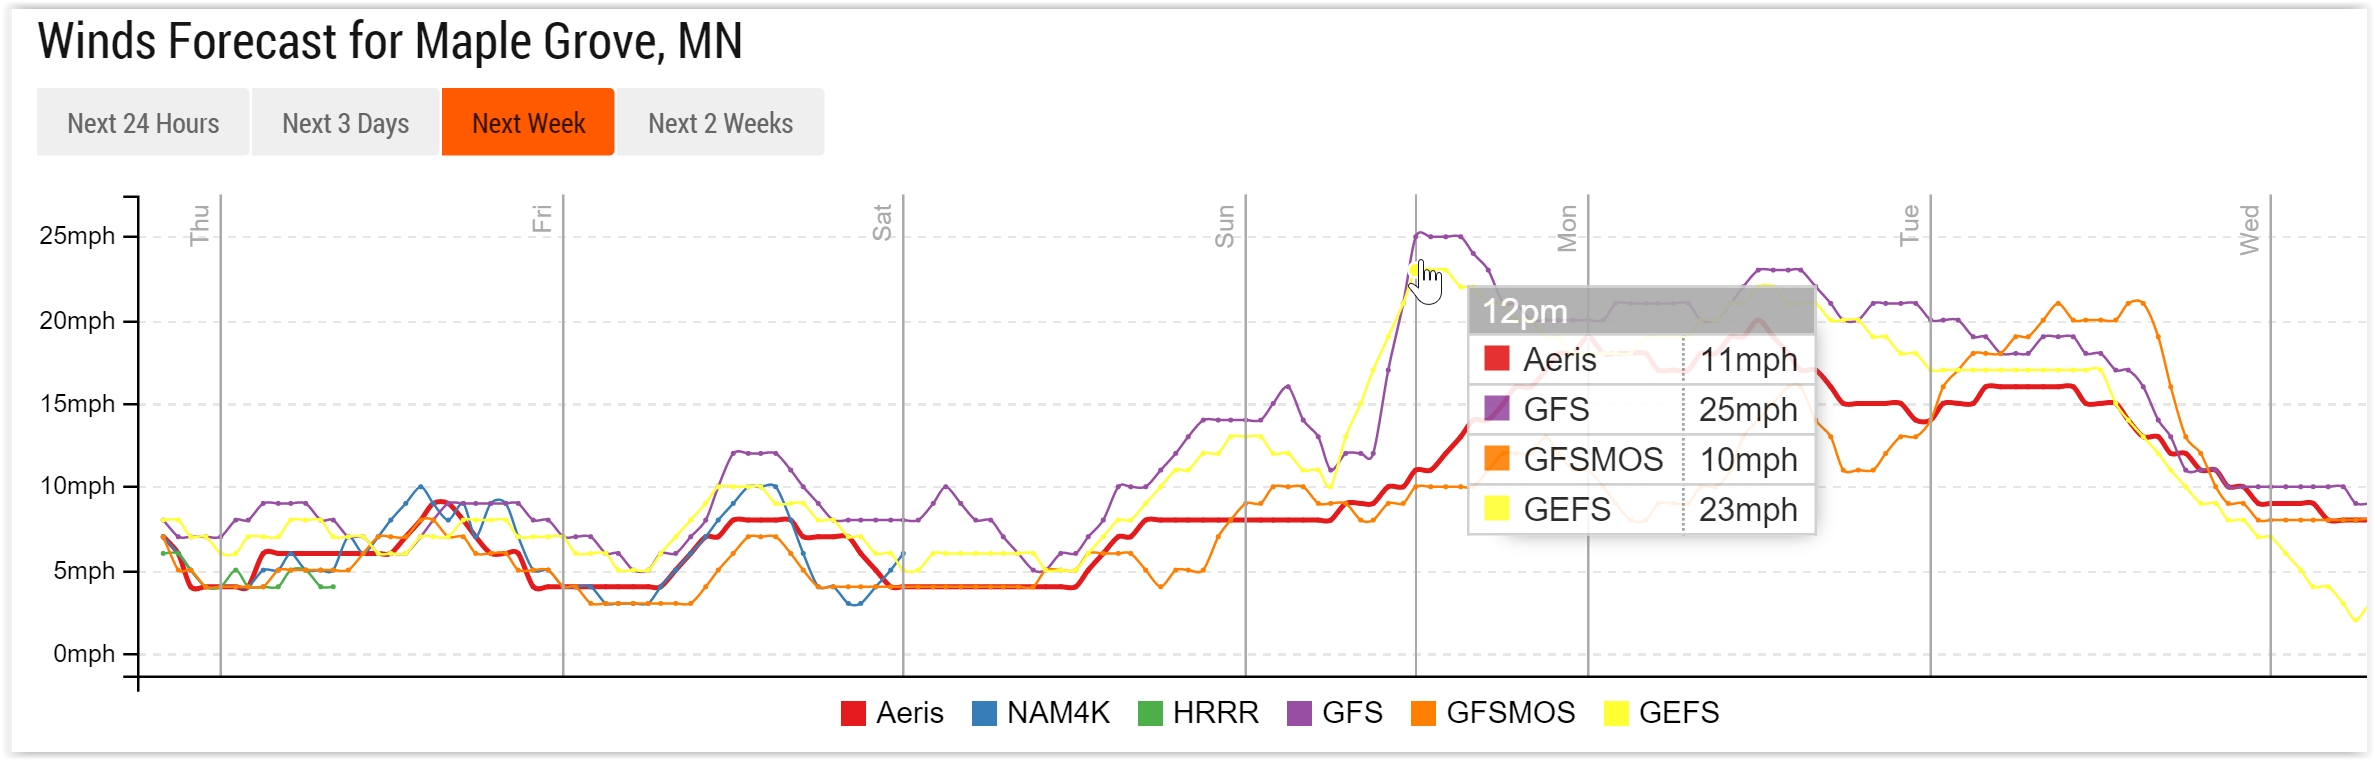
Super Bowl Blowing & Drifting. I'm not so concerned in the immediate Twin Cities metro, but open areas outside MSP may see extensive drifting Sunday PM hours. GFS guidance shows sustained winds of 25 mph with gusts to 35, capable of whipping up all that new snow on the ground. Source: Aeris Enterprise.

Four out of five strong El Niño Februaries were wetter than average in the Bay Area….Taking an average of all five Februaries above, you’d expect measurable rain 16 days of the month. In other words, you’re more likely to see a wet February day during a strong El Niño in the Bay Area than a dry day..."* More Super Bowl weather trivia can be found here, courtesy of Southeast Regional Climate Center.

Four Faunal Forecasters. The National Environmental Education Foundation has a story that addresses much-maligned groundhogs, wooly bear caterpillars, cows, crickets and others critters and their valiant attempt to predict the weather; here's an excerpt: "...Move over, Punxsutawney Phil. Groundhogs aren’t the only animals known to “predict” the weather. Phil may be the most famous, but he’s certainly not the most accurate. Here are four animals that are known for their weather wisdom. Some of these proverbs are true, while others are not. Can you guess which ones are real?
Fact or Fiction? The width of a Woolly Bear Caterpillar’s orange stripe can predict how mild the winter will be. Fiction! According to an old proverb, if the width of a Woolly Bear Caterpillar’s reddish-brown stripe is wider than usual, the coming winter will be mild. Conversely, a narrower stripe means the coming winter will be harsh. While some scientific evidence suggests that this may be related to the previous winter’s severity, there’s no correlation between the stripe’s width and the following winter’s severity..."
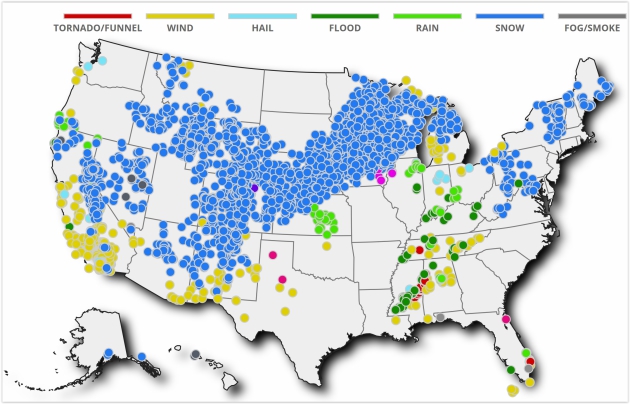
Severe Storm Reports since January 27 courtesy of NOAA and AerisWeather.
Climate Data Now Key to Disaster Preparedness, First Responders Say. Here's an excerpt from InsideClimate News that got my full attention: "...Natural
disasters such as flooding, hurricanes, drought and snowstorms have
become more frequent or more intense due to climate change in recent
decades, the experts said. In the 1980s, the U.S. averaged 29 disaster
declarations per year. That average jumped to 74 per year In the 1990s
and 127 per year in the 2000s. Nimmich, Spinrad and Livingston said
shifting demographics—more people moving toward the coast and waterways
directly in harm's way of most extreme weather—has also played a role in
the cost and severity of recent natural disasters.
Extreme weather today "is literally biblical in nature," said Spinrad.
And because greenhouse gas emissions linger in the atmosphere for long
periods of time, "we will have many decades to centuries of these
continued [weather] patterns. It is a new normal, if you will..."
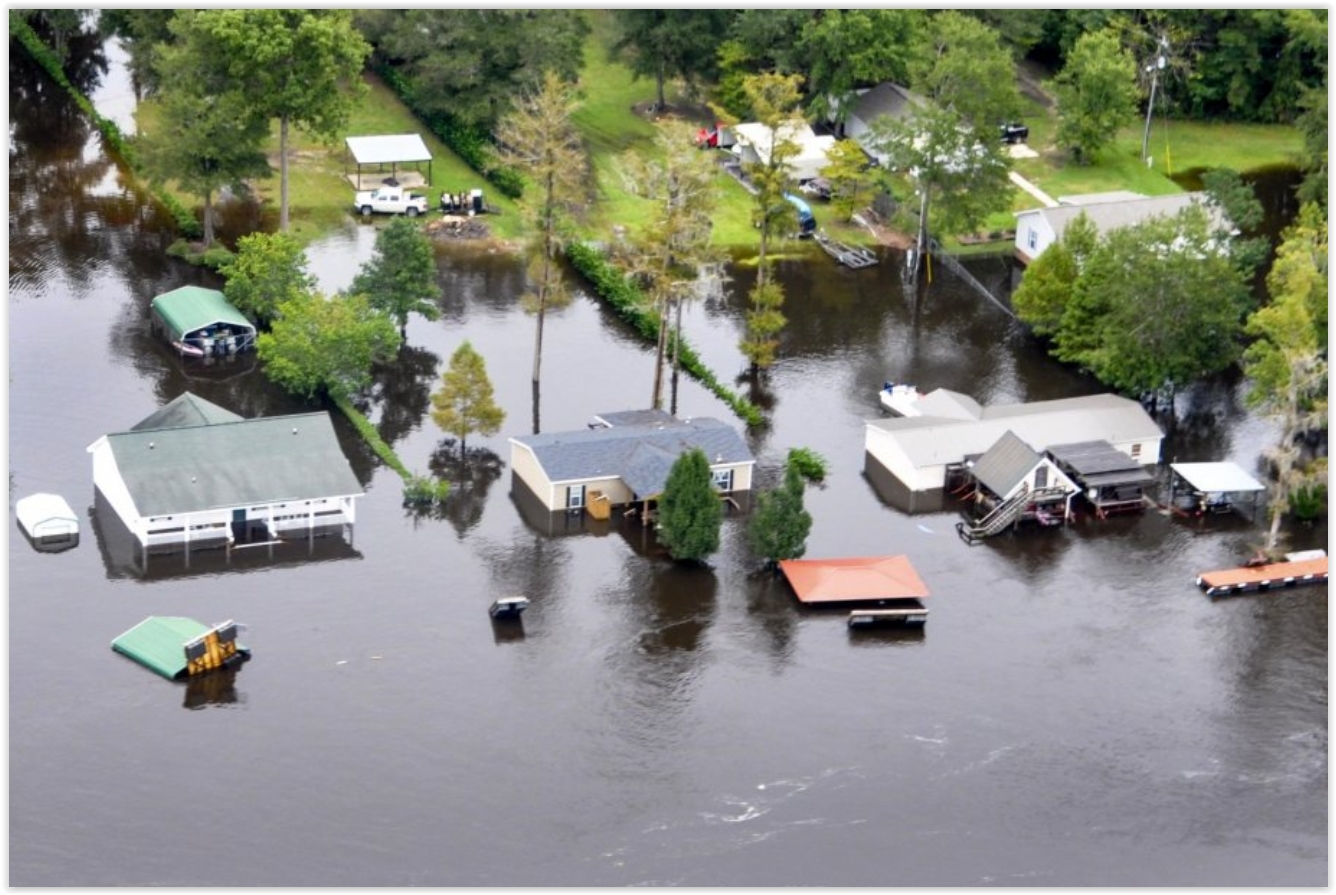
Photo credit above: "South Carolina's epic floods in 2015 served as a vivid reminder of climate change's impact on extreme weather." Credit: U.S. Coast Guard via Flickr
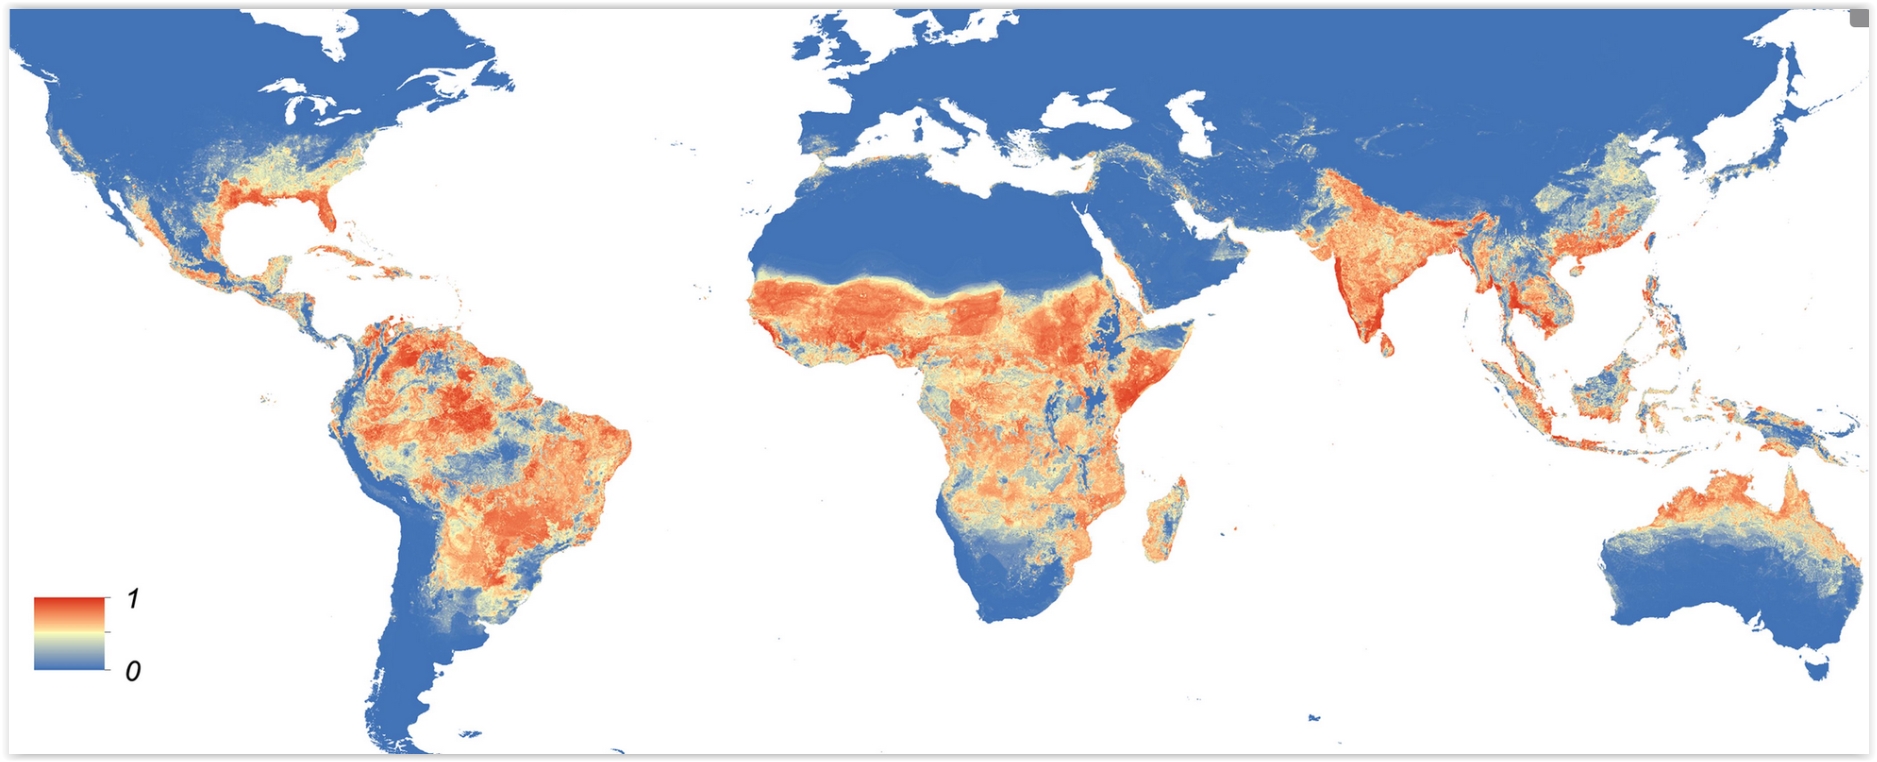
Higher Temperatures Make Zika Mosquito Spread Disease More. Another compelling reason why warming matters; here's an excerpt from The Associated Press: "The mosquito behind the Zika virus seems to operate like a heat-driven missile of disease. The hotter it gets, the better the mosquito that carries Zika virus is at transmitting its buffet of dangerous illnesses, scientists say. Although it is too early to say for this outbreak, past outbreaks of similar diseases involved more than just biology. In the past, weather has played a key role, as have economics, human travel, air conditioning and mosquito control. Even El Nino sneaks into the game. Scientists say you can't just blame one thing for an outbreak and caution it is too early to link this one to climate change or any single weather event. As the temperature rises, nearly everything about the biology of the Aedes aegypti mosquito — the one that carries Zika, dengue fever and other diseases — speeds up when it comes to spreading disease, said entomologist Bill Reisen of the University of California Davis..."
Map credit: Vox, and Elife Sciences.org. "Global map of the predicted distribution of Aedes aegypti, one of the types of mosquitoes that spread Zika."
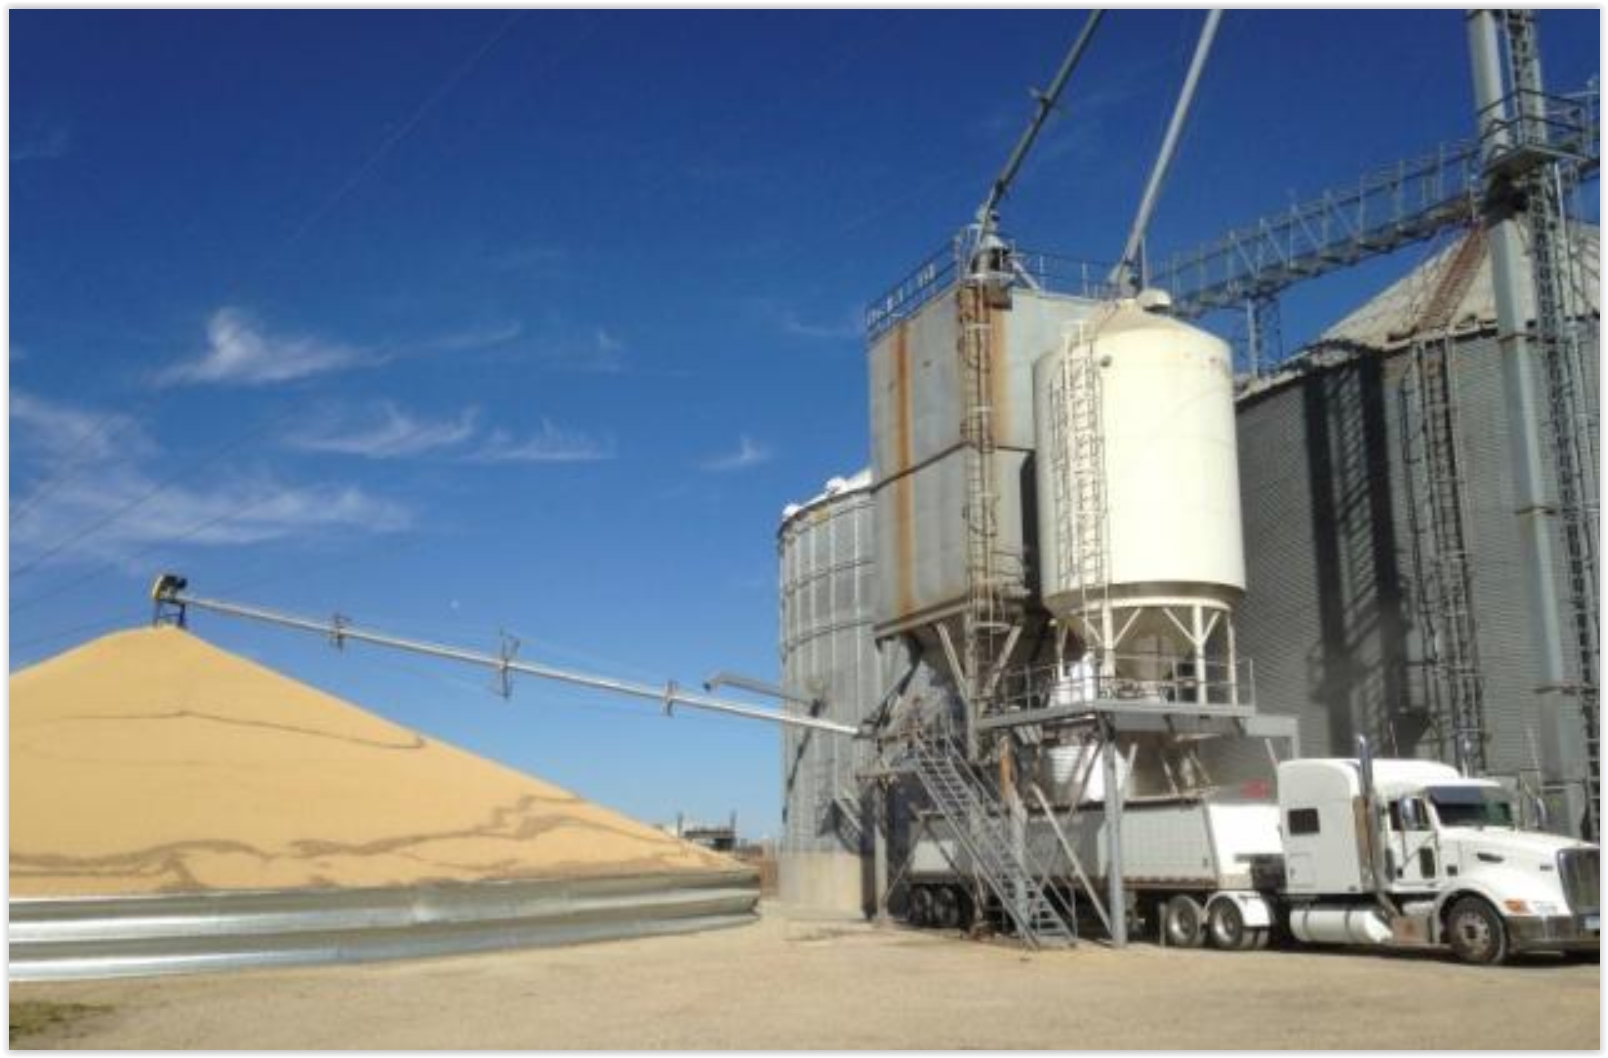
Ample Grain Stocks Could Dampen Impact of El Nino/La Nina Shift. Will we head into La Nina, a cooling phase of the Pacific, which correlates with a higher risk of late summer drought? Too early to tell. Here's an excerpt from Reuters: "When El Nino gives way to its little sister, La Nina, this year, as meteorologists are forecasting, the disruptive weather patterns may still be unable to disperse the bearish clouds that have hung over U.S. grains markets for years. Corn and soybean futures have gone haywire in past transition years, with prices soaring as yields withered. But plentiful supplies, both overseas and domestically, should provide a buffer against any disruptions this year and dampen any market rallies..."
Photo credit above: "A truck is loaded with corn next to a pile of soybeans at Matawan Grain & Feed elevator near New Richland, Minnesota October 14, 2015." Reuters/Karl Plume
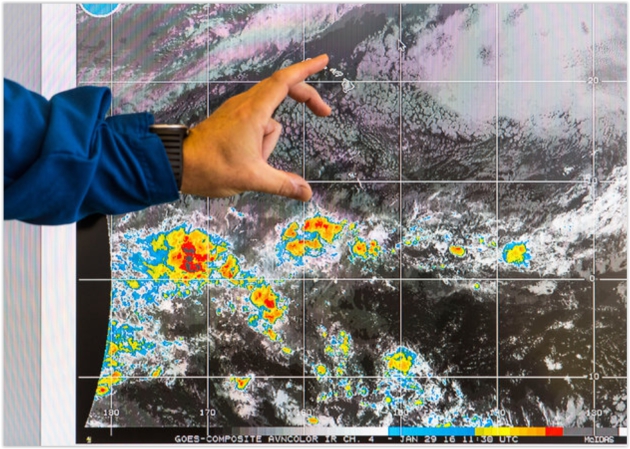
Studying The Heart of El Nino, Where Its Weather Begins. The New York Times has an interesting story about how NOAA is researching the genesis of El Nino events in the Pacific; here's the intro: "In a Gulfstream jet more accustomed to hunting hurricanes in the Atlantic, researchers with the National Oceanic and Atmospheric Administration
were cruising this desolate stretch of tropical ocean where the
northern and southern trade winds meet. It’s an area that becalmed
sailors have long called the doldrums, but this year it is anything but
quiet. This is the heart of the strongest El Niño in a generation, one
that is pumping moisture and energy into the atmosphere and, as a
result, roiling weather worldwide..."
Photo credit above: "A satellite image of the area of the Pacific where a NOAA research team would be flying." Credit Kent Nishimura for The New York Times.
Image credit: JMA / Charlie Loyd.
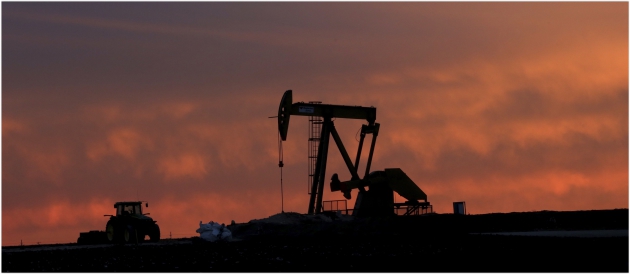
The U.S. Bet Big on American Oil and Now The Whole Global Economy is Paying The Price. Here's the intro to an analysis at Quartz: "Oil
has wrong-footed our leading experts—again. At the beginning of 2014,
the world was marveling in surprise as the US returned as a petroleum
superpower, a role it had relinquished in the early 1970s. It was
pumping so much oil and gas that experts foresaw a new American
industrial renaissance, with trillions of dollars in investment and
millions of new jobs. Two years later, faces are aghast as the same oil
has instead unleashed world-class havoc: Just a month into the new year,
the Dow Jones Industrial Average is down 5.5%..."
Photo credit above: "The unfathomable." (AP/LM Otero).
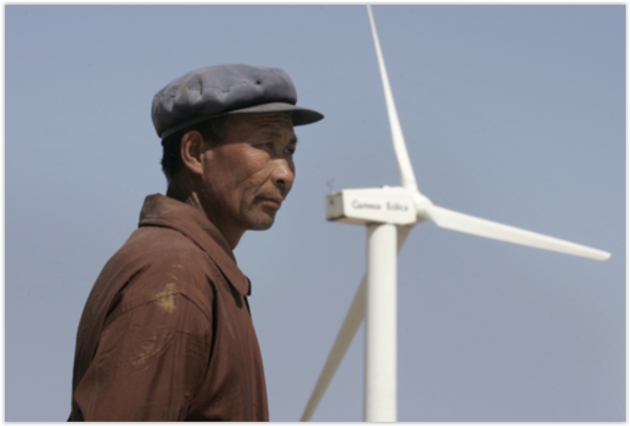
China Blows Past the U.S. in Wind Power. Here's the intro to a story at ClimateWire and Scientific American: "China
solidified its standing as the world’s wind energy behemoth in 2015,
adding almost as much wind power capacity in one year as the total
installed capacity of the three largest U.S. wind-producing states:
Texas, Iowa and California. New data from Bloomberg New Energy Finance
show China installed just under 29 gigawatts of new wind energy capacity
in 2015, surpassing its previous record of roughly 21 GW set in 2014..." (Image credit: Efergy.com)
Photo credit above: "The nuclear fusion research centre at the Max Planck Institute in Greifswald." Photograph: Stefan Sauer/AP.
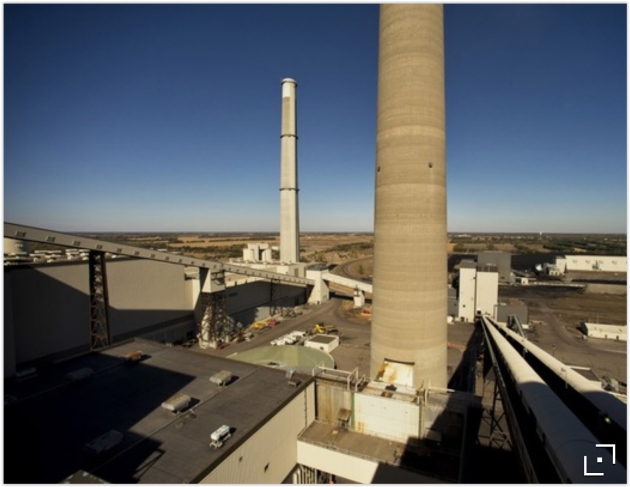
Xcel Energy Says Its "Nearly Certain" It Can Comply With Federal Clean Power Plan in Minnesota. I was encouraged to read this in the Star Tribune; here's an excerpt: "As
many U.S. power companies fight the federal Clean Power Plan, Xcel
Energy took a different path Friday, declaring the utility’s Minnesota
operations are “nearly certain” to comply with the plan’s greenhouse gas
reductions through cost-effective investments over the next decade. The
strategy, which Xcel first laid out last year and firmed up in a
regulatory filing late Friday, calls for $6 billion in wind and solar
energy investment, retirement of two Minnesota coal-burning units,
construction of a nearly $1 billion natural gas-fired generator and
further investment to retain the carbon-free energy from its two nuclear
power plants..."
Photo credit above: Glen Stubbe. "Two coal-burning units at the Sherco power plant in Becker, Minn., will be retired sometime in the 2020s, to Xcel Energy said."
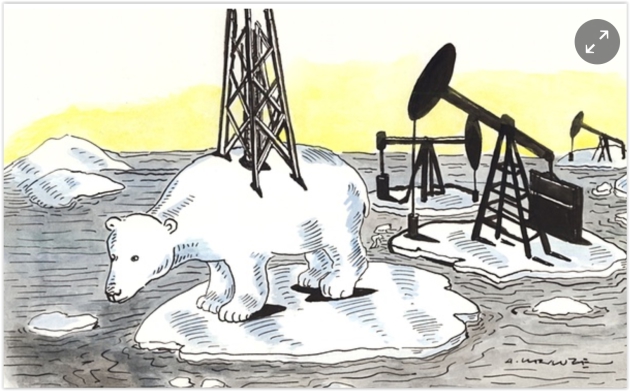
We're Drowning in Cheap Oil, Yet Still Taxpayers Prop Up This Toxic Industry. George Monbiot has an Op-Ed at The Guardian; here's an excerpt: "...Strangely,
the same rules do not apply to the oil companies. Your friends get
protection. The free market is reserved for enemies. Yes, I do mean
enemies. An energy transition threatens the kind of people who attend
the Conservative party’s fundraising balls. It corrodes the income of
old schoolfriends and weekend guests. For all the talk of enterprise,
old money still nurtures its lively hatred of new money, and those who
control the public purse use it to protect the incumbents from the
parvenus. As they did for the bankers, our political leaders ensure that
everyone must pay the costs imposed by the fossil fuel companies –
except the fossil fuel companies. So they lock us into the 20th century,
into industrial decline and air pollution, stranded assets and –
through climate change – systemic collapse..."
Illustration credit above: ‘Oil
companies have already been granted ‘ministerial buddies’ to ‘improve
access to government’ – as if they didn’t have enough already.’ Illustration: Andrzej Krauze.

Nielsen Plays Catch-Up as Streaming Wreaks Havoc on TV Raters.
The way people consume entertainment is morphing rapidly, the
television business is being rapidly disrupted. So are the companies
tries to measure who is watching what - when. Here's an excerpt at The New York Times: "...Nielsen,
the 93-year-old company that has long operated an effective monopoly
over television ratings in the United States, is facing blistering
criticism from TV and advertising executives who see it as a relic of
television’s rabbit-ears past as the digital revolution transforms how
people consume entertainment. New competition — notably the $768 million
merger this week of the media measurement companies comScore and Rentrak — is forcing Nielsen to evolve..."

Photo credit above: "Denver Broncos fans cheer as their team takes the field against the Seattle Seahawks while watching the NFL Super Bowl XLVIII football game at the View House bar in Denver, Colorado February 2, 2014." Photograph by Marc Piscotty — Reuters.
For The First Time More Than Half of Americans Will Watch Streaming TV. eMarketer has the story.
“Forgiveness does not change the past, but it does enlarge the future.” – Paul Boese
TODAY: Coating to 1" snow possible, slick spots. Winds: SW 7-12. High: 25
THURSDAY NIGHT: Lingering clouds and flurries. Low: 13
FRIDAY: Dusting or coating of flurries possible. Winds: S 7-12. High: 26
SATURDAY: Mostly cloudy, thaw feels good. Winds: SW 10-15. Wake-up: 19. High: 32
SUNDAY: 1-2" snow late. Blowing/drifting? Winds: NW 15-30. Wake-up: 24. High: 31 (falling by afternoon).
MONDAY: Gusty and cold with flurries. Winds: NW 15-30. Wake-up: 16. High: 19
TUESDAY: Peeks of sun, feels like 0F. Winds: NW 7-12. Wake-up: 4. High: 10
WEDNESDAY: Spurts of sun, feels like February. Winds: NW 10-15. Wake-up: -2. High: 9
Climate Stories...
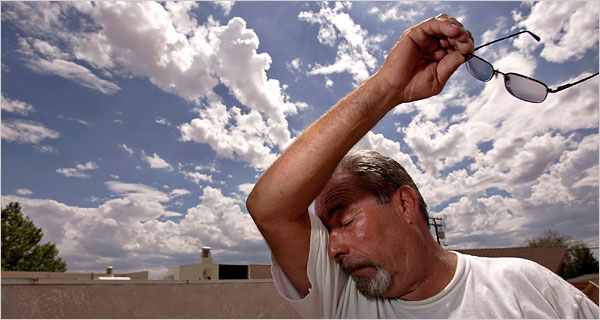
Humidity Could Be The Killer With Climate Change. Because we all know it's not the heat, it's the humidity. For the record the town of Bandar
Mahshahr, Iran experienced a suffocating heat index of 165F last
summer, so this is more than theoretical. Here's an excerpt from Cosmos Magazine: "...Coffel
found that by 2060, an estimated 600 million people will live in
regions at risk of heat waves producing wet bulb temperatures hitting 32
°C. Of these, 250 million could see heat waves with wet-bulb
temperatures of 33 °C, and 50 million could see 34 °C – one degree shy
of the limit. Even if these areas are never truly rendered
uninhabitable, people living there will have to make major lifestyle
changes, says Radley Horton, another Columbia climate scientist involved
in the project. Outdoor labour will become increasingly difficult, for
example: “We will see more [rest] breaks, more people working overnight,
changes in clothing, less strenuous activity...”

Measuring Ocean Heating is Key to Tracking Global Warming. Here's an excerpt from a story authored by St. Thomas University climate scientist John Abraham at The Guardian: "...The
answer to this question is clear, unassailable and unequivocal: the
Earth is warming because the energy is increasing. We know this because
the heat shows up in our measurements, mainly in the oceans. Indeed the oceans take up more than 92% of the extra heat.
The rest goes into melting Arctic sea ice, land ice, and warming the
land and atmosphere. Accordingly, to measure global warming, we have to
measure ocean warming. Results for 2015 were recently published by Noaa
and are available here. A recent paper
by Karina von Schuckmann and her colleagues appeared in Nature Climate
Change, and provides an excellent summary of our knowledge of the energy
balance of the Earth and recent advances that have been made..."
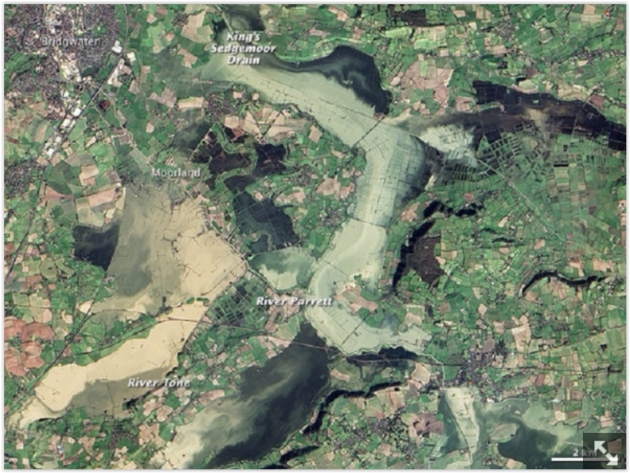
Chance of Extreme Flooding Up By 43% Because of Global Warming, Scientists Warn.
The study referenced is focused on Britain, but there is now little
doubt that increased CO2 and warming is pumping more water vapor into
the atmosphere, more fuel to "juice" storms. Here's an excerpt from Tech Times: "...Now,
man-made greenhouse gas emissions have upped the chances of extreme
flooding by 43 percent, scientists said, as increasingly warmer
temperatures hold larger
amounts of moisture that lead to heavier downpour. "What was once a 1
in 100-year event in a world without climate change is now a 1 in
70-year event," said Oxford
University's Friederike Otto, co-author of the report. Their paper is
the first research to look into the likely role of climate change in the
winter flooding of Somerset Levels..."
Image credit above: "Global
warming may unleash devastating and extensive flooding, scientists
warn. As levels of human-induced greenhouse gas emissions increase, the
chances of extreme flooding also goes dangerously high." Image: NASA.
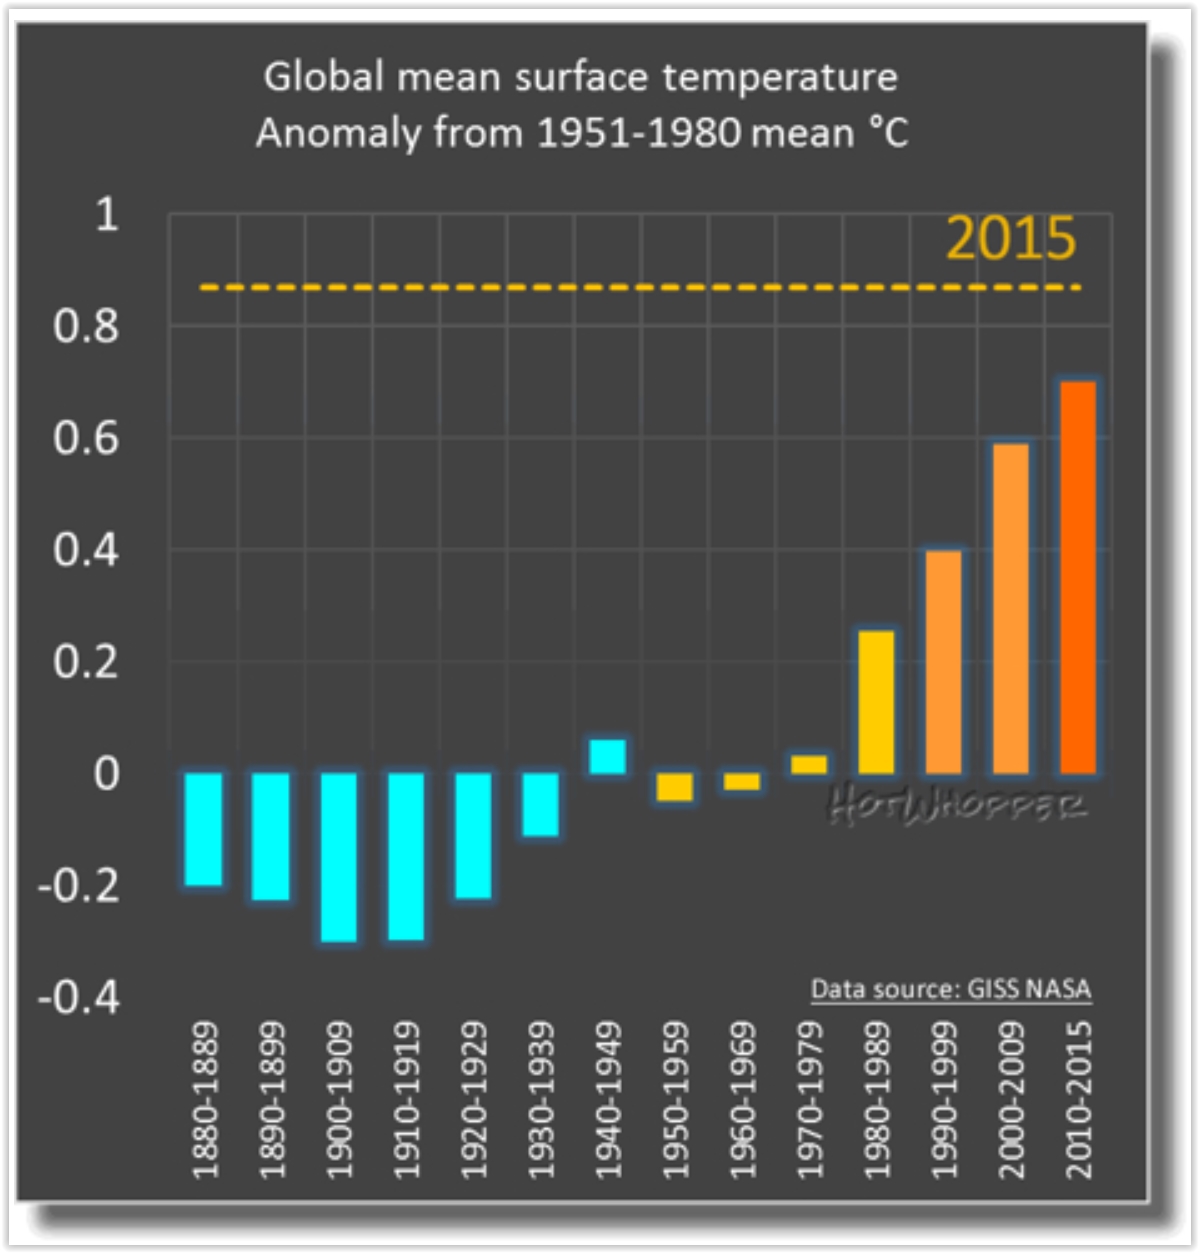
Groundhog Decade: In This Movie, It's Always The Hottest Decade on Record. Here's the intro at ThinkProgress: "Somewhere on a Hollywood movie set for Groundhog Day, Part Two: Bill Murray wakes up to find he’s just lived through the hottest decade on record, just as he did in the 2000s, just as he did in the 1990s, just as he did in the 1980s. And he keeps waking up in the hottest decade on record, until he gains the kind of maturity and wisdom that can only come from doing the same thing over and over and over again with no change in the result. Ah, if only life were like a movie. Here is global mean surface temperature — by decade..."
Graphic credit above: "Global Average Temperature by Decade." CREDIT: HotWhopper.
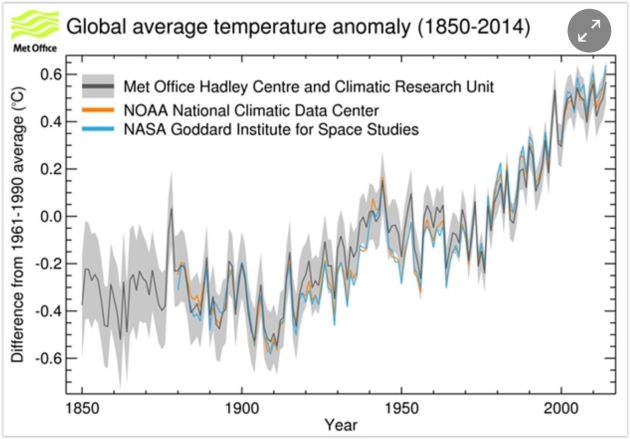
Graphic credit: "Chart showing average global temperatures from 1850 to 2015 according to three major datasets." Photograph: Met Office, UK.
1) Climate change never took a break.
You may have heard that, according to satellite data, there has been no significant warming for the last 18 years. This is grossly misleading. Eighteen years ago, El Niño drove up global temperatures , making 1998 an exceptionally hot year. Contrarians use 1998 as a baseline because subsequent warming appears modest by comparison. However, the mercury has continued its inexorable rise. Since the 1880s, average temperatures have risen 1.8 degrees Fahrenheit, on average. 2015 was the hottest year on record, according to NOAA, and 2016 will likely be even hotter..." (Image credit: NASA).
Long Term Global Warming Requires External Drivers. Here's a summary of new research at the Nicholas School of the Environment at Duke: "By examining how Earth cools itself back down after a period of natural warming, a study by scientists at Duke University and NASA’s Jet Propulsion Laboratory confirms that global temperature does not rise or fall chaotically in the long run. Unless pushed by outside forces, temperature should remain stable. The new evidence may finally help put the chill on skeptics’ belief that long-term global warming occurs in an unpredictable manner, independently of external drivers such as human impacts..."
No comments:
Post a Comment