81 F. high in the Twin Cities Wednesday.
75 F. average high on June 4.
64 F. high on June 4, 2013.
June 4 in Minnesota Weather History. Data: Twin Cities National Weather Service:
1930: Cloudburst at Waseca. 4.3 inches of rain fell over 24 hours.
1915:
This day marked the first of a long stretch of days of measurable rain
at Winton near Ely. Some measurable rain fell on each day until 19th.
The total amount of rain for the fifteen days was over six inches.
 A Sloppy Rut
"Make
your plans, but realize that Mother Nature always bats last".
Translation: we are, and always will be, at the mercy of the elements.
At least the weather pattern is consistently inconsistent, prone to
extended ruts. Last summer it was a "flash drought", then a 3-month
Polar Vortex made us all reconsider what it takes to call yourself a
Minnesotan. Spring was the
14th wettest on record for the Twin Cities (2nd wettest at St. Cloud), and there's every indication this wet phase will hang on into June, possibly longer.
Meteorologists
talk amongst themselves about "persistence", geeky short-hand for
"don't buck the trends." The weather falls into a specific rhythm over
time; odds are it'll stay that way until something knocks it into a new
phase.
With the Summer Solstice little more than 2 weeks away the
core of the jet stream should be howling across Canada. Instead it's 400
miles farther south, meaning Minnesota is seeing the storms Manitoba
should be experiencing.
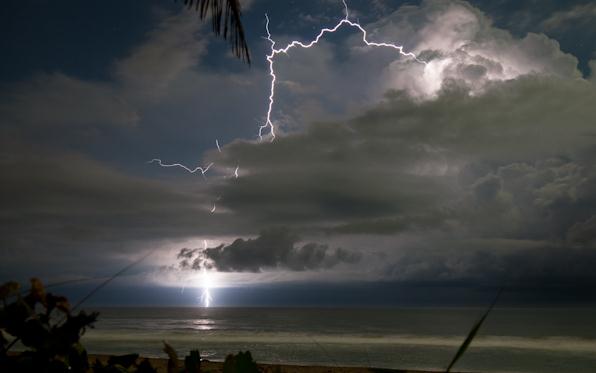
Thunder is possible later today, a shot at 80F
Friday before storms cool us off. Showers linger on Saturday but we
salvage comfortable sun on Sunday.
Next week looks cooler than
normal with another round of showers and thundershowers by midweek, but
I'd wager a (meager) sum that steamy 80s will return the latter half of
June.
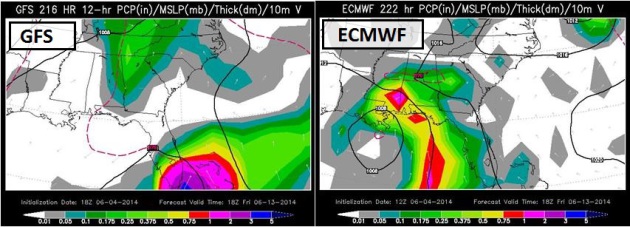
Dueling Models: What Can Possibly Go Wrong on Friday, the 13th?
The GFS has been consistently hinting at some sort of tropical
disturbance impacting south Florida late next week, while the ECMWF
(European) solution shows a possible tropical depression or storm
impacting the central Gulf Coast. It's way too early for specifics, but
keep an eye on the Gulf of Mexico next week. Maps: WSI.
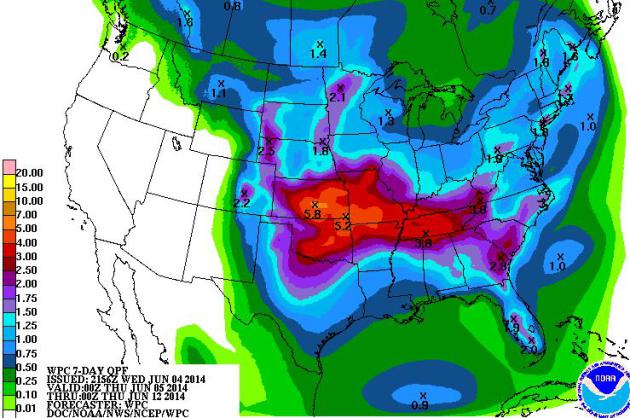
Soaking Rains for Central USA.
NOAA models are in alignment, showing some 3-6" rains over the central
Plains, Middle Mississippi Valley and Tennessee Valley into the middle
of next week; little or no rain west of the Rockies.
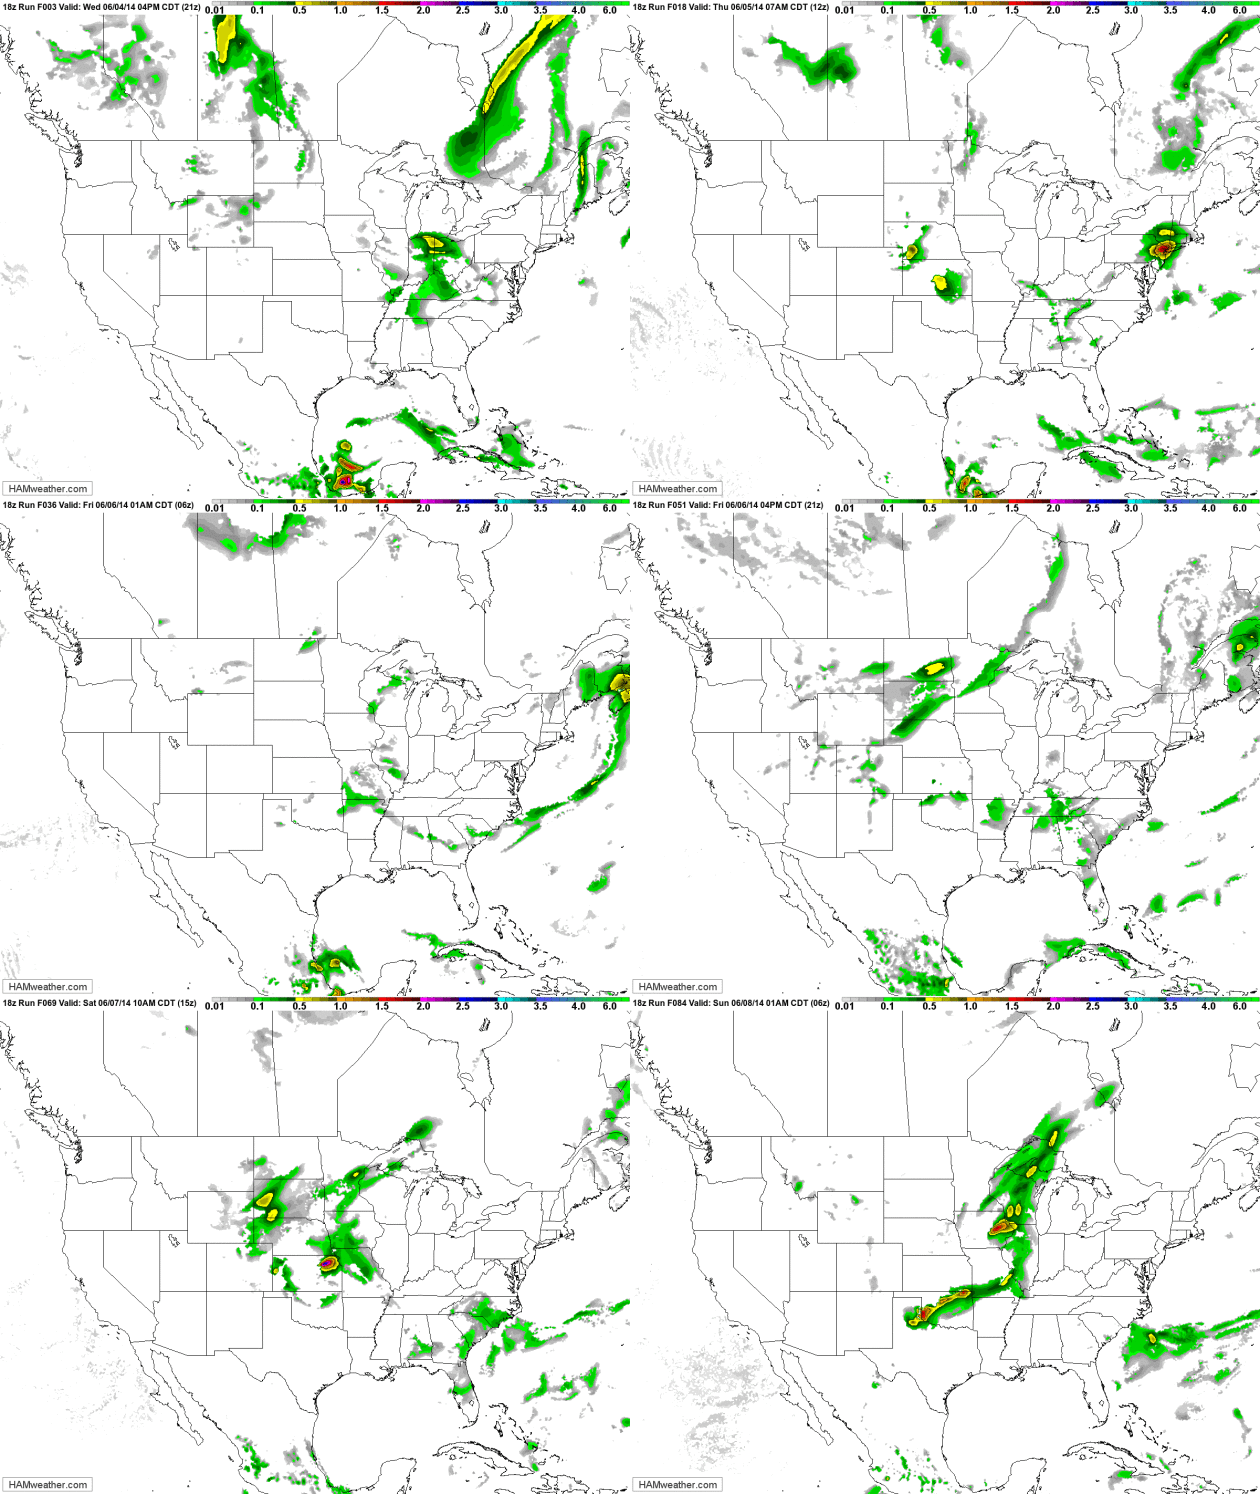
Future Radar.
NOAA's 84-hour NAM shows a few waves of showers and T-storms pushing
across the Upper Midwest into the Great Lakes into Saturday, a clearing
trend for Minnesota by Sunday. Soaking storms linger over the central
Plains, while New England sees showers Thursday into Friday. Loop:
HAMweather.
80F Friday, Then Cooling Off.
We get a break from the worst of the heat and humidity next week with a
streak of 70s; the best chance of rain Saturday, again the middle of
next week. Long-range guidance suggests 80s returning the latter half of
June. Enjoy the break from dew-point-babble.
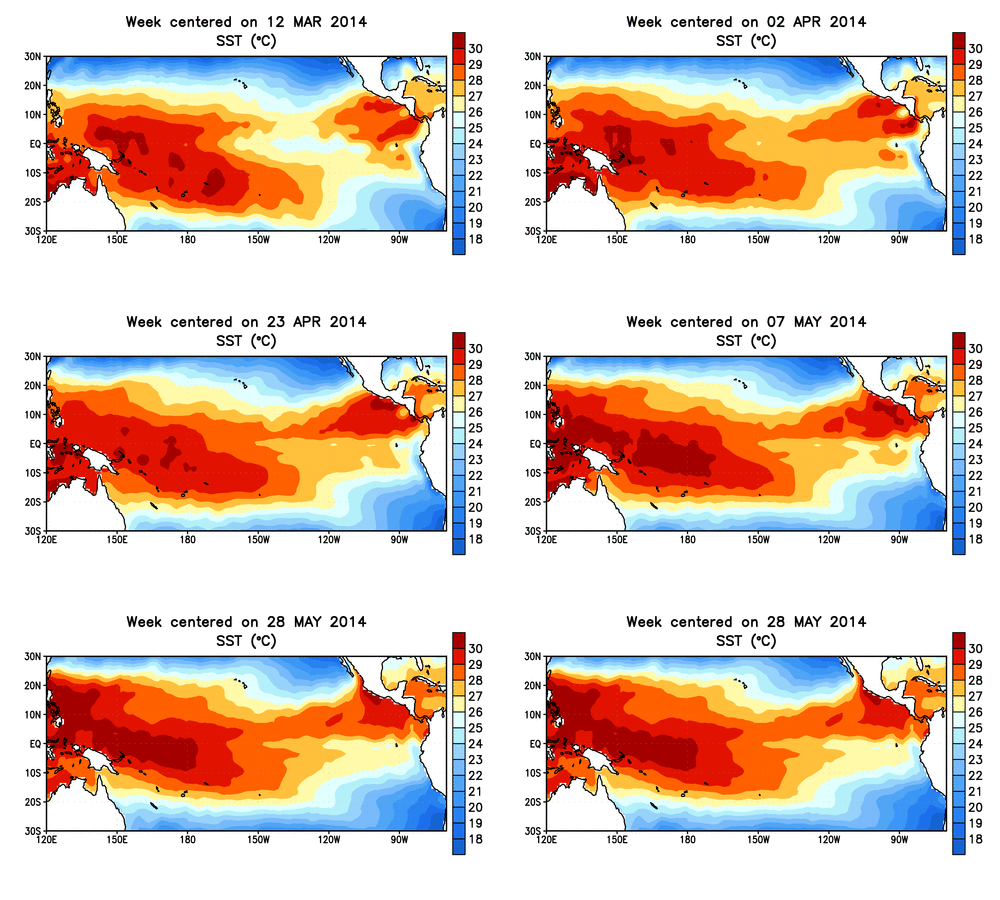
How Will We Know When El Nino Finally Arrives?
Warmth is building in the Pacific; the definition of El Nino is three
consecutive months with water temperatures consistently warmer than .5
C.
Climate Central takes a look - here's an excerpt: "...
Yet
an important question persists: How will we know if El Niño is here? A
seemingly simple question, with an answer that isn’t as simple as
determining when a tropical storm becomes a hurricane. That’s because
there are a number of factors at play for El Niño forecasters with the Climate Prediction Center to
consider when they release their monthly outlook. The next one will be
issued on June 5, and it’s possible they’ll say El Niño is finally here..."
Animation credit above: "
Animation of subsurface temperatures in the tropical Pacific Ocean." NOAA.
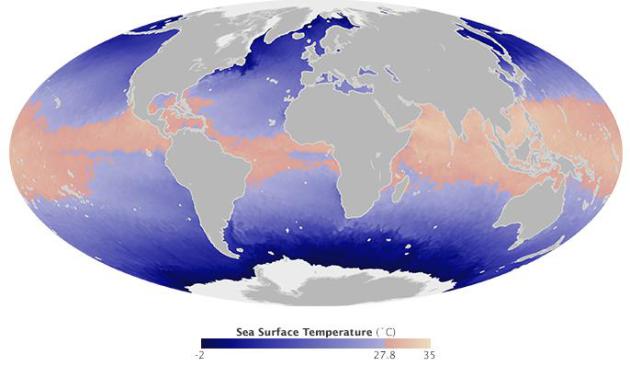
Taking The Temperature of the Hurricane Pool. Here's a clip from
NASA's Earth Observatory: "
According
to the meteorological calendar, hurricane season began on May 15 in the
Eastern Pacific Ocean and on June 1 in the Atlantic. But is the ocean
ready for the season? The map above provides at least a partial answer.
Shades of violet-blue depict water temperatures below 27.8 degrees
Celsius (about 82 degrees Fahrenheit), while shades of pink-red depict
waters above that threshold. Scientists generally agree that sea surface temperatures (SSTs) should be above 27.8°C to promote the development and intensification of hurricanes and cyclones.
(There are some exceptions.) As of May 30, 2014, hurricane-ready waters
in the Atlantic basin were concentrated in the Caribbean, along the
Florida coast, and across the equator between Africa and South America.
In the Eastern Pacific, the fuel for hurricanes stretched the length of
Central America. Note how the supply of hurricane (cyclone/typhoon)
ready waters are much broader and more substantial in the Western
Pacific and North Indian ocean basins, where every season is typhoon
season..."
Could This "Big U" Save NYC From Another Superstorm Sandy?
New York City isn't taking any chances, after Sandy pushed as much as
14 feet of water into Lower Manhattan during Sandy. Here's an excerpt
from
Huffington Post: "
Six
winning entries in a groundbreaking federal design competition to
protect cities from rising sea levels were announced on Monday, and
include a colossal "Big U" system
that will fortify New York City's most vulnerable, low-lying areas.
"Big U" will see the installment of a 10-mile system of berms and other
protections from West 57th Street down to Battery Park and then around
to East 42th Street. In the Lower East Side, park-like berms will be
constructed; near the Manhattan Bridge, artist-designed panels attached
to the underside of FDR Drive will provide light at night but will flip
down for protection during flooding emergencies..."
Image credit: The BIG Team - Rebuild by Design.
The Perfect Time to Arrive at the Airport, According to Math. It's sort of obvious, but easier said than done. Here's a clip from
Huffington Post: "
Few feelings can top the horror of missing your flight. But arriving at the airport too early -- and lingering for eons at the Duty Free shop -- is equally painful. What's a frequent flier to do? The best time to arrive at the airport is as late as feasibly possible, with just enough time to make it to your plane, says mathematician Jordan Ellenberg. The University of Wisconsin-Madison professor explains that every hour spent waiting for your plane at the airport is a "negative unit."
Image credit: Jim LoScalzo, EPA.
Work Creates Less Stress Than Home, Penn State Researchers Find. Confirming your suspicions, here's a snippet from
The Wall Street Journal: "...
In
a new study, published online last month in Social Science &
Medicine, researchers at Penn State University found significantly and
consistently lower levels of cortisol, a hormone released in response to
stress, in a majority of subjects when they were at work compared with
when they were at home. This was true for both men and women, and
parents and people without children..."
Murder Machines: Why Cars Will Kill 30,000 Americans This Year.
Collectors Weekly has an interesting and sobering article; here's the introduction: "
There’s
an open secret in America: If you want to kill someone, do it with a
car. As long as you’re sober, chances are you’ll never be charged with
any crime, much less manslaughter. Over the past hundred years, as
automobiles have been woven into the fabric of our daily lives, our
legal system has undermined public safety, and we’ve been collectively
trained to think of these deaths as unavoidable “accidents” or acts of
God. Today, despite the efforts of major public-health agencies and
grassroots safety campaigns, few are aware that car crashes are the
number one cause of death for Americans under 35. But it wasn’t always
this way..."
The Case for Treating Sugar as a Drug. Sugar is addictive and too much sugar can obviously be very bad for your health; here's an excerpt of a story at
Vox: "...
Once upon a time, sugar was a condiment. Now it's a diet staple.
That's a problem, because as it turns out, we as human beings have a
limited capacity to metabolize it. There are things you can do to up
your metabolism, like vigorous exercise. But the bottom line is we have a
limited capacity to metabolize it — virtually like every poison, kind
of like alcohol. So a little is okay; a lot is not..."
Image credit: Integrative Health and Wellness Center, which has more details on the addictive power of sugar
here.
The Future of Mobile Phones Doesn't Include Phone Calls. Not when you can text and not have to be bothered with a "conversation" right? Here's the intro to an intriguing story at
Quartz: "
The idea of using a mobile phone to actually talk to people already seems quaint to many young people. According to data presented in Ericsson’s latest Mobility Report (pdf), a biannual study of how the world uses phones, mobile phones will be used less and less for calls, and more for video. The
report contains some fascinating nuggets, chief among them this: Voice
traffic on mobile networks will peak in 2015, then revert back to around
2011 levels by 2019..."
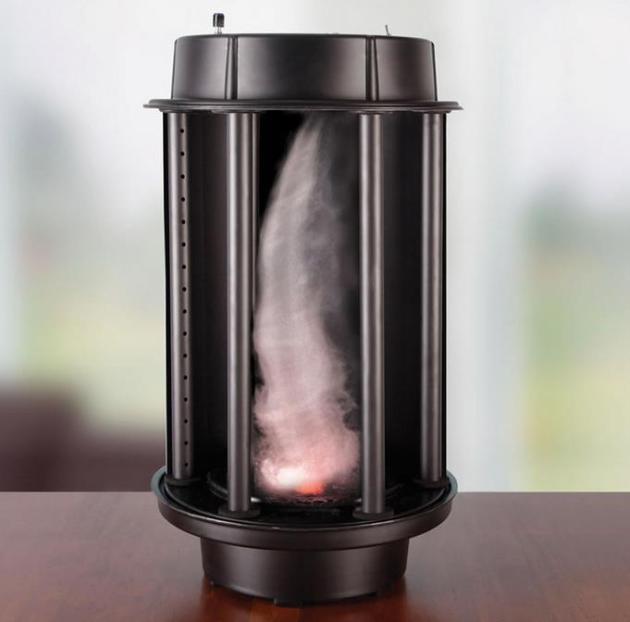
Desktop Tornado Machine. Every home, school and office should have at least one - although $300 seems a bit steep. Details from
The Awesomer: "
Designed
initially for teaching students about how tornadoes form, this tabletop
weather simulation device would look way cooler sitting on your desk
than one of those clacky Newton’s Cradle things."
THURSDAY: AM sun, few PM T-showers. Winds: S 10. High: 76
THURSDAY NIGHT: Patchy clouds, another shower or two. Low: 59
FRIDAY: Some sun, late thunder up north. High: 83
SATURDAY: Cloudy and cooler with more showers. Foul. NE 15. Wake-up: 63. High: 67
SUNDAY: Partly sunny, the nicer day. NE 8. Wake-up: 55. High: 72
MONDAY: Intervals of sun, still comfortable. Wake-up: 54. High: 74
TUESDAY: Lukewarm sun, T-storm at night? Wake-up: 55. High: 78
WEDNESDAY: Big surprise: more showers and T-showers. Wake-up: 60. High: 76
Climate Stories....
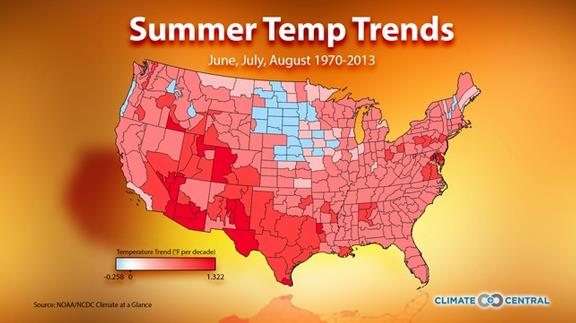
Here's How Much U.S. Summers Have Warmed Since 1970.
Climate Central has the article; here's an excerpt: "...
The
notable blue spot in a sea of red is the Upper Midwest, where
substantial parts of Iowa and the Dakotas have seen a slight cooling
trend since 1970. Interestingly, that region is actually home to some of
the fastest-warming states when you look at the change in annual
average temperatures. Winters in particular have warmed dramatically
there over the past 40 years. Of the 344 climate divisions, which are set by the National Climatic Data Center and divide the country into climatically-similar zones, less than 10 percent have seen a summer cooling trend..."
Graphic credit:
"A map showing summer temperature trends in the U.S. since 1970."
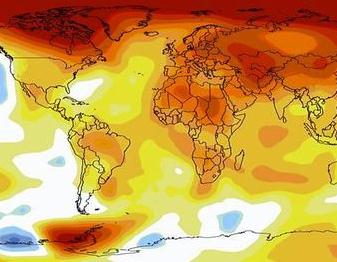
States Most Impacted by Global Warming since 1984? Maine, Vermont, New Mexico & Texas. Here's a clip from
The Star Tribune: "...
All
but one of the lower 48 states have warmed since 1984. North Dakota is
the lone outlier, and cooled slightly. Ten states — Maine, Vermont, New
Jersey, Massachusetts, New Hampshire, Rhode Island, Delaware, New
Mexico, Connecticut and New York — have gotten at least 2 degrees warmer
in the past 30 years. Since 1984, 92 percent of the more than 500
cities and smaller regions within states have warmed and nearly
two-thirds of them have warmed by at least a degree..."
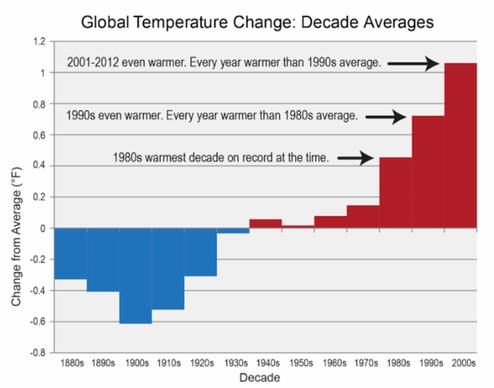
If You Think The Climate Hasn't Warmed Since 1998, Think Again. Here's a graph in the latest National Climate Assessment, courtesy of a post from
Dr. Jonathan Koomey:
"One of the most common Internet memes about climate is the idea that
the earth hasn’t warmed since 1998. This erroneous claim is based on
cherry picking data and ignoring the increase in the heat content of the
oceans, which is where most of the historical warming has been stored.
This issue is explored fully in
this section of the website
Skeptical Science, as well as
another page that explores the right and wrong ways to understand trends, but I recently saw a nice graph that boils it all down..."
Graphic credit: "
The
last five decades have seen a progressive rise in Earth’s average
surface temperature. Bars show the difference between each decade’s
average temperature and the overall average for 1901 to 2000. The far
right bar includes data for 2001-2012." (Figure source: NOAA NCDC). National Climate Assessment, p.796, Figure 7 in Appendix 4."
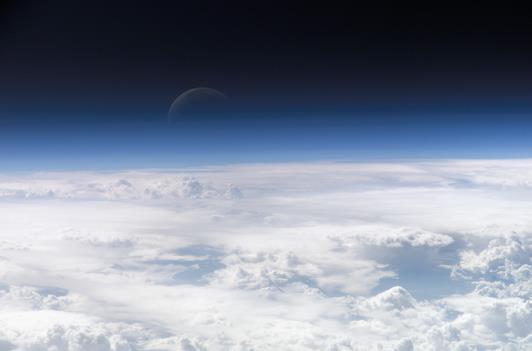
Earth's Atmosphere: A Thin, Blue Line, Not an Endless Dumping Ground for Carbon Pollution. Here's an excerpt from
Discover Magazine: "...
As debate over regulations proposed
by the Obama Administration today to reduce emissions of heat-trapping
carbon dioxide inevitably becomes shrill, you might keep in mind the
image above, and six others in the gallery below. They dramatize an
important fact: Our atmosphere is not an endless dumping ground. In
fact, when seen from the vantage of space, it looks like not much more
than a thin blue line. By 2030, the proposed regulations would cut
carbon emissions from U.S. power plants by 30 percent below 2005 levels.
That cut would result in 2 billion fewer metric tons of carbon dioxide
being dumped into the atmosphere each year — an amount equal to the
emissions from powering more than half the homes in the United States..."
Image credit above: "
The
moon seems to float atop the thin blue line of Earth’s atmosphere in
this photo taken on July 20, 2006 over the South China Sea by an
astronaut aboard the International Space Stations. Blue light is
scattered by atmospheric gases more than other wavelengths of light,
thus giving the atmosphere a blue halo." Source: NASA.
Hugs for Life. Full Disclosure: I'm on the board of EEN, The Evangelical Environmental Network. It's leader, the Rev. Mitch Hescox, wrote a
recent post that resonated with me. Here's an excerpt: "...
Common
sense and our own experience tells us it is better to act sooner to
address a looming threat than to ignore it and wait until it's harder
and more expensive. That's what economists tell us about climate change:
act now or the costs both human and economic will escalate. With each
year of delay, the costs multiply for addressing increased disease,
sea-level rise, extreme weather, food scarcity, and resource conflicts.
It would be great to have a national discussion on the best policy
approaches to address climate change, and as I've said, I think a
market-based approach is best. But it's hard to have a discussion when
one team refuses to acknowledge that there is a problem. Now there are
many reasons that Republicans don't want to discuss climate science, but
I believe it's time that we start to engage and I think most
conservative policy makers agree, at least privately. A few months ago,
during a private meeting, a leading Republican in U.S. House of
Representatives said, "We all know we have to price carbon..."
Study: U.S. Reporters Use More "Weasel Words" in Covering Climate Change.
The words journalists use to cover (anything) can help to sway public
sentiment over the long term. Chris Mooney takes a look at a new paper
at
Mother Jones; here's a clip: "...
And now, a new paper
captures the US media's relative discomfort with climate science in a
new way: By comparing the preponderance of words that suggest scientific
uncertainty about climate change in two US newspapers, the New York
Times and the Wall Street Journal, with the concentration in two Spanish
ones, El País and El Mundo. The study, by Adriana Bailey and two
colleagues at the University of Colorado-Boulder, is just out in the
journal Environmental Communication. It finds a considerably greater
concentration of such uncertainty-evoking words in the US papers in
their 2001 and 2007 coverage of two newly released reports from the
United Nations' Intergovernmental Panel on Climate Change..."
How Obama's Team Sold the EPA Rule. Politico has the story - here's a clip: "...
The
EPA’s proposed carbon emissions standards rule released Monday is one
of the most significant actions the federal government’s ever taken on
climate change. If finalized next year and put in place, it would be one
of Obama’s largest legacy achievements. Making sure that it didn’t seem
like a big deal or all about Obama was all part of Podesta’s plan.
Interviews with Podesta and other senior White House aides on Monday
portrayed a White House that had been closely involved along every step
of the way, from drafting the rule to the roll-out and messaging effort
surrounding it..."
Photo credit above: "
The carbon emissions rule would be one of Obama’s largest legacy achievements." AP Photo.
Ocean Acidification Rate 10 Times Faster than Ancient Upheaval.
Nature World News has the article; here's an excerpt: "
These
days the ocean is acidifying at a rate 10 times faster than it did
during a similar upheaval 56 million years ago. During those ancient
days, researchers estimate that ocean acidity increased by about 100
percent in a few thousand years or more, and levels didn't bounce back
to normal for another 70,000 years. Some species were able to adapt and
evolve to such radical environmental changes, while others perished and
died off..."
Image credit above: "
These days the ocean is acidifying at a rate 10 times faster than it did during a similar upheaval 56 million years ago." (Photo : Pixabay).






No comments:
Post a Comment