51 F. high on Saturday in the Twin Cities. That's average for April 3.
27 F. average high on December 13.
17 F. high on December 13, 2013.
December 13, 1996:
Snowfall exceeding one foot was reported from south central Minnesota
through portions of the Twin Cities metropolitan area. Some of the
higher snow totals included 15 inches at Rockford, 14 inches at Cedar
and North Branch, 13 inches at Stewart and 7 to 10 inches across the
central and southern parts of the Twin Cities metropolitan area.
December 13, 1933: Severe ice storm hits southeast and central Minnesota.
Dirty Gray
No,
this is not halftime. If winter was a football game we'd be 5 minutes
into the second quarter. But I'm grateful for a lack of atmospheric
penalties. 50 degrees a week before the Winter Solstice is a welcome
reprieve. Time to exhale.
A year ago tomorrow the high was 4F in
the Twin Cities. We had already muddled through 5 subzero nights by
December 14, 2013 - a preview of coming attractions.
So I won't
complain about an inversion, fog, drizzle and bad air. An air pollution
advisory is still in effect. I almost drove off the freeway after seeing
the big digital sign overhead reminding me "not to idle". OK. Walk the
dog, wash the car; soak up late March because a minor correction is
coming.
Rain today and Monday ends as an inch of slush Monday
night; the best chance of a coating of snow north and west of the MSP
metro.
That may be the only real chance of snow between now and
Christmas Day. It'll be cold enough for snow by Tuesday, but El Nino
detours big storms south of Minnesota.
I see no evidence of a
bitter blocking pattern similar to last winter setting up. Christmas
2014? A shot at 40F with rain showers. No snow? Not to worry. Remember,
Santa has "rain-deer".
 Nuisance - Almost Plowable Late Monday
.
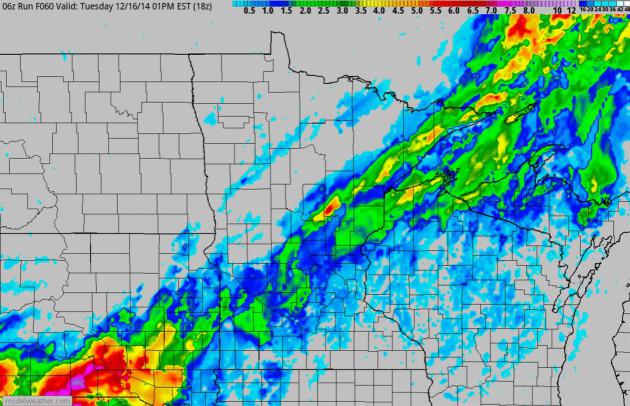
Here's the early morning NAM solution for accumulated snow late Monday
and Monday night as colder air changes the snow back to a wintry mix.
Southern South Dakota picks up a plowable snowfall of as much as 5-8",
with generally 1-3" amounts from southwest into central and northeastern
Minnesota, maybe 4-5" near Crosby. Expect slippery travel late
tomorrow. Source: NOAA and HAMweather.
 Not Much Drama
.
I'm OK with that, by the way. As much as I want a white Christmas I'm
also sympathetic to pre-Christmas travelers who don't want to be stuck
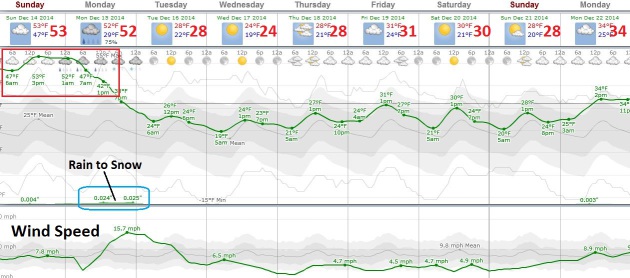
at MSP International Airport. After a balmy Sunday temperatures drop
tomorrow (that 52F is a bit misleading, occurring around midnight).
Temperatures track pretty close to average from Tuesday into next
weekend.
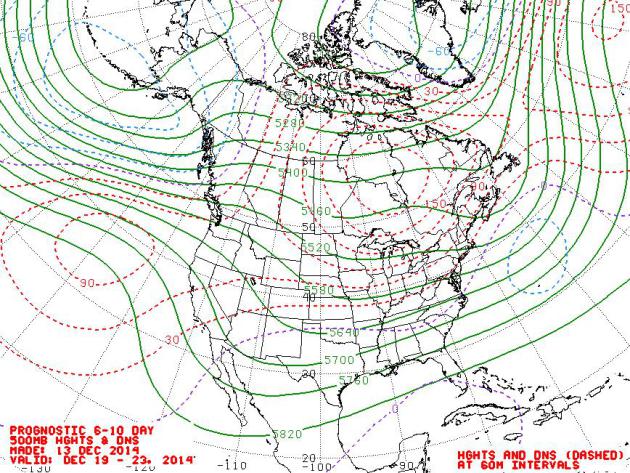
 Steering Wind Outlook: December 19-23.
A modified zonal pattern continues into at least Christmas as jet
stream winds 18,000 feet above the ground blow from Seattle and
Vancouver. At some point colder air will penetrate southward and wipe
the smug self-satisfied smile off our faces, but expect reasonable temperatures through at least the middle of next week. Map: NOAA.
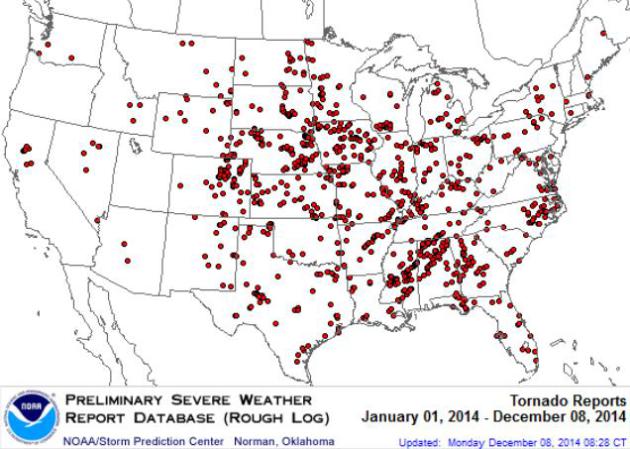
 Tame Tornadoes: Quietest 3 Years For Twisters On Record
.
USA TODAY has the story - here's the introduction: "
The
U.S. experienced fewer tornadoes in the past three years than any
similar span since accurate records began in the 1950s. Yet
meteorologists aren't sure exactly why. As this year comes to a close,
about 150 fewer damaging tornadoes than average have hit the U.S.,
according to data from the Storm Prediction Center (SPC). Explanations for the decrease in twisters the past three years range from unusual cold to unusual heat, or just coincidence..." (Map credit above:
NOAA SPC).
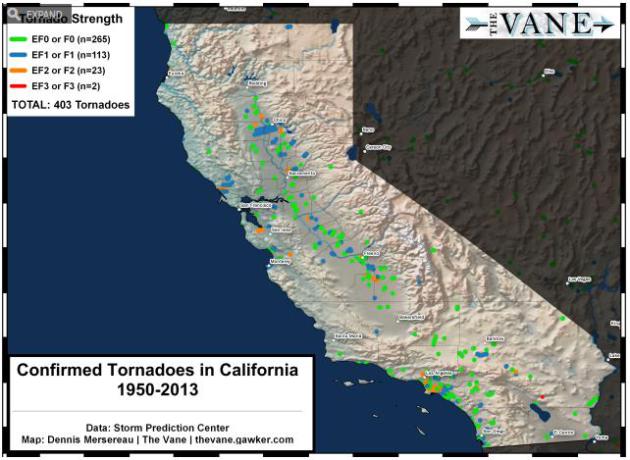
 Maps: Tornadoes in California Aren't As Rare As You Might Think. Gawker
 does a good job of putting Friday's (tiny) tornado in south Los Angeles into perspective; here's an excerpt: "...
Between
1950 and 2013, there were 403 confirmed tornadoes in California, coming
out to an average of around 6 or 7 tornadoes per year. The vast
majority of them occurred in the Central Valley, but you can see a tight
cluster of tornadoes down around Los Angeles. Most of the twisters are
weak, with 66% of those surveyed by meteorologists rating either F0 or
EF0 (we switched from the Fujita Scale to the Enhanced Fujita Scale
in 2007). A handful of tornadoes recorded in the state have been
significant, with 23 clocking in at F/EF2 and two achieving F3 status..." (Map credit: Dennis Mersereau, The Vane).
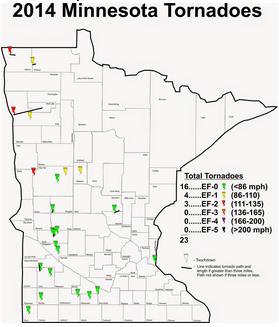
23 Minnesota Tornadoes in 2014.
Yes, it was fewer than average; the coolest year for Minnesota since
1996 took the edge off the tornado count - Dr. Mark Seeley has more
details in the latest edition of
Minnesota WeatherTalk: "...
This
week Todd Krause of the NOAA-National Weather Service in Chanhassen,
MN provided a summary of tornado reports across the state this year.
Only 23 tornadoes were reported in the state during 2014, the second
consecutive year with a smaller than average number (only 15 reports in
2013)..."
"How's The Weather?" Becomes a Loaded Question. Yes, we are all armchair meteorologists (and climate experts) now. Here's an excerpt from a
New York Times article: "...
According
to a recent report by the World Bank Group, extreme weather events
could become the new “climate normal.” In this world of “increased risks
and instability,” it seems we find comfort in being armed with the
facts. With access to the storm-surge of information on our smartphones,
we are all meteorologists now. Just a few years ago, terms like extreme
snowfall or polar vortex were familiar only to professionals; today,
they are bandied about in coffee shops and office elevators..."
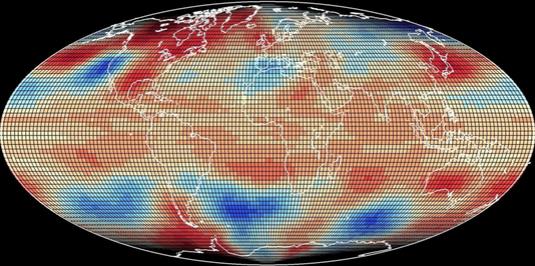
Study: Hot Temperatures Rising Faster Than Cold Temperatures Over Last 30 Years. Meteorologist Jason Samenow has the story at The Washington Post's
Capital Weather Gang - here's a snippet: "...
As
the Earth has warmed over the last three decades, it’s the warmest
temperatures that have warmed the most, a new study finds...To put it
another way, the long-term trend shows global warming concentrated on
easing the severity of the most extreme winter cold, while the short
term trend shows warming focused on intensifying some of the most
oppressive heat..."
Graphic credit above: "
Spatial patterns of temperature differences from normal for April 1998." (University of Indiana)
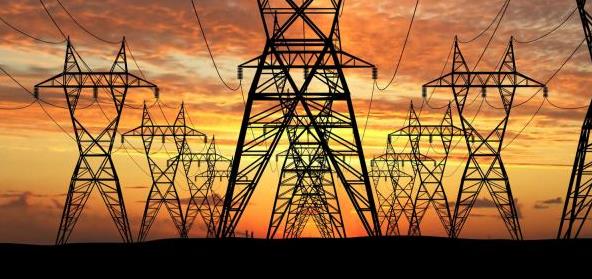
DHS Admits Catastrophic Impact of EMP.
A severe X-class solar flare could knock the USA back to the mid 1800s;
it might take years to get the power grid back up in a worst-case
scenario. Here's the intro to a sobering assessment at
WND.com: "
Buried
in a 303-page report is an assessment by the Department of Homeland
Security that a massive electromagnetic pulse event caused by a solar
flare could leave more than 130 million Americans without power for
years. In spite of the admission of the cataclysmic consequences of an
EMP event, DHS still has not added the threat to its 15 National
Planning Scenarios..."
Sony Pictures Hack: The Whole Story.
Welcome to the opening salvo of CyberWarfare, with the first volleys of
pain directed at a major global corporation. This redefines the meaning
of "hack". Here's an excerpt from
Engadget: "...
Baumgartner says the malware used to harm Sony Pictures, known as Destover,
acts as a backdoor and is capable of wiping disk drives and any Master
Boot Record disk -- in other words, it can sneak into a system,
completely take over and, just like that, have access to the data saved
within. "It does not target consumers," he added. "There may be other
issues for customers, however, that arise out of any business being
hacked and sensitive data accessed..."
Everyone's Worst Page on the Internet. Some perspective on the Sony hack, and why everyone should pay close attention; here's a clip from
The Awl: "...
Look
at your laptop: It could destroy you, even if you’ve done nothing
wrong. This realization should be compounded by the knowledge that most
of what’s “on” your computer actually lives somewhere else, too, in the
servers of companies that are interested in protecting your data only
insofar as it preserves their business interests, which are, generally,
variations on data marketing and the sale of advertising, to which
appearances of privacy and security are helpful. Modern life is a
digital nesting doll of latent blackmail opportunities and neglected,
decaying data warheads..."

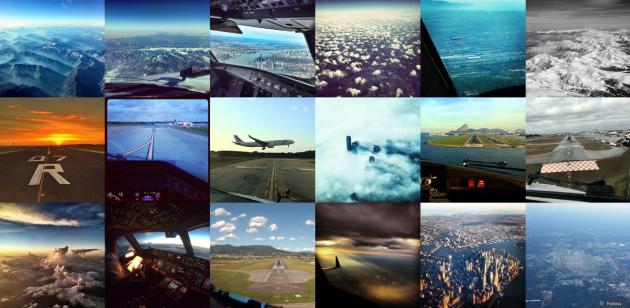
The Pilots of Instagram: Beautiful Views From The Cockpit, Violating Rules of the Air.
Yes, if I was a pilot I'd probably be taking (illegal) selfies with me
and the weather out the cockpit window too - so I sympathize. The FAA
may not be so sympathetic. Here's a clip from
Quartz: "
The
pilots of Instagram are internet famous. Their stunning photos of the
skies, captured from their unusual perspective inside the cockpit,
garner hundreds, sometimes thousands of likes from fans.
But taking photos, or using most any electronic device, while piloting a
commercial aircraft is prohibited by American and European regulators.
Pilots for airlines large and small, flying planes of all sizes, seem to
be violating the safety rules, taking photos with their phones as well
as GoPro cameras mounted inside the cockpit..." (Images above: Instagram).
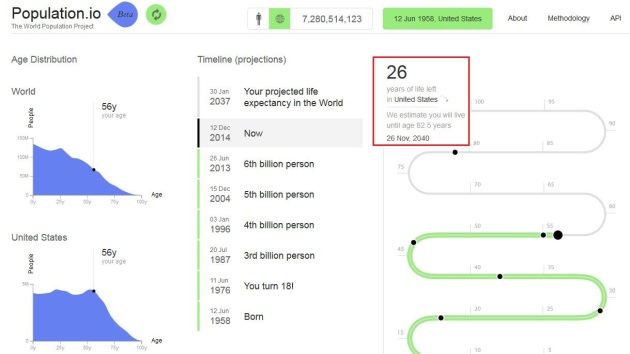
How Much Longer Will You Live? O.K. This is a little morbid, but based on demographics, your age, where you were were born and where you live,
Population.io
can calculate how many years you have left. It doesn't take current
health into effect, so I'm a bit skeptical. Maybe it's a defense
mechanism. Pour yourself a stiff drink first. Oh, it calculated that I
share a birthday with 185, 273 people, and I get an extra 3 years of
life expectancy for living in the USA. I can't say I'm looking forward
to November 26, 2040, although by then I may be more than ready to meet
my maker.
 The Cutest Panda You'll Ever See
. Check out this clip at
Huffington Post for an "ah-cute" moment.
 TODAY
TODAY: March-like. Rain and fog. Winds: South 5-10. High: 51
SUNDAY NIGHT: Periods of rain. Low: 38
MONDAY: Rain ends as slushy coating to 2" late. High: 40 (falling during the day).
TUESDAY: Slick start? Clouds linger, colder. Wake-up: 19. High: 27
WEDNESDAY: Rare ration of sunlight? Chilly. Wake-up: 14. High: 25
THURSDAY: Clouds increase, still dry. Wake-up: 19. High: 29
FRIDAY: Mostly cloudy, few flakes? Wake-up: 21. High: 31
SATURDAY: More clouds than sun, quiet. Wake-up: 20. High: 30
Climate Stories....
 Weather Bombs, Polar Vortex: Global Warming's Influence on Extreme Weather.
 No, it's probably not your imagination. Here's an excerpt from Stanford and
Science 2.0: "...
The
media are often focused on whether global warming caused a particular
event," says Diffenbaugh, who is a senior fellow at the Stanford Woods
Institute for the Environment. "The more useful question for real-world
decisions is: 'Is the probability of a particular event statistically
different now compared with a climate without human influence?'" His
belief is based on three elements of varying rigor: climate
observations, climate computer simulations which estimate variations in
climate and statistics to reconcile the first two..."
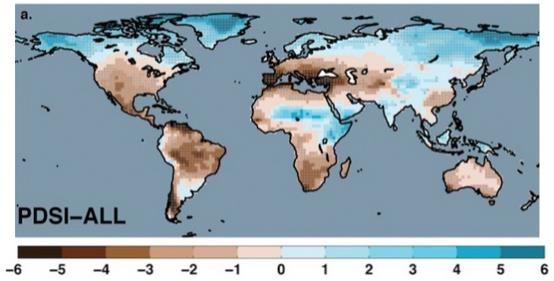
What We Learned About Climate Change in 2014, in 6 Scary Charts. Here's an excerpt from ThinkProgress: "...
The
2014 chart I consider the most important is not the prettiest or
simplest. But it is the one that best captures our latest understanding
of what has emerged as the greatest danger to humanity this century from
human-caused climate change — Dust-Bowlification and the threat to our food supplies. This map of the global drying we face uses the Palmer Drought Severity Index (PDSI), a standard measure of long-term drought. It is excerpted from the study, “Global warming and 21st century drying...”
Graphic credit above: "
Palmer
Drought Severity Index (PDSI) for 2080-2099 with business-as-usual
warming. By comparison, during the 1930s Dust Bowl, the PDSI in the
Great Plains rarely exceeded -3 (see here)." Source:
Cook et al. and Climate Progress.
How America Is Kicking Its Oil Habit. Bloomberg has the story; here's the introduction: "
The
U.S. is producing the most oil in 31 years, economic growth is picking
up and crude prices are plunging. So why is Americans’ use of petroleum
waning? As the U.S. moves closer and closer to energy independence,
greater fuel efficiency,
changing demographics and an increase in renewables are altering the
dynamic that in the past would have seen demand for gasoline climbing.
Gross domestic product, the value of all goods and services produced in
the U.S., grew at a 2.4 percent pace in the third quarter from the
year-earlier period. Oil consumption fell 0.3 percent, government data show..."
Alarming Quantities of Methane Escaping From Pacific Seafloor, Scientists Warn.
Remember, we don't know what we don't know. A comforting thought. That
said, we might want to err on the side of caution. Here's the intro to a
story at
Tech Times: "
Scientists
have discovered that water off the coast of Washington is warming at a
depth where solid methane can transform into gas, indicating that the
warming of the ocean is triggering the release of the heat-trapping
greenhouse gas. Methane, which is several times more potent than carbon
dioxide in fueling global warming, forms into methane hydrate wherein it
gets enclosed in frozen water given the right conditions: cold
temperature and high ocean pressure..." (File image: ThinkProgress).
Fact or Fiction? Geoengineering Can Solve Global Warming. Here's a clip from a story at
Scientific American: "...
The world may find itself in need of another alternative, such as geoengineering,
if catastrophic climate change begins to manifest, whether in the form
of even more deadly heat waves, more crop-killing droughts, more rapid
rises in sea level or accelerating warming as natural stores of
carbon—such as the ocean’s methane hydrates—melt
down, releasing yet more greenhouse gases to drive yet more climate
change. So maybe the answer is to genetically soup up plants so they can
pull more CO2 out of the air and then bury them at the sea bottom?..."
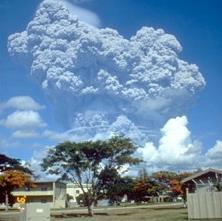
Photo credit above: "
ARTIFICIAL
VOLCANO: Could mimicking a massive volcanic eruption, like that of
Pinatubo in the Philippines in 1991, avoid global warming?"
Courtesy of U.S. Geological Survey





.jpg)

No comments:
Post a Comment