2 EF-5 tornadoes confirmed (last time this happened was 1990).
20 EF-3 or stronger tornadoes in Wednesday's outbreak.
11 major severe storm outbreaks across the USA in April.
453: preliminary April tornado count before last Wednesday's outbreak
163: average number of USA tornadoes in April.
322: average number of USA tornadoes in May.
1925: last time America suffered more tornadoes fatalities than 2011 ("Tri-State Tornado" struck Missouri, Illinois and Indiana).
___________________________________________________
.48" rain over the last 24 hours at MSP.
60 F. high reported in the Twin Cities yesterday.
50 F. high predicted for today (average high for April 2, 3).
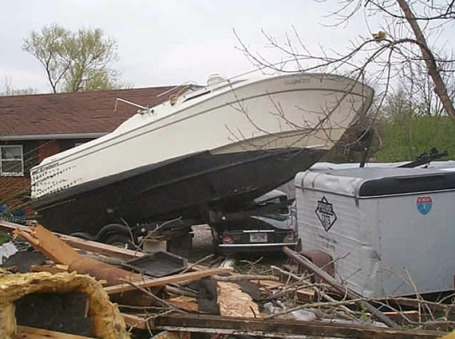
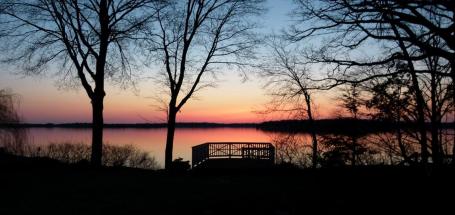
Die-Hard Boaters. "Our boat is in the water and we're going to use it!" This is the one and only boat I saw on the lake yesterday, braving 30 mph gusts and windblown sprinkles.
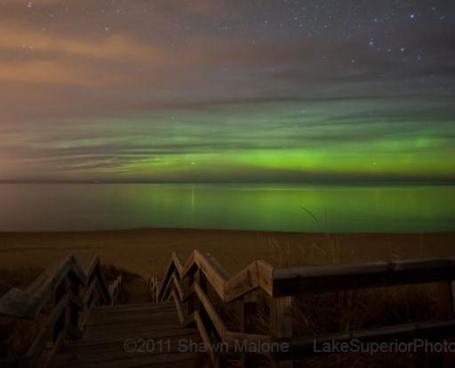
Aurora Alert. A major geomagnetic storm is underway, triggered by recent solar flares. Here's more from Spaceweather.com: "A solar wind stream hit Earth's magnetic field during the early hours of April 30th, sparking a high-latitude geomagnetic storm (slowly subsiding). In the United States, auroras descended as far south as Marquette, Michigan, where Shawn Malone took this picture before sunrise. "High humidity and clouds dampened the light a bit, but the green liights were still bright enough to reflect off the waters of Lake Superior," says Malone. High-latitude sky watchers should remain alert for auroras. The solar wind speed is high and gusty, and NOAA forecasters estimate a 40% chance of more geomagnetic activity during the next 24 hours."
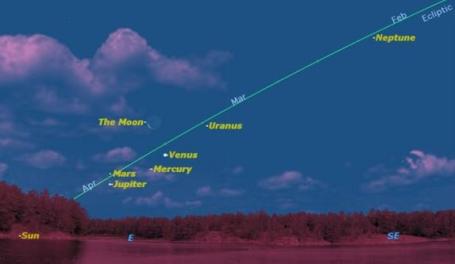
Six Planets Aligned In The Dawn Sky. If you care to get up early and check out a pretty amazing celestial sight, here's more information from space.com: "If you get up any morning for the next few weeks, you’ll be treated to the sight of all the planets except Saturn arrayed along the ecliptic, the path of the sun through the sky. For the last two months, almost all the planets have been hiding behind the sun, but this week they all emerge and are arrayed in a grand line above the rising sun. Mercury, Venus, Mars, and Jupiter are visible, and you can add Uranus and Neptune to your count if you have binoculars or a small telescope. This sky map of the six planets shows how they should appear at dawn to observers with clear weather and an unobstructed view."
More Like April 1. Considering the sun is as high in the sky as it was in mid August, it's hard to believe much of Minnesota will be stuck in the 40s today, nudging 50 south of the Twin Cities metro. Instability showers are likely up north, a mix of clouds and sun over central and southern MN (skies will be mostly cloudy by afternoon).
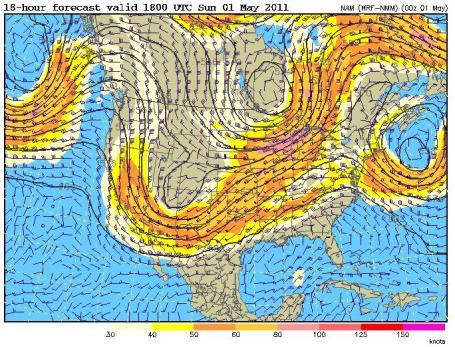
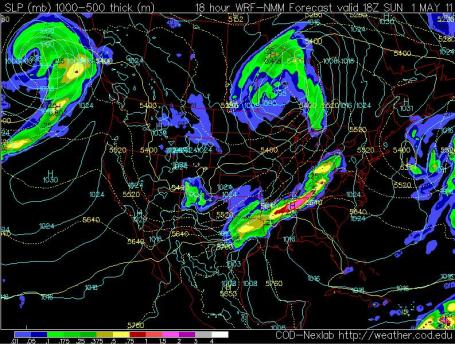
Jet Stream: Southerly Detour. Whether it's La Nina or some other factor, the core of the westerlies have been 300-600 miles farther south than average, fairly consistently now, for the last few months. That has kept Minnesota and the northern tier states cooler than average, setting up a more extreme north-south temperature contrast. The result, high-velocity winds blowing over warm, unstable air bubbling north from the Gulf of Mexico - ripe conditions for supercell thunderstorms and tornadoes. (500 mb winds, about 18,000 feet above the ground, valid 1 pm today).
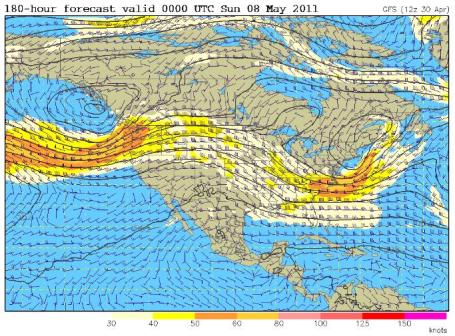
Shift In The Pattern? I keep waiting for a significant northward shift in the jet stream. The GFS is hinting at a more northerly track to high-speed winds by next weekend, which should be good for a streak of 60s, a slight chance of 70 - but I still don't see any 80-degree warmth looking out the next 2 weeks.
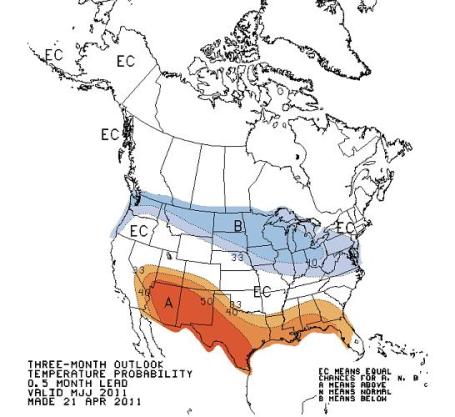
Let's Just Pretend I Didn't Show You This. I don't want to believe it either, but there's something to be said for going with current trends, going with the flow. CPC, the Climate Prediction Center, predicts a bias toward cooler than average temperatures May, June and July over the northern tier states. The La Nina That Wouldn't End. Let's hope this one is dead wrong. We've earned a REAL summer.
288 Tornadoes? April 2011 Tornado Information. Here's the very latest summary of last Wednesday's historic tornado outbreak from NOAA: "NOAA's preliminary estimate is that there were 288 tornadoes during the entire outbreak from 8:00 a.m. EDT April 26 to 8:00 a.m. April 28, 2011.
- During the 24-hour period from 8:00 a.m. EDT April 27 to 8:00 a.m. EDT April 28, The National Weather Service (NWS) estimates there were a total of 211 tornadoes.
- NWS issued outlooks five days in advance, watches hours in advance, and tornado warnings with an average lead time of 24 minutes. NWS issued warnings for more than 90-percent of these tornadoes.
- The largest previous number of tornadoes on record in one event occurred from April 3-4, 1974, with 148 tornadoes.
- This is the most people killed by tornadoes in a two-day period since April 5-6, 1936, when 454 people were killed, mostly in Tupelo, Mississippi and Gainesville, Georgia.
- This is the deadliest single day for tornadoes since the March 18, 1925, tornado outbreak that had 747 fatalities across 7 states (including the Tri-State Tornado).
- The Tuscaloosa-Birmingham tornado during the April 2011 event caused at least 65 fatalities.
- These are the most fatalities from a single tornado in the United States since May 25, 1955, when 80 people were killed in a tornado in southern Kansas with 75 of those deaths in Udall, Kansas.
- The deadliest single tornado on record was the Tri-State tornado (MO, IL, IN) on March 18, 1925, when 695 died.
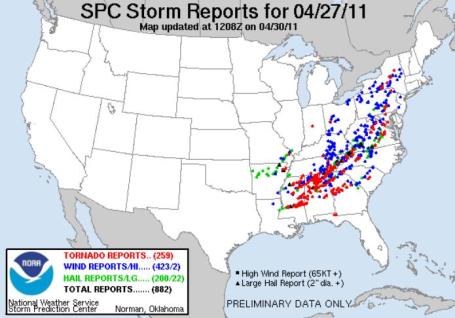
Preliminary Tornado Count: 259. It's an almost unimaginable number, and I keep waiting for SPC and damage assessment teams on the ground to adjust that number downward (the result of multiple observations of the same tornado - it can take a few days to clear up confusion to come up with the real number of tornadoes). The number is a moving target. The post above mentions 288 tornadoes, the SPC web site lists 259. Bottom line: it's looking more and more likely that last Wednesday's staggering oubreak surpassed the previous record of 148 tornadoes in a 24 hour period on April 3-4, 1974, the "Super Outbreak."
Several Violent Tornadoes Confirmed From Tornado Outbreak. An update from WEAU-TV: "Nearly 20 tornadoes of violent intensity have been confirmed so far in the South from April 27th's outbreak of deadly twisters. Violent tornadoes are considered to be EF-3 or higher. The National Weather Service estimates 211 tornadoes touched down on April 27th. Two of the tornadoes have already been deemed an EF-5 tornado with winds over 200 mph. One of the tornadoes tore through portions of Mississippi. The tornado reportedly totally demolished modern 2 story buildings and even uprooted fire hydrants. The second tornado ripped through Hackleburg, AL. Last time there were multiple EF-5 tornadoes was back in 1990. The Tuscaloosa tornado has not totally been confirmed, but the current thinking is that the tornado that ripped through the town was a monster EF-4 tornado. So what is the EF scale or enhanced Fujita scale? Here is a break down. The EF scale was adopted in 2007 to more correctly verify a tornadoes wind speeds and in turn it's spot on the scale. Meteorologists and engineers teamed up to better understand how fast the winds have to be going to cause the damage done to certain materials and structures. This makes the EF scale more accurate. Here's what wind speed range corresponds with each number on the scale:
EF-0 (Gale): 56-85 mph
EF-1 (Weak): 86-110 mph
EF-2 (Strong): 111-135 mph
EF-3 (Severe): 136-165 mph
EF-4 (Devastating): 166-200 mph
EF-5 (Incredible): >200 mph
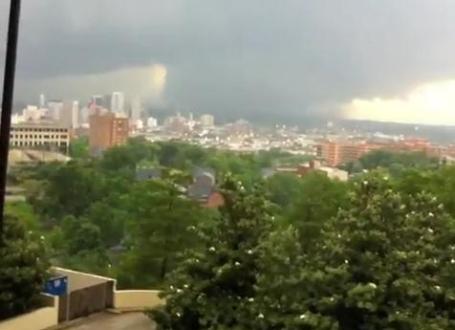
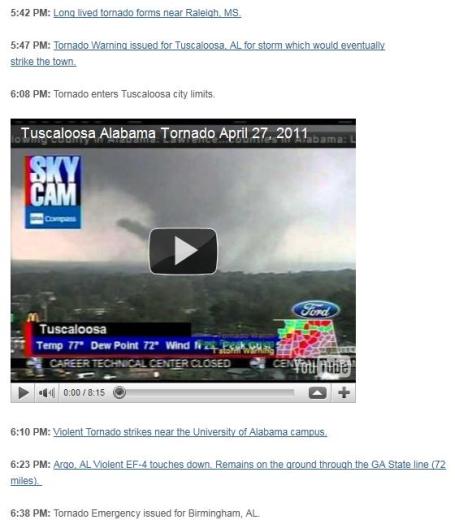
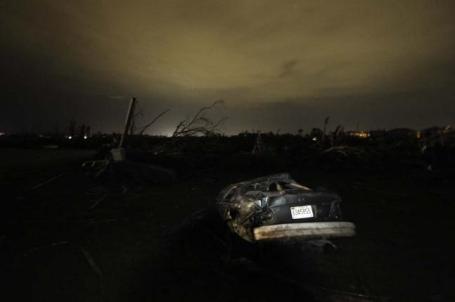
Birmingham "Wedge". The problem with huge, violent tornadoes (among other obvious challenges): they can be so massively wide that they don't even look like tornadoes. The tornado that raced across Birmingham at 40-50 mph was more than a mile wide at times, a far cry from the classic funnel-shape you think of when you think tornado. If you were to look out your office window and see this, you might think it's just a heavy shower or T-storm. Flashes from powerlines would be a tip-off this is no ordinary storm. So would strong rotation, or even a shower of random debris floating past your window. Details of the YouTube clip: "A 2.5-mile tornado cuts through Birmingham. Because the funnel is so large, we don't realize we're looking at the actual tornado until about halfway through the video."
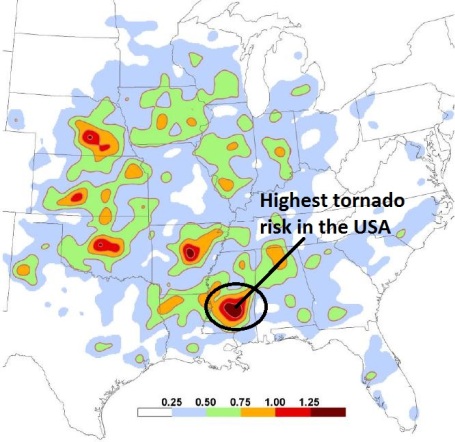
Tornado Risk Analysis: Is "Dixie Alley" An Extension of Tornado Alley? Southern Mississippi? Researchers P. Grady Dixon and Andrew Mercer at Mississippi State University have done extensive research into the probability of tornadoes in the USA. Their findings are nothing short of shocking. Smith County, Mississippi has the highest tornado risk in the nation, an average of 1.4 tornadoes or more/year within a 25 mile radius. The preliminary draft of this AMS report can be found here. The greatest risk in Minnesota seems to be in the Austin/Albert Lea area. More on the report and scale for the map above: "Density calculations of average annual tornadoes within 25 mi of any point. Regional maxima values include 1.48 in Smith County, Mississippi, 1.37 in Lonoke County, Arkansas, 1.28 in Hall County, Nebraska, and 1.27 in Oklahoma County, Oklahoma."
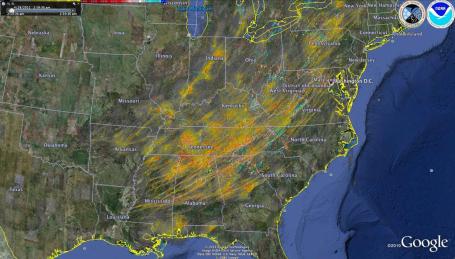
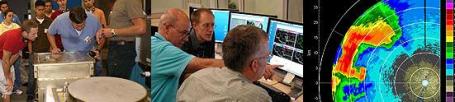
NSSL Product Captures April 27 Tornado Outbreak Storm Rotation Paths. Check out the vast part of America impacted by rotating "supercell" thunderstorms last Wednesday, according to this post from NSSL. We didn't have Doppler radar during the "Super Outbreak" of April 3-4, 1974, no way to compare this directly, but I can't ever recall seeing such a huge amount of American real estate impacted by violent, rotating "mesocyclones" capable of damaging hail and tornadoes: "NSSL has released an image documenting the rotation tracks of the devastating tornadoes on April 27. Bright reds and yellows show more intense circulations. The image of the rotation tracks was produced by the On Demand Severe Weather Verification System, part of NSSL’s Warning Decision Support System – Integrated Information (WDSS-II) Multi-Radar/Multi Sensor platform. On Demand is a web-based tool that can be used to help confirm when and where severe weather occurred. On Demand uses data gathered and sorted by WDSS-II to estimate the tracks of rotating storms and where hail fell. The rotation tracks or hail swath data can be overlaid on high-resolution street maps in Google Earth/Maps to pinpoint areas affected by the hazardous weather. The WDSS-II system receives data in real-time from the nationwide networks of weather radars, satellites, surface observations and lightning detectors. WDSS-II then processes, analyzes and displays the data in a way that is useful to people who need to diagnose severe weather quickly. The platform is available to the public online, and is being used by several local American Red Cross chapters, emergency managers and National Weather Service Forecast Offices for disaster assessment and response.
To create your own maps, go to: http://ondemand.nssl.noaa.gov/"
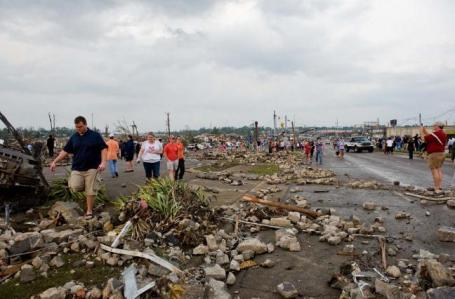
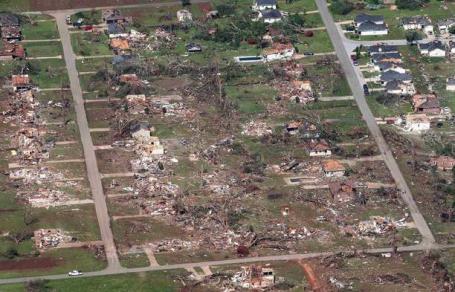
Tuscaloosa Tornado: Before and After. From storyful.com: "Alabama town Tuscaloosa was hit badly by a tornado as is clear from this image. Google and GeoEye have released updated imagery of the location and we’ve gone through some before and after images that show just how devastating the tornado was."
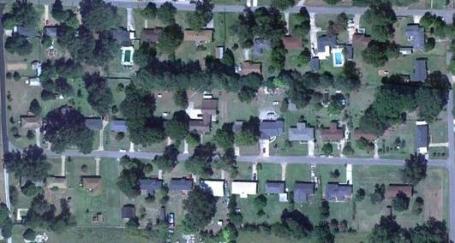
Tuscaloosa: Before April 27, 2011. A close-up satellite image of a close-in neighborhood of Tuscaloosa, courtesy of Google and GeoEye.
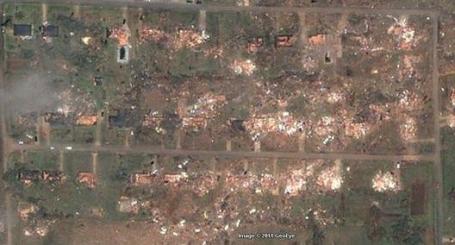
Tuscaloosa: After April 27, 2011. The neighborhood is almost unrecognizable. Keep in mind that tornado winds in an EF-4 are roughly double that of an average hurricane, but the wind power increases by a factor of 4. During a hurricane winds build gradually. A tornado's winds are sudden: 20 mph to 150-200 mph in a matter of seconds, increasing the stress on roofs, load-bearing walls and studs. More stunning before/after examples from Tuscaloosa here.
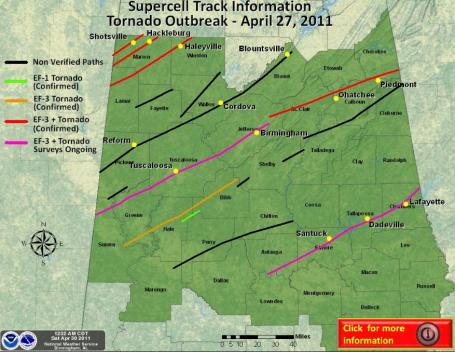
Supercell Track Information: Tornado Outbreak of April 27, 2011. The latest from NOAA.
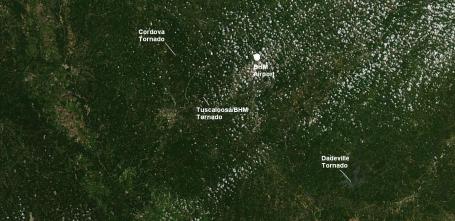
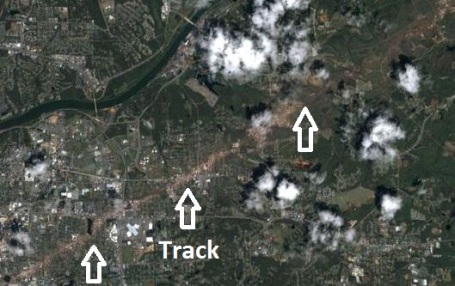
Tornado Tracks From Space. TV meteorologist James Spann (who did a remarkable job tracking the monster tornadoes that hit Tuscaloosa and Birmingham) has a high-res image showing the tornado "scars" left behind from last Wednesday's outbreak - a brown/beige discoloration of debris that stands out from the normally green, lush vegetation. Click on this link and you can clearly see these tornado tracks from NASA's low-orbiting Terra satellite.
Tornado Timeline. The meteorologists at Convective Addiction have done a good job showing the chronology of last week's epic tornado outbreak, starting on April 25, leading up to the chain of increasingly urgent bulletins and warnings, hours before any tornadoes actually touched down. Check out the timeline here.
Tornado Outbreaks Then And Now - Apples And Oranges? The Weather Channel's Greg Forbes (another fellow Penn Stater!) has some interesting observations about Wednesday's record outbreak. In spite of considerable warning and amazing technology, the sad reality is that (some) large/violent tornadoes may not be survivable, unless you can get below grade, below ground, in a basement or reinforced shelter: "Early in my graduate school experience I had the privilege of surveying the damage from many of the April 3-4, 1974 Superoutbreak tornadoes as part of Dr. Fujita's team. 148 tornadoes struck in 48 hours. Six of the tornadoes in that outbreak were rated F5 (on the original Fujita Scale) and 30 were rated F4 or stronger. There were more than 300 fatalities, over 5000 injuries, and the sum of tornado path lengths exceeded 2500 miles. The Superoutbreak has been the benchmark for all tornado outbreaks since. I always thought that there was a chance that some future tornado outbreak might be worse. The most recent one could be, at least in some respects. Damage surveys are still in progress that will bring us the true count of the number of tornadoes, their EF-Scale ratings, path lengths and widths, and other measures of the outbreak's fury. The National Weather Service, using preliminary data, has already indicated that its tornado count might exceed the number of tornadoes in the Superoutbreak. Once Doppler radars were deployed across the United States in the early 1990s, though, I never thought I'd see a tornado outbreak kill hundreds of people again. How sad that it has happened on Wednesday. More than 200 people were killed in Alabama alone and more than 300 in total, according to news reports! The Doppler radars allow us to see tornadoes and their parent thunderstorms' rotating updrafts like never before, and the National Weather Service issues tornado warnings with an average of 13 minutes of lead time (in advance of the tornado), and often much more than that. Combine that with so many more - and more efficient - ways of getting the warnings in this internet era and it's a "different world" relative to the 80-character-per-second teletypes that gave warnings to the media (and not directly to the public) back in 1974....It's apples versus oranges in the relative ability for people to know a tornado was coming in the two eras. Yet so many died in 2011. That must be a function of the violence of the tornadoes, combined with the fact that so many took aim on communities rather than rural areas. And when tornadoes are violent, even being warned and taking proper safety measures is no guarantee of survival. Finding proper shelter improves your odds, but only being in an underground shelter or specially designed in-home shelter can ensure your survival."
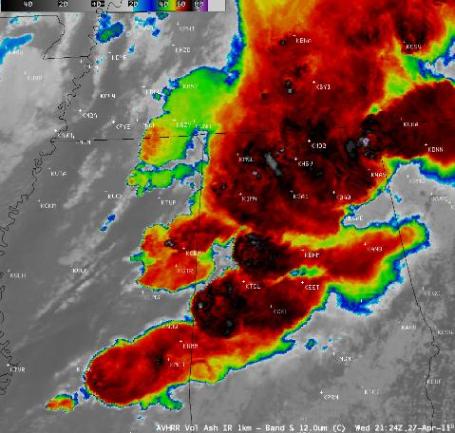
Anatomy Of An Even Bigger "Super Outbreak." 1974 had set the standard for major, long-lasting and violent tornadoes. That's before 2011 came along. The University of Wisconsin (CIMSS) site has more details on the meteorological ingredients that converged to produce killer supercells: "The tornado outbreak that affected much of the Southeast US on 27 April 2011 was one of historic proportions, in terms of the number of strong to violent tornadoes produced and the number of resulting fatalities. McIDAS images of 1-km resolution GOES-13 0.63 µm visible channel data (above; click image to play animation; also available as a QuickTime movie) showed the multiple clusters of severe thunderstorms that developed across the region during the day. The GOES-13 satellite had been placed into Rapid Scan Operations, supplying imagery as frequently as every 5-10 minutes. AWIPS images of 4-km resolution GOES-13 10.7 µm IR channel data (below; click image to play animation) showed the first round of large storms with cold cloud top IR brightness temperatures (red to black to white color enhancement) that moved through the area during the pre-dawn hours (which produced mainly damaging wind reports), followed by the development later in the afternoon and early evening hours of the stronger storms that produced numerous reports of large hail and strong tornadoes ahead of an advancing cold front (SPC storm reports)."
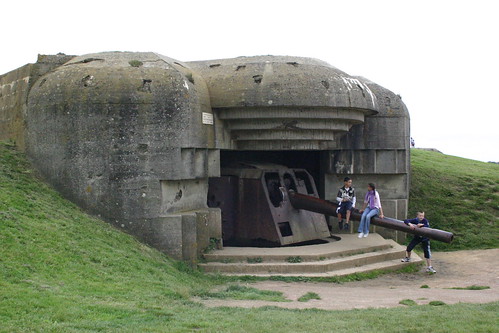
Guessing Games (Remember "Battleship"?), Tornadoes, and Lambert-St. Louis International Airport. Professor Roger Pielke Jr's web site has a special guess post from Bill Hooke, Director of the American Meteorological Society's Policy Program which is worth checking out: "Today [April 23] St. Louis suffers, but breathes a sigh of relief. Last night a storm moving through the area spawned high winds, hail, and one or (possibly) more tornadoes that destroyed dozens of homes and hit the main terminal building of Lambert-St. Louis International Airport, badly damaging the roof, and scattering glass throughout the structure. As of this morning, the airport remains closed indefinitely, with officials saying it will take days to put the facilities to rights. Miraculously, though several people were injured, no one was killed. Sounds trite, but it could have been worse. Across the nation, the catastrophe is but the most recent of this spring. Recall that the United States is really the tornado capital of the world; only 10% of tornadoes occur anywhere else around the globe, and they’re the weaker ones. And this year, tornadoes have been in our news for weeks. Tornadoes present a unique challenge to the public – that would be the some 200 million of us who live in harm’s way – to policymakers, and to hazards managers. Think about it. The strongest tornadoes pack winds approaching 300 miles per hour. That’s twice the wind speed that you see in the category-5 hurricanes. And the force goes as the square of the wind speed, meaning the greatest tornadic winds pack four times the wallop. In principle, we could design structures that would survive such power. In fact, armies did, in World War, to protect gun emplacements from artillery shells. They called them pillboxes. Much of the structure lay below grade.
"So the area likely to be damaged by all the tornadoes of a single year might be comparable to the area of property loss affected by a single hurricane."
"Now let’s compare the 1000 square miles damaged each year, first with the 2 million square miles of U.S. land in tornado-risk areas. Any particular point (a home, or a building)? Maybe only one in 2000 is hit in any given year. That means (pointy-headed statistical alert) that your house has a 50-50 chance of being hit over a 1300-year period. And even if my back-of-the-envelope calculation is off by, say, a factor of four (quite likely, by the way), the risk of the tornado hitting your actual house might be as low as say once in 300 or so years. Seems like a long time, maybe."
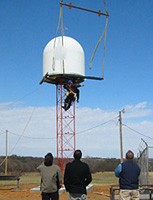
A System To Speed UP Tornado Forecasts. The New York Times reports on a new generation of (much smaller) radar systems being deployed in the Dallas/Ft. Worth market, in an attempt to increase the resolution and timeliness of data reaching forecasters, giving them more timely information with which to base warnings. The goal: increase the lead time for tornadoes (which now stands at 13 minutes, up from 6 minutes in the early 70s): "Governments in the Dallas-Fort Worth region are nearing a deal that would make it the first urban area to test a new approach to weather forecasting. Like Twitter’s many ground-level dispatches, the system is based on a series of small radar devices that can be scattered around cities and their suburbs, rather than a large beacon that takes a sweeping but imprecise view. The widespread death and damage inflicted this week by tornadoes throughout the South demonstrated that warnings using current weather technology are limited. Meteorologists and public safety officials said they hoped that the new system could prevent deaths from tornadoes and flash floods. “Because we have a network of radars, it’s like many pairs of eyes,” said V. Chandrasekar, deputy director for research for the Engineering Research Center for Collaborative Adaptive Sensing of the Atmosphere, or CASA."
More On "CASA". Here is more information from CASA, the Engineering Research Center for Collaborative Adapting Sensing of the Atmosphere: "CASA's Challenge: Today's weather forecasting and warning systems utilize data from high-power, long-range radars that have limited ability to observe the lower part of the atmosphere because of the Earth's curvature. This means that meteorological conditions in the lower troposphere are under-sampled, leaving us with precious little predicting and detecting capability where most weather forms. View this short video to learn more about CASA's research challenge. The Solution: DCAS Networks. CASA will overcome the effects of the Earth's curvature and obstructions such as mountains and buildings by deploying low-cost networks of Doppler radars that operate at short range. Installed on existing rooftops and cell towers just a few miles apart, these small radars will communicate with one another and adjust their sensing modes in response to quickly changing weather and user needs - a dramatic change from current technologies. Up-to-the-second radar information will then be transmitted to the people and organizations that make critical decisions about the weather. CASA's new approach is called DCAS, Distributed Collaborative Adaptive Sensing. Distributed refers to the use of large numbers of small radars, appropriately spaced to overcome the Earth-curvature blockage that limits current approaches. The radars operate collaboratively within a dynamic information technology infrastructure, adapting to changing atmospheric conditions in a manner that meets competing end user needs."
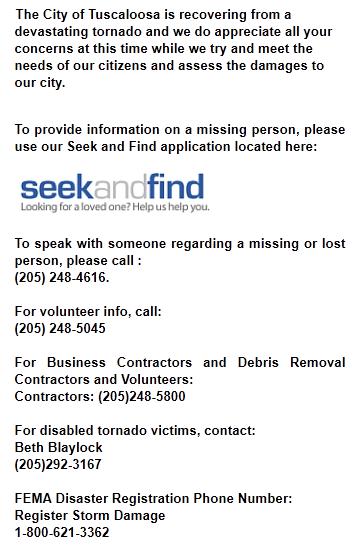
Tuscaloosa Resources. If you have friends/family/colleagues in the Tuscaloosa area this web site has become a clearing-house for information about the dead and missing.
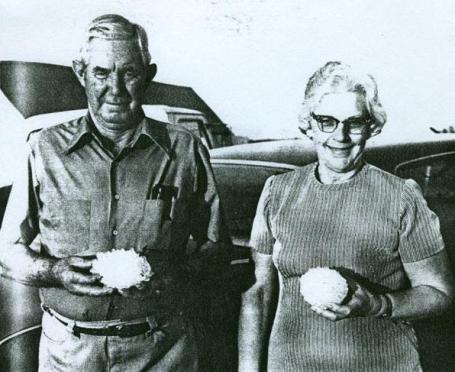
A History of Hail. It's well documented that the USA experiences approximately 90% of the world's tornadoes, and we may also see a vast majority of the planet's hail as well. Dr. Jeff Masters has a good summary of hail in his excellent Wunderblog: Costliest: There have been a handful of hailstorms that resulted in $1 billion or more in damages in the U.S. The costliest storm appears to be that of April 10, 2001 which cut a swath along the I-70 corridor from eastern Kansas to southwestern Illinois and pounded the St. Louis area. Property damage was in excess of $2.4 billion in 2010 dollars. The hailstorm that struck the Dallas/Ft. Worth, Texas metro area on May 5, 1995 also caused an estimated $2 billion in damage (adjusted to current dollars). The only other $1 billion dollar hailstorm on record was that which pummeled the Front Range of Colorado between Colorado Springs and Fort Collins on July 11, 1990 causing $1.6 billion damage in 2010 inflation-adjusted dollars. Deadliest: In spite of the enormous crop and property damage that hailstorms have caused only three people have ever been killed by falling hailstones in the United States: 1) a farmer caught in his field near Lubbock, Texas on May 13, 1930 2) a baby struck by large hail in Fort Collins, Colorado on July 31, 1979, and 3) a boater on Lake Worth, Texas on March 29, 2000."
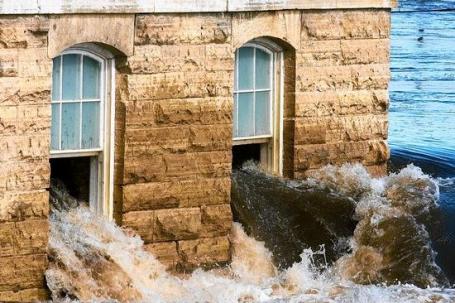
Battling Nature On The River. The Wall Street Journal has an excellent story about the history of river flooding in the United States, how a massive flood on the Ohio and Mississippi Rivers in 1927 changed the way our country battled flooding via construction of levees and "floodways", literally parallel rivers that help to take the stress off main levees. It's a worthy read: "The past week's raging waters along the Mississippi are hardly unprecedented. The great flood of 1927 was far worse—and we still haven't applied its lessons. If recent events in Japan were not enough, the news of the past week has reminded us that nature can make our efforts to control it seem like nothing more than hubris. A historic swath of tornadoes has ripped across the South, and now a potentially major Mississippi River flood is gathering. The tornadoes have done their damage already. The rising waters of the Mississippi are about to test human judgment and engineering anew. As of Friday, Maj. Gen. Michael Walsh of the U.S. Army Corps of Engineers was deciding whether or not to blow up a levee in Birds Point, Mo., and deliberately flood 200 square miles of fertile farm land in order to protect other property. It is a choice between having a controlled flood on a battlefield of his choosing or having the river breach the levee at some as yet unknown weak spot where the flood would be uncontrolled and could wreak havoc. Blowing the levee is not some wild idea drawn up on a napkin; it is one small piece of a carefully thought-out and engineered plan to control the immense forces of the Mississippi. The river drains 31 states and stretches from Olean, N.Y., to the Rockies, from North Carolina to Taos, N.M. On the lower Mississippi—from Cairo, Ill., where the Ohio and Mississippi rivers meet, to the Gulf of Mexico—the floodplain, at its widest, stretches nearly 100 miles across. A great flood can easily fill the entire 35,000-square-mile area with water. The last time the Mississippi did so was in 1927, and the decision that Gen. Walsh now faces results directly from the plans developed to prevent such floods—and from our failures and oversights in implementing them. The 1927 flood came as a surprise to no one. Precipitation over the entire river basin started in August 1926 and continued through the end of the year. In the last three months of 1926, all the gauges on the entire river system—on the Ohio, the Missouri, the Arkansas and the Mississippi itself—had the highest average readings ever recorded. On Christmas Day 1926, both Nashville and Knoxville—which sit on different rivers—flooded. On New Year's Day 1927, the Mississippi broke flood stage at Cairo, Ill. It remained above that level for 153 consecutive days."
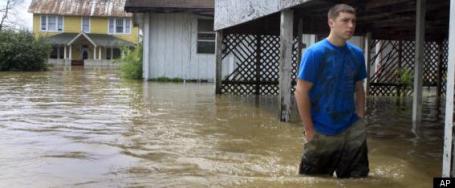
Deep South Braces For Some Of The Worst Mississippi River Flooding Since 1927. An update from Huffington Post: "NEW ORLEANS -- A surge of water not seen since the Great Mississippi Flood of 1927 is forecast in coming days to test the enormous levees lining the Mississippi River on its course through the Deep South, adding another element of danger to a region already raked by deadly tornadoes and thunderstorms. Mississippi's and Louisiana's governors issued flood warnings Thursday and declared states of emergency. Authorities along the swollen waterway in both states are warning nearby residents to brace for the possibility of any flooding. River boat casinos in Mississippi are closing and levee managers are readying sand bags and supplies – and the manpower to build the defenses – to fight the rising river along hundreds of levees in both states where the river crosses en route to the Gulf of Mexico. "We're going to do everything we can to prepare for the worst-case scenario while we still are hoping for the best case," Louisiana Gov. Bobby Jindal said, adding the state was prepared to withstand the test."
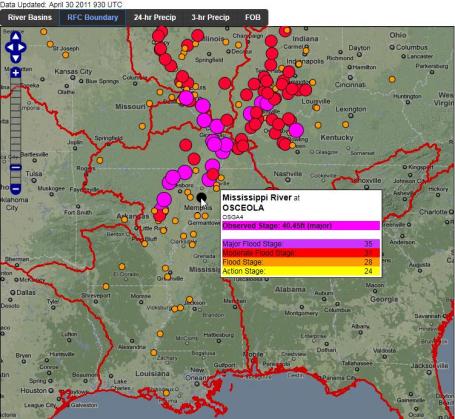
Tracking The Flooding. Click here to see the communities being impacted by some of the worst flood surges on the Mississippi River since 1927.
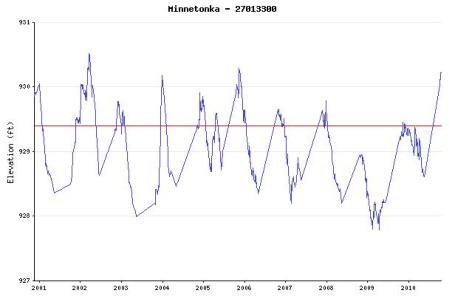
Lake Minnetonka Water Levels. According to the DNR water levels have spiked on 'Tonka, running well above average now.
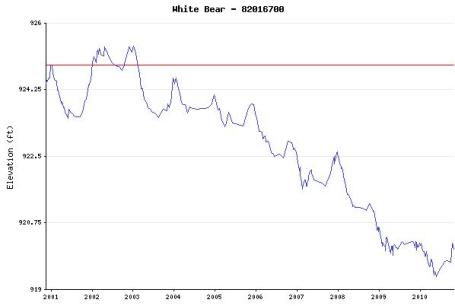
White Bear Lake Water Levels. What a difference. Continuing a trend since 2003, water levels continue to drop on White Bear Lake, north of St. Paul, now lower than they've been any time in the last decade.

16 Tips To Take Your iPhone To The Next Level. Am I biased toward Apple's iPhone? Yes. Guilty as charged. I tried to use an HTC Incredible running Android - it wasn't a bad smartphone, but I was disappointed with the Anroid App Store. It's the wild west - anyone can upload an app, and that means an awful lot of crappy apps out there. Say what you will about Apple's "walled garden" and strict requirements, but at least when you're in iTunes you know you're going to get an app that actually works. Here are some tips from the New York Times on how to get the most from your iPhone: "The iPhone has been around for nearly four years. And in that time, millions of people have bought and used iPhones, swiping and tapping their way through life. Most of those people believe they know how the iPhone works. But dig a little deeper into the iPhone’s latest operating system, iOS 4.3 — available for the iPhone 3GS and the AT&T iPhone 4 — and there’s another layer to master. (Sorry, Android users, but that OS has so many versions and skins that a quick guide would be neither very quick nor much of a guide.) Beyond the realm of those basic iPhone controls is an advanced level of shortcuts and tweaks, some of which even hard-core users may not know exist. DOUBLE-TAP Even while your iPhone is locked, you can access the audio controls by double-tapping on the home button when the lock screen appears. This saves you the time it takes to unlock your phone, open a music-playing app like iPod and get to the volume and track controls. This feature is not limited to Apple’s iPod app. If you are using Pandora, for example, the same technique will bring up its controls."

Camera Whimsey on iPhones. David Pogue always has useful, insightful reviews of (new) tech on Thursdays in the New York Times. Here is his take on the best camera apps for your trusty iPhone: "To save you the four years (and thousands of dollars) it would take you to try out all 6,500 apps, here’s a handy cheat sheet. These are the coolest, best and most useful photo apps for the iPhone, as recommended by my colleagues, my photographer friends and my Twitter followers. These apps are, to use the technical term, wicked cool. CAMERA-APP REPLACEMENTS The iPhone’s camera-taking app is fine. But it’s slow to start up, slow to save a photo, slow to focus. Turning the flash on or off is clumsy, requiring two taps on transparent, hard-to-read buttons. If you replace it with an app like QuickPix ($2), all of those problems go away. The app opens much faster than Apple’s, takes photos much faster and can even snap stills while you’re shooting video. The flash is a single icon that you tap on or off. Put this on your home screen where Apple’s Camera app sits, drag Camera into a folder somewhere, and you’ll miss a lot fewer shots."
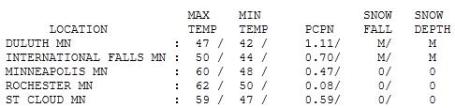

Green Lawns. Just about a half inch of rain fell in the Twin Cities metro Friday night and Saturday morning, .59" at St. Cloud, with over an inch at Duluth and Hibbing.
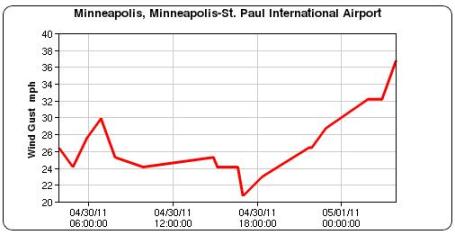
Saturday Winds. Winds steadily increased yesterday in the wake of a cool frontal passage, gusting to 37 mph by late evening. Winds will continue to gust to 25-30 mph. this morning, before gradually easing by late afternoon/evening. MesoWest has more weather plots here.
Paul's Conservation Minnesota Outlook for the Twin Cities and all of Minnesota:
TODAY: More clouds than sun, gusty winds, feels like late March. Winds: NW 20-35. High: near 50
SUNDAY NIGHT: Patchy clouds, winds start to ease up. Low: 33
MONDAY: Mix of clouds and sun, better. High: 57
TUESDAY: Plenty of sun, serious spring fever. Nicest day of the week ? Low: 40. High: 68
WEDNESDAY: More clouds, stray T-storm possible. Low: 47. High: 67
THURSDAY: Sunny start, unsettled with PM showers developing. Low: 48. High: 63
FRIDAY: Some sun, isolated shower or T-shower. Low: 45. High: 62
SATURDAY: Mild sun, probably the nicer day of weekend? Low: 47. High: 66
Super-Sized Weather
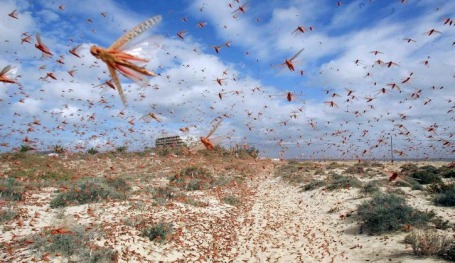
Cue the locust. Seems like we've seen everything but. Grapefruit-size hail in St. Louis, a 100-year flood on the Mississippi, blizzard warnings in North Dakota (on May 1), and, capping an insane week, the 2nd worst loss of life from tornadoes in history on Wednesday (preliminary tornado count: 259).
Is this the "new normal"? How much of this is La Nina, turbocharging the jet stream, keeping the strongest high-level winds farther south, howling over warm, unstable air - or is this a symptom of "global weirding"? Water vapor overhead has spiked 4% in recent decades, which doesn't sound like much, but experts believe this increase in moisture (and low-level warmth and instability) may be increasing the odds of extreme weather.
There was plenty of warning last week, but if an EF-4 is coming and you can't reach an underground shelter, your survival odds are not good. Tornadoes east of the Mississippi tend to hit more heavily populated areas, where many don't have basements.
Expect a cool, brisk (dry) Sunday - more clouds than sun; more like April 1. 60s return most of this week, the best chance of T-storms Wednesday.
Next weekend looks "springy" with 60s and a few spotty thundershowers. Getting better.
Is Climate Change Responsible For Deadly U.S. Tornadoes? I suspect that there are a number of things going on. A lingering La Nina (cooling of Pacific Ocean water) is keeping the jet stream unusually strong (winds in the 100-150 mph. range - more like mid March), and also keeping the core of the jet persistently south, blowing over warm, unstable air over Dixie, a ripe scenario for deadly supercell thunderstorms. But superimposed over this short-term weather phenomenon long-term climate change may be a contributing factor. There's no question that water vapor has increased (about 4% since 1970), providing more potential fuel for floods and other extreme storms, in effect "loading the dice" in favor of more frequent and severe weather events. Here's a story from thestar.com: "While a raft of climate science points to a stormier future involving more frequent and possibly more severe hurricanes, researchers have yet to factor tornadoes into climate-change predictions with any certainty. Theories abound, however, including a 2009 University of Georgia study that suggested climate change could in fact bring about fewer tornadoes in the southeastern United States, which sustained the worst of the Tuesday’s devastation. But Purdue University climatologist Dev Niyogi, one of the co-authors of the Georgia study, cast doubt on even those findings in an interview Wednesday. Niyogi, like many climate experts, described with awe the sheer rarity of complex conditions that made Tuesday’s storm formations unlike anything the region has seen since the 1970s. “The simple answer is we don’t really know whether climate change is going to cause more tornadoes. The jury is still out,” Niyogi told the Toronto Star. “But the good news is the science is maturing. And while the first order of business is to restore the lives of these communities, from the science end, it is highly likely that the data are going to help us understand the cause of these major outbreaks.”April was already on a trajectory toward record tornado touchdowns in the U.S. when Tuesday’s twisters struck on a magnitude to rival April, 1974. That’s when 148 tornadoes tore through 13 states over a 16-hour span, killing 330, injuring 5,484 others and leaving a trail of debris nearly 4,000 kilometres long, according to the National Weather Service."
Climate Change Is Real - To Science And The Public. An editorial from the Baltimore Sun that does a good job summing up my thoughts about pro-business, pro-job ways we can address climate change: "The fight against climate change has "fizzled," according to Jonah Goldberg ("Obama drops climate change talk as green movement fizzles," April 28), under the relentless assault of right-wing lies and distortions that have managed to convince a befuddled public that there is serious doubt about the theory and reality of anthropogenic climate change. Mr. Goldberg might want to spend some time perusing issues of the Economist, a right-of-center European news magazine with a sensible and sober outlook on many global issues — including climate change. For the Economist, anthropogenic global warming is real and it is a serious threat, and the United States needs to be taking more action against it. A February, 2011 Economist article about the debate says that both economists and climatologists ought to be able to agree on a minimum strategy of carbon pricing, elimination of fossil fuel subsidies, and subsidies for basic research but complains that Washington shows little interest in taking even those basic measures."
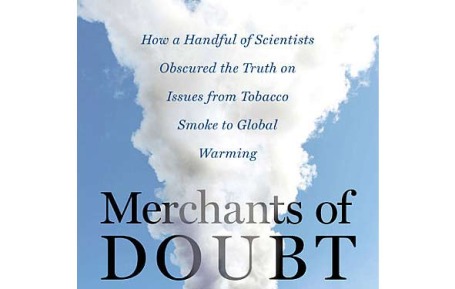
"While the idea of equal time for opposing opinions makes sense in a two-party political system, it does not work for science, because science is not about opinion. It is about evidence. It is about claims that can be, and have been, tested through scientific research - experiments, experience, and observation - research that is then subject to critical review by a jury of scientific peers. Claims that have not gone through that process - or have gone through it and failed - are not scientific, and do not deserve equal time in a scientific debate....A (scientific) conclusion becomes established not when a clever person proposes it, or even a group of people begin to discuss it, but when the jury of peers - the community of researchers - reviews the evidence and concludes that it is sufficient to accept the claim."
- Merchants of Doubt (Naomi Oreskes and Erik Conway, copyright Bloomsbury Press)
Fear Of Climate Change Falling Precipitously. The New American has an update on public opinion. Interest/concern in climate change spiked after Hurricane Katrina - the jury is out whether last week's historic tornado outbreak will increase awareness that our climate is, in fact, changing over time: "The results of a recent survey conducted by the Gallup organization reveal that Americans and Europeans have much more to worry about (statism? crushing national debt?) than climate change. The survey was conducted in 2010 among 1,000 adult citizens of 111 countries. Although the study finds that Americans and Europeans aren’t preoccupied by the threat of climate change, respondents in Latin America and sub-Saharan Africa reported fearing real and personal risks from the effects of global warming. The discrepancy was attributed to the differences in worldview between those living in the so-called developed area of the world and those living in the poorer, “developing” areas. The 42% of adults worldwide who see global warming as a threat to themselves and their families in 2010 hasn't budged in the last few years, but increases and declines evident in some regions reflect the divisions on climate change between the developed and developing world. Majorities in developed countries that are key participants in the global climate debate continue to view global warming as a serious threat, but their concern is more subdued than it was in 2007-2008. In the U.S., a slim majority (53%) currently see it as a serious personal threat, down from 63% in previous years. Not only do Westerners express a statistical disregard for the dangers of climate change, but the number of those who believe there is something to fear from the weather is declining. In France, for example, the poll numbers indicate that the percentage of respondents who consider global warming “a serious threat” has declined from 75 percent to 59 percent since 2007."
No comments:
Post a Comment