94 F.
high yesterday at KMSP (3 degrees higher than predicted - dew points
rose into the low 70s, pooling near the frontal boundary, creating a
late-day heat index near 100). Slightly cooler than Monday's 98 F. high,
but more moisture in the atmosphere made it actually feel worse out
there.
84 F. average high for July 17.
93 F. high on July 17, 2011.
22 days at or above 90 F. so far in 2012 in the Twin Cities.
Today: coolest day in sight (80s) with a slight chance of a shower or T-storm.
3rd worst drought since 1895. Source: NOAA.
55% of USA currently in moderate drought (or worse); largest percentage since December, 1956. NCDC.
170 all-time record highs across the USA in June. Source: NOAA NCDC.
10:1. Ten times more record highs than record lows, nationwide, since January 1. NCDC.
June, 2012: 4th warmest on record, worldwide, since 1880 according to NOAA. Details below.
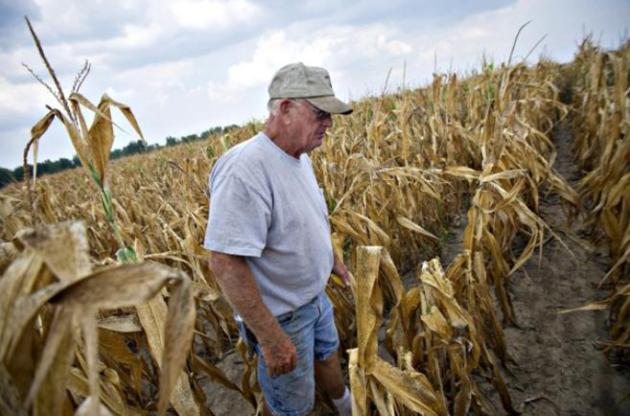
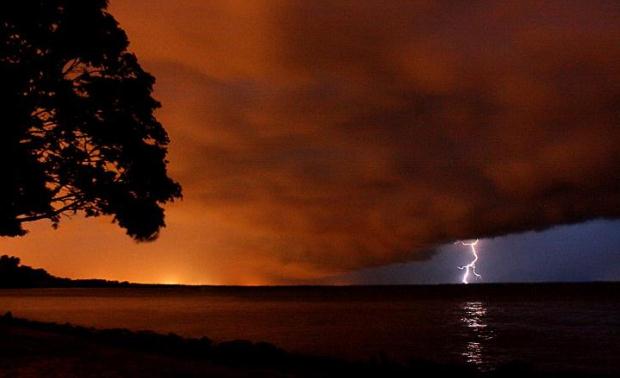
Photo credit above: "
Four rows of corn left for insurance
adjusters to examine are all that remain of a 40-acre cornfield in
Geff, Ill. that was mowed down Monday, July 16, 2012. Over ten days of
triple digit temperatures with little rain in the past two months is
forcing many farmers to call 2012 a total loss." (AP Photo/Robert Ray)
Temporarily "Locked" Upper Level Wind Pattern. What
is unusual about our (historic) summer pattern is how stuck it's been,
ever since late June. It's not unusual for weather systems to
temporarily stall, but for the better part of 6 weeks an incredibly
persistent high pressure bubble aloft has hovered over the Plains,
pushing waves of 90 and 100 degree heat unusually far north and east -
the main storm track shoved 500-800 miles farther north than usual. The
core of the jet has been blowing across central Canada, whisking the
most prolific storms (and cool frontal passages) well north of the USA.
This heat-pump high centered over Kansas/Missouri is forecast to finally
break down the latter half of next week, allowing somewhat cooler air
to penetrate into the USA, increasing the chance of more widespread
T-storms.
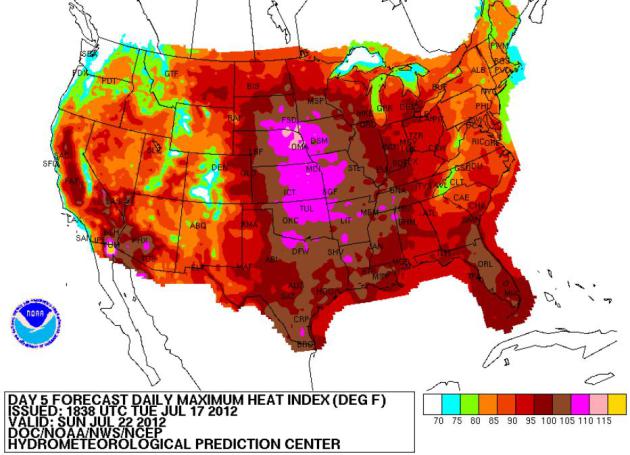
From Bake To Broil. It's hard to imagine the heat
and drought getting worse, but that's exactly what's going to happen as a
heat-pump high pressure bubble stalls over the Central Plains this
weekend. NOAA's
Heat Index Prediction Product is forecasting Sunday heat indices to reach 115 near Omaha and Sioux Falls, as high as 105 F. in the Twin Cities and Madison.
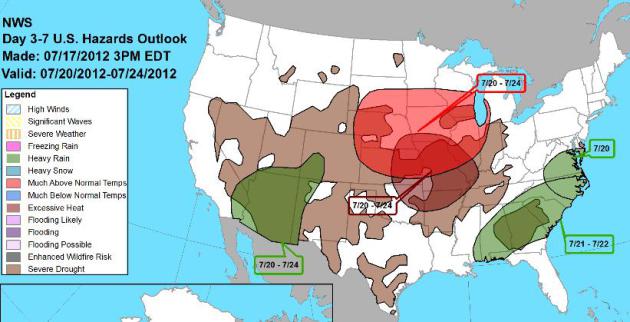
Dangerous Levels Of Heat. Here is NOAA's
3-7 Day Hazards Outlook, showing "much above normal temperatures" pushing into southern and central Minnesota from Friday into next Tuesday.
"
Between 1993 and 2005, with summers growing hotter and homes
larger, energy consumed by residential air conditioning in the U.S.
doubled, and it leaped another 20 percent by 2010. The
climate impact of air conditioning our buildings and vehicles is now
that of almost half a billion metric tons of carbon dioxide per year." - from an article at The Guardian; details below.
"
What's more, high temperatures can exacerbate other chronic
diseases which can lead to a person's early death. High-risk people
including the elderly, very young or people with respiratory, heart,
kidney and other chronic diseases are more likely to get dehydrated and
require emergency hospitalization during a heat wave." - from a CBS News article; details below.
“
There are going to be more heat waves and, in my opinion, they
will be more severe,” Pollack said during a press conference on the
Lewis and Clark Landing. “Human-caused global warming has been
worsening this large-scale weather pattern by pushing southern weather
systems northward.” - meteorologist John Pollack, from an article at Omaha.com; details below.
"
This hurricane season, NOAA is using a new computer model to
help predict the start of what is known as the "eyewall replacement
cycle," a key indicator that a storm's strength and size is about to
change. The new tool will help NOAA forecasters provide valuable
information to emergency managers about an evolving hurricane." -
excerpt from an article about a new model being tapped to provide better
information about hurricane intensify from WCIV-TV; details below.
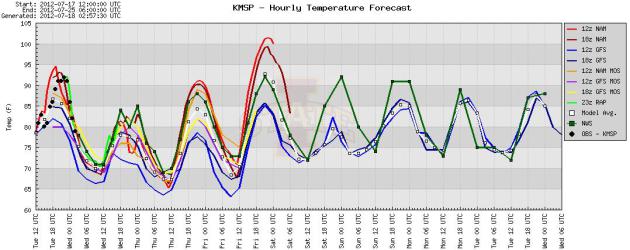
A One-Day Reprieve. Today will be the coolest day in
sight, certainly for the next week or so. Yes, this year mid-80s became
a "cool front". A couple of NAM model runs are suggesting upper 90s
Friday; 100 F. not out of the question over parts of southern Minnesota.
I know it doesn't sound terribly scientific - but the models have
consistently underestimated the heat this summer. It's almost like the
models can't keep up with the levels of heat we're witnessing; there's
an extra, missing ingredient that's turbocharging temperatures,
nationwide. Are greenhouse gases amping up the heat? Possibly. Something
is enhancing the heat levels well beyond what the models are expecting.
I know it sounds crazy, but how else to sum up this summer? Expanding
drought and historic heat, punctuated by an occasional 1-in-100 year
flood. Just ask residents of Houston, Texas. Weather on steroids?
More like weather on amphetamines.
Tuesday Highs:
Milwaukee and Madison, WI----- 100 degrees
Detroit----- tied at 101 degrees
(third time this year the temp has hit or exceeded 100 degrees…. which
is the third most number of days ever in a calendar year)
Flint, MI—101 degrees (tied former record)
Grand Rapids, MI---- 99 degrees
Dayton, OH—99 degrees
Cleveland--- 96 degrees (tied for a record)
Atlantic City, NJ—98 degrees
Newark, NJ--- 100 degrees (tied)
Rochester, NY -- 97 (old record 95 in 1900)
Syracuse, NY -- 101 (former record was 94 in 1999)
* thanks to Chad Merrill from WeatherBug for passing these numbers along.
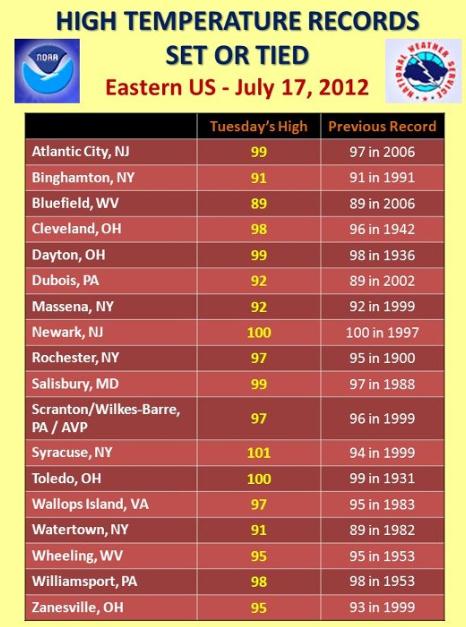 More Tuesday Records
. Data courtesy of NOAA.
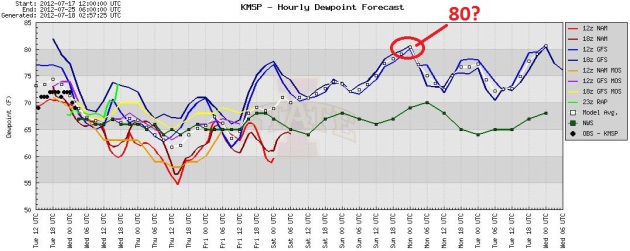
Dew Point Trends. After dipping into the 60s today,
the dew point is forecast to rise above 70 F. by Friday, a few of the
GFS model runs hinting at a (ghastly) dew point near 80 F. by Sunday
afternoon. I hope the models are wrong - if they do verify (along with
highs in the 90s) it could mean a heat index as high as 110 by Sunday
and Monday. We may see 1 or 2 more days of 100-degree heat in the coming
days (best chance Friday, again Monday of next week), but I'm even more
concerned about the combination of heat and humidity. Excessive heat
indices may be the big weather story for Minnesota by early next week.
Graph: Iowa State Meteorology Department.
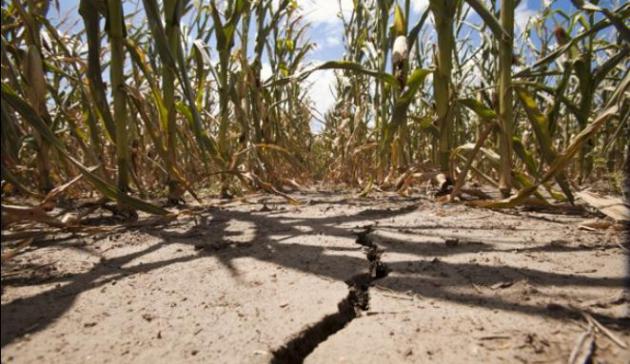
Drought In U.S. Reaching Levels Not Seen In 50 Years, Pushing Up Corn Prices.
The Washington Post has a comprehensive story on the expanding, intensifying drought - here's an excerpt: "
A drought gripping the Corn Belt and more than half the United States has reached proportions not seen in more than 50 years,
the government reported Monday, jacking up crop prices and threatening
to drive up the cost of food. Though agriculture is a small part of the
U.S. economy, the shortfall comes as the nation struggles to regain its economic footing.
Last week, the Agriculture Department declared more than 1,000 counties
in 26 states as natural-disaster areas. About 55 percent of the
continental United States is now designated as in moderate drought or
worse, the largest percentage since December 1956, according to the
National Climatic Data Center, and the outlook is grim."
Photo credit above: Washington Post. "The drought of 2012: Effects of the drought are growing.
Here is a look at the drought and at effects that may cost the U.S. economy $50 billion."
AP Photos: Scenes From The Worst Drought In Decades That's Gripping More Than Half The U.S. Here's more information and a slide show highlighting the impacts of severe drought, from AP and
The Washington Post: "
Crops
wither. Topsoil lies cracked and parched. Reservoirs shrink, leaving
dry beds exposed to the sun. More than half of the continental United
States is in some stage of drought, while most of the rest of the
nation endures abnormally dry conditions....The percentage of affected
land rivals even some years of the Dust Bowl era of the 1930s, though
experts point out that this year’s weather has been milder than that
period, and farming practices have vastly improved."
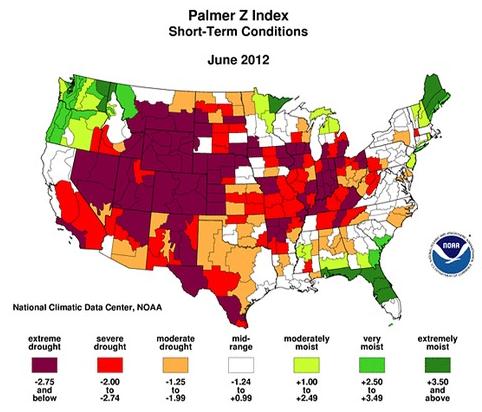
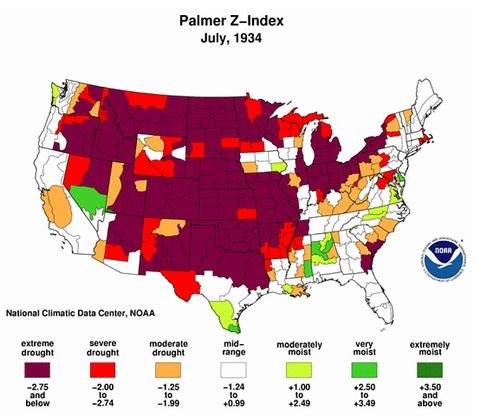 Measuring Significant Drought Years
.
PBS is doing a great job reporting on the intensifying drought,
specifically the PBS Newshour (6 pm on Channel 2, KTCA-TV). Here's an
excerpt of a recent
drought overview: "
More
than half of the continental United States was in moderate to
extreme drought in June -- including corn- and soybean-producing states
-- damaging crops and impacting prices at the grocery store. Some say if
the hot, dry weather continues, this year's drought could rival the
"dust bowl" years of the 1930s: "It's a critical time of pollination for
corn, and the dryness is
impacting yield," said Brian Fuchs, climatologist with the National
Drought Mitigation Center at the University of Nebraska in Lincoln.
"Soybeans come a little later, but with the dryness and heat, it's still
stunting growth." Overall, commodities markets are responding in
anticipation of a
reduced harvest and in turn, any users of the products in their raw form
are seeing prices increase, he said. Joe Glauber, chief economist at
the U.S. Department of Agriculture,
said poor people who spend more of their income on food are impacted the
most."
Graphic credit above: "
Source of maps: National Oceanic and Atmospheric Administration.
The Palmer index, developed in 1965 by W.C. Palmer, compares the amount
of precipitation in an area to the average amount expected."
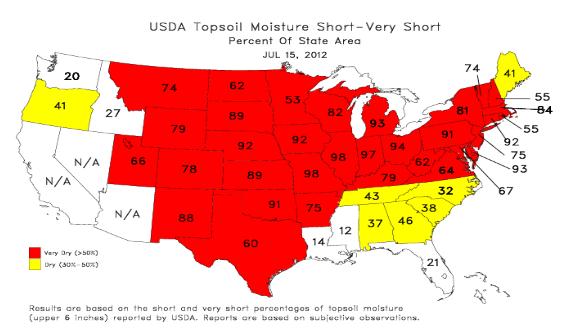 Topsoil Moisture Monitoring
.
NOAA CPC
released a map showing the percentage of every state in the USA that is
short on topsoil moisture: 53% in Minnesota, 82% in Wisconsin, 92% Iowa
and 98% across Illinois and Missouri, where drought conditions are much
worse.
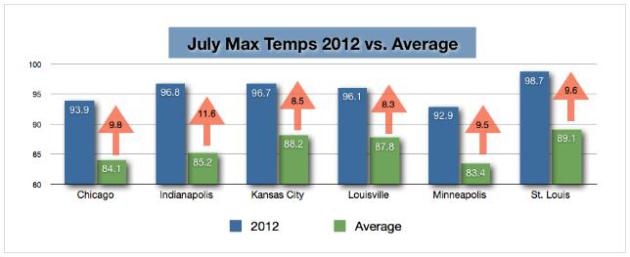
July Maximum Temperatures (Vs. Average). Thanks to
WeatherNation TV
Executive Producer Lori Ryan for doing these calculations. Here are the
average max temps for July 2012 so far this year compared to 1981-2010
historical averages.
Twin Cities –
92.9 (2012) 83.4 (average)
Chicago-
93.9 (2012) 84.1 (avg)
Philadelphia –
92.4 (2012) 87.1 (avg)
Indianapolis 96.8 (2012) 85.2 (avg) highest difference I found. more than 10 degrees
St. Louis
98.7 (2012) 89.1 (average)
Baltimore
94.1 (2012) 87.8 (average)
Washington Reagan Airport
95.1 (2012) 88.5 (avg)
Louisville, KY 96.1 (2012)
87.8 (avg)
Kansas City 96.7 (2012)
88.2 (avg)
Denver 92.8 (2012)
88.2 (avg)
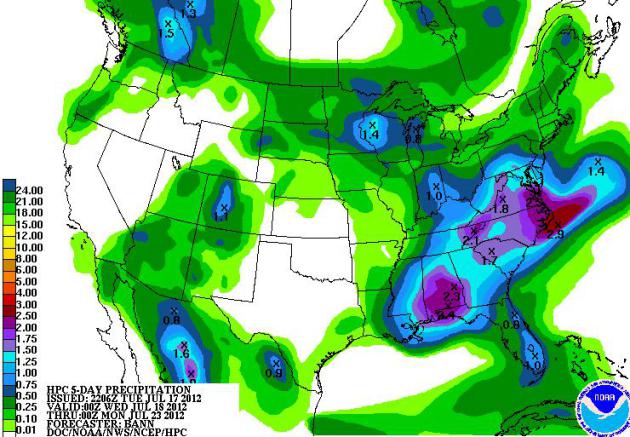
Drought Deepens Across Central Plains. Slight relief
from the worst of the drought is possible over portions of the corn
belt in the Ohio River Valley, but little or no rain is likely over the
central and southern Plains, where drought will worsen in the coming 1-2
weeks. 5-Day Rainfall Outlook courtesy of NOAA HPC.
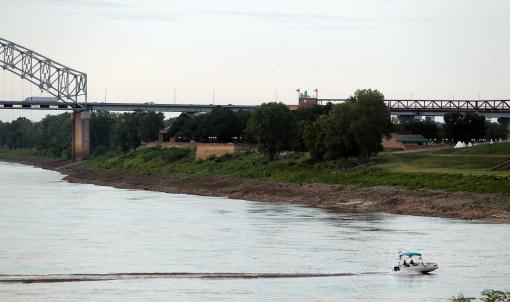
A Year After Floods Shippers Face Low Mississippi River. Here's an excerpt of a story on how the drought is impacting barge traffic on the Mississippi River from
The Daily Reporter and AP: "
MEMPHIS,
Tenn. (AP) -- A year after the Mississippi River swelled to
near-historic proportions and flooded farms and homes from Illinois to
Louisiana, the level along the waterway's southern half is so low that
cargo barges have run aground and their operators have been forced to
lighten their loads. Wide, sandy strips of shoreline usually invisible
even in the low season are now exposed, shrinking the river's width
and affecting the way tow captains navigate. Such is life along the
nation's main inland waterway, where millions of tons of goods are
shipped every year, some of which end up as exports departing from
south Louisiana ports. Those who make their living along the
Mississippi learn to adapt to the river's fickle nature. "It's
remarkable, but it's completely normal," said Jim Pogue, spokesman for
the Army Corps of Engineers in Memphis. "You get a low river, you get a
high river, but it's completely normal." There isn't much man can do
to deal with the exceptionally low river, which at Memphis, is just
about 6 feet above the record low."
Photo credit above: "
In this July 14, 2012, photo, boaters
make their way towards Mud Island along the exposed banks of the
Mississippi River, in Memphis, Tenn. A year after nearly record floods,
the Mississippi River level has dropped so low that it's beginning to
affect commercial operations. Port managers worry that their passages
to the river could fill up with silt, and barge operators may have to
lighten their loads." (AP Photo/Nikki Boertman)
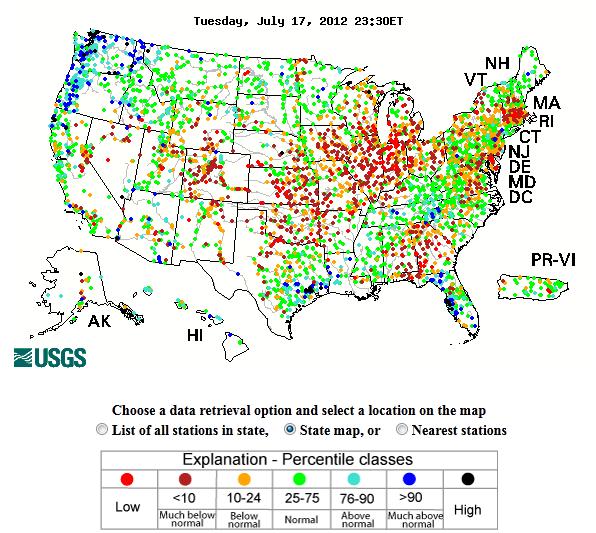
National Streamflow Update. Streams and rivers
across much of the Midwest and Ohio Valley, southwest into the Central
Plains, are in the 10 percentile, meaning historically low water levels.
Map above:
USGS.
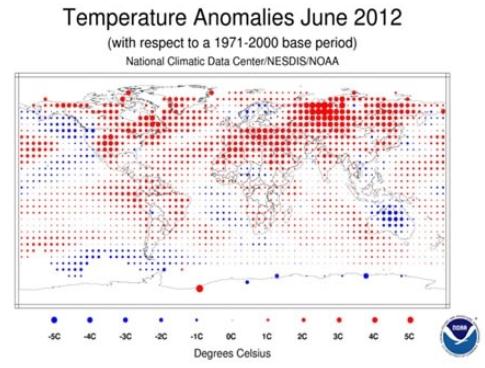
Extreme Weather 2012: Last Month Was The 4th Warmest June On Record.
As tempting as it is to look out the window and make generalizations,
it's critical to keep a global perspective (which is easier said than
done, I grant you). More statistics on what's happening worldwide in
this article from
Huffington Post; here's an excerpt: "
The
planetary warm spell continued through June; last month ranked as the
fourth warmest June since record keeping began in 1880, according to
the U.S. National Oceanographic and Atmospheric Administration. Much of
the world saw higher-than-average temperatures for June, particularly the lower 48 states,
where last month brought the warmest 12-month period since the late
19th century. In addition to most of North America, Eurasia and northern
Africa also saw much higher-than-average monthly temperatures,
according to NOAA. Only Australia, northern and western Europe, and the
northwestern United States were notably cooler than average, NOAA
reported. (In the United States, this year's heat wave has been
confined to the eastern two-thirds of the country.) Christchurch, New
Zealand, where it is winter, had its coolest daily maximum temperatures
in more than 130 years of national record-keeping."
Graphic above: NOAA June temperature anomalies. "
Global
temperatures in June ranked 4th warmest on record (over 133 years).
Red dots indicate areas warmer than normal. Blue dots indicate areas
cooler than normal. (NOAA)". Source: meteorologist Jason Samenow, who has more on June's historic warmth at The Washington Post.
Electric Fan's Effectiveness During Heat Waves Questioned In New Report. Are we just blowing hot air around? Some interesting facts in this story from
CBS News: "
In
a young summer that's already had record-setting heat waves, countless
Americans are desperate for ways to stay cool. For those who don't
have air conditioning, an electric fan propped in front of the window
is a tried and true method to cool off - or so once thought. Now, new
research calls into question the effectiveness of electric fans during
especially high temperatures. Ten tips to keep your dog safe from summer heat
Researchers from the Cochrane Collaboration, a nonprofit medical
research group, reviewed international studies in search of evidence
that could guide policy decisions on fan use and heat safety."
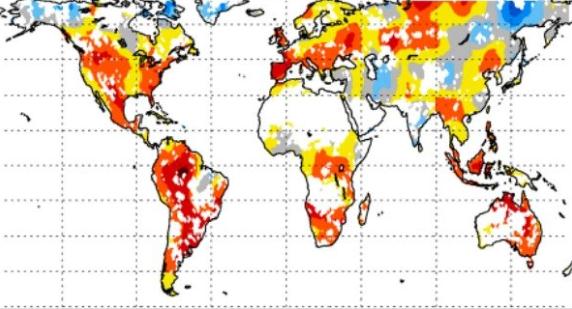
Dry Spells May Predict Heat Waves. As meteorologists
attempt to connect the dots and determine why some droughts go on to
become historic record-breakers (while others quickly fizzle) here is an
excerpt of an eye-opening story from Science Now and
The Los Angeles Times: "
Low
rainfall and parched soil are likely indicators of an impending heat
wave, especially in the Great Plains of the United States, according to
a recent climate study. In a report published online Monday in the
science journal PNAS, researchers reported a correlation between
stretches of dry weather and an increased number of hot days during the
warmest month of the year. The connection, which varies between
continents, could one day help forecasters predict withering heat
spells. Dry soil reduces evaporative cooling and transmits heat to the
atmosphere more readily than moist earth."
Graphic credit above: "
Red and orange indicate areas of the world where dry soil conditions are more likely to precede heat waves."
(PNAS / July 16, 2012)
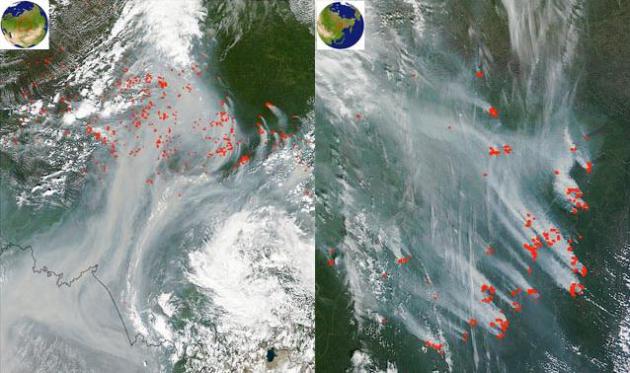
Russian Wildfire Smoke Reaches Canada, USA.
If you notice more haze and smoke in the sky over your house in the
coming weeks, there's a good reason, as explained in this excerpt of an
article from Democratic Underground and Weather Underground: "
The
U.S. isn't the only country suffering from a severe wildfire season.
Russian firefighters have been battling huge blazes in Siberia for
months. Central Russia experienced record warm temperatures 11 - 12°F (6
- 7°C) above average during June, feeding fires that have burned more
area in 2012 than in 2010--the year of the unprecedented heat wave that
killed over 55,000 people. Smoke from this summer's Russian fires rose
high into the atmosphere last week, and got caught in the jet stream.
As University of Washington professor Dr. Cliff Mass explained in this
blog, the strong winds of the jet stream carried the smoke to western
North America this week, where sinking air associated with a strong
area of high pressure brought the smoke to the surface. "
Images above courtesy of NASA.
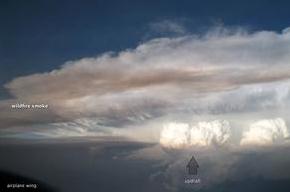
When Wildfire Smoke And Thunderstorms Collide.
KATC.com has the story; here's an excerpt: "
Scientists
on NASA's DC-8, a flying laboratory, have concluded a six-week hunt for
thunderstorms. They were part of a team of 100 researchers from 29
organizations who participated in Deep Convective Clouds and Chemistry
(DC3), a field campaign based in Kansas that conducted numerous
research flights to Alabama, Colorado, and Oklahoma as part of a
campaign to understand how storms affect the chemistry of the upper
troposphere. The preferred target: large multicell and supercell storms
with powerful updrafts capable of lofting volatile pollutants and
moisture-rich air nearly 40,000 feet (12,000 meters) up in the
atmosphere, a height that pollutants don't normally reach without a
boost from a storm."
Photo credit above: "
Photograph courtesy of the DC3 team
and NASA Langley Research Center's James Crawford. Caption by Adam
Voiland with information from James Crawford."
"Dark Clouds On The Horizon For NASA And NOAA". This certainly isn't good news; here's a clip from a story at
tallahasse.com: "
Several
years ago, when a senior government official was testifying before
Congress in defense of weather satellite budgets, he was stunned to be
asked by a member, “Why are we building meteorological satellites when
we have the Weather Channel?”Those of us in the aerospace industry know
the short answer: Without the National Oceanic and Atmospheric
Administration, there would be no Weather Channel. The satellite
imagery and data utilized by the Weather Channel and countless other
reporting and predicting outlets are generated by satellites operated
by NOAA and developed by industry under the auspices of the National
Aeronautics and Space Administration." (Image above: NASA).
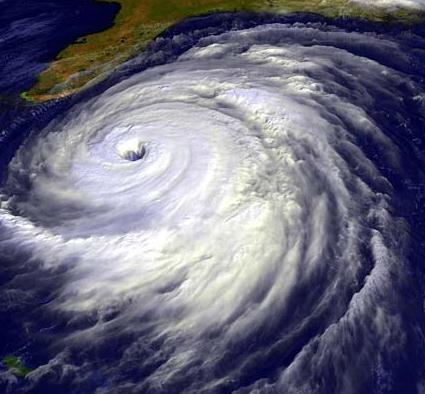
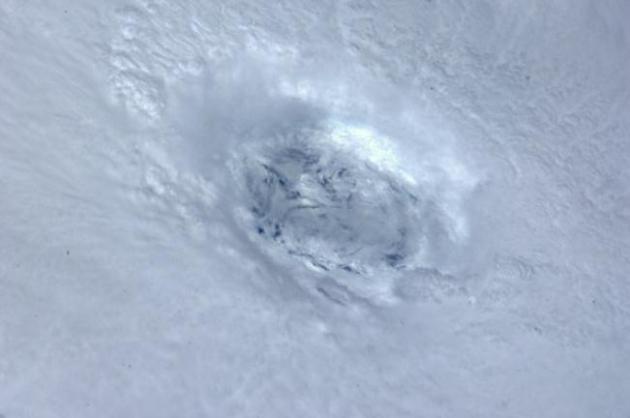
New Model Used To Keep A Better "Eye" On Storms. Here's an interesting article from
ABC News4 in Charleston: "
Forecasting
hurricanes is difficult, especially with respect to the intensity of a
storm. Enormous strides have been made in forecasting the eventual
path of tropical systems, but still to this day it remains difficult to
predict how strong a storm will get. This hurricane season, NOAA is
using a new computer model to help predict the start of what is known
as the "eyewall replacement cycle," a key indicator that a storm's
strength and size is about to change. The new tool will help NOAA
forecasters provide valuable information to emergency managers about an
evolving hurricane." (high res imagey from Hurricane Katia courtesy of NASA).
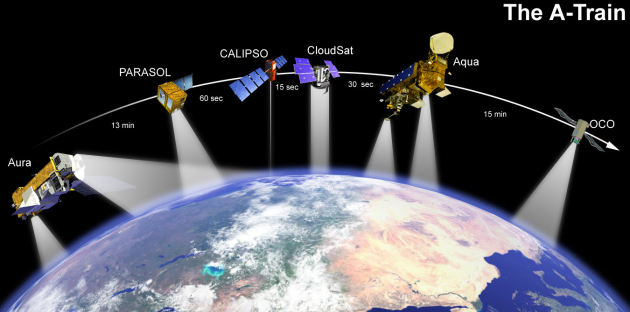
Satellite Thermometers Helping Science. Surface data
is essential, but scientists would be truly lost without the
constellation of low-orbiting satellites that collect far more than
imagery. Here's an excerpt of a story at
redorbit.com: "
There
are satellites for nearly everything out in orbit now-a-days,
including some that are meant just to provide measurements of the
surface temperature of oceans and seas. These thermometers in the sky
led to the meeting of scientists to review data from new satellite
missions and scientific progress in the field. The European Space Agency
said that measuring the sea-surface temperature (SST) across regional
and global scales is important for improving weather and ocean
forecasting and climate change research. ESA’s Medspiration project
merges SST maps using data from infrared and passive microwave
satellite instruments to map SST dynamics in the Mediterranean. The
website uses Medspiration SST maps in its near-realtime service for
scientists as well."
Photo credit above: "
Rade Kovac / Shutterstock"
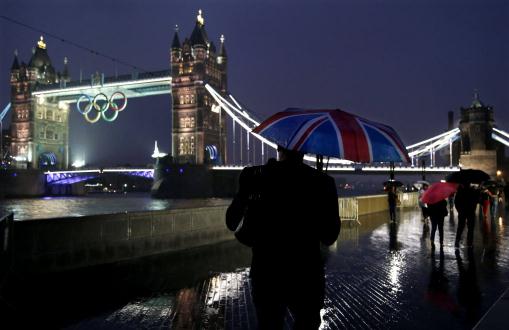
Weather Warning: London Olympics' Biggest Threat?
No, the weather in London doesn't seem to be improving much - one of the
wettest summers in history for much of the U.K. with serious flooding
in Wales.
CNN.com has an update: "
London
has spent billions preparing to host the 2012 Olympics, constructing
state of the art stadiums, overhauling transport links and installing
anti-aircraft missiles to beef up security. But there is one thing
organizers can't control: The Great British Weather. Recently two
titanic events of the sporting summer -- tennis at Wimbledon and
Formula One's British Grand Prix -- have been hit by violent storms and
the persistent rain that has been stalking the UK for months. Only
this week a major concert in London was canceled after a series of
severe deluges rendered Hyde Park unsafe for the thousands of fans who
bought tickets. With just 15 days to go until the opening ceremony and
forecasters predicting more turbulence ahead, Olympic officials and
their government partners are making contingency plans for those events
that could be decimated by adverse weather."
Photo credit above: "
Pedestrians walk in the rain past the
Tower Bridge displaying the Olympic rings Saturday, July 14, 2012 as
London prepares for the 2012 Summer Olympics."" (AP Photo/Jae C. Hong)
Viewers Tuning To YouTube For News. It's a growing
trend. Major media companies are making some of their stories and videos
available to YouTube, but many people, especially young viewers, are
automatically turning to the web to get their information - going
directly to videos they find interesting or newsworthy. More details
from
tvnewscheck.com: "
A
new study has found that YouTube is emerging as a major platform for
news, one to which viewers increasingly turn for eyewitness videos in
times of major events and natural disasters. The Pew Research Center's
Project for Excellence in Journalism on Monday released their
examination of 15 months of the most popular news videos on the Google
Inc.-owned site. It found that while viewership for TV news still
easily outpaces those consuming news on YouTube, the video-sharing
site is a growing digital environment where professional journalism
mingles with citizen content."
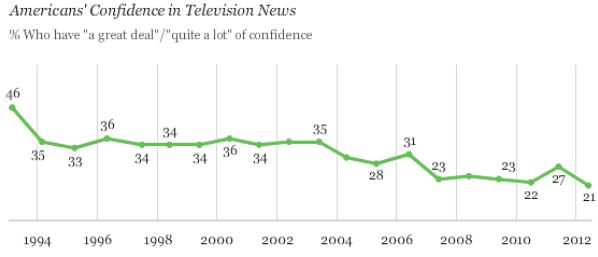
Confidence In TV News At An All-Time Low.
Politico.com has the story; here's an excerpt: "
Americans' confidence in television news has hit an all-time low, according to a new survey by
Gallup. Twenty-one percent of the 1,004 adults polled said they had "a
great deal" or "a lot" of confidence in television news media,
continuing a steady decline from the 46 percent who expressed
confidence in television media in 1993. Meanwhile, just 25 percent of
those polled expressed confidence in newspapers, the second-lowest
rating since 1973 and less than half of the 51-percent peak in 1979. Of
16 U.S. institutions tested -- including the police, the church, the
Supreme Court, banks, and big business -- newspapers ranked tenth,
television news eleventh. (The military is the most trusted institution,
with a 75 percent confidence rating; Congress is the least trusted
institution, with a 13 percent confidence rating)."
Graphic credit above: Gallup and politico.com.
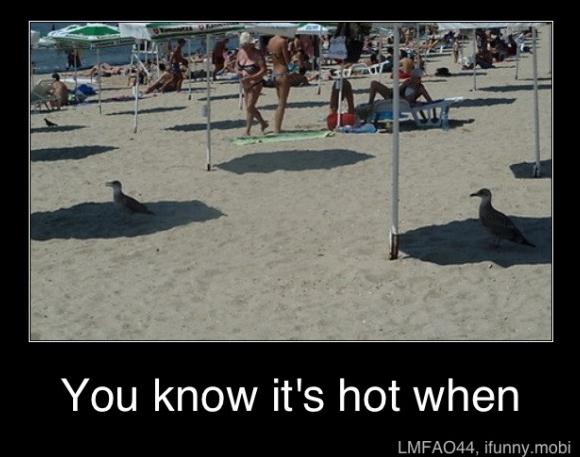
You Know It's Hot When...thanks to ifunny.mobi for sending this one along.
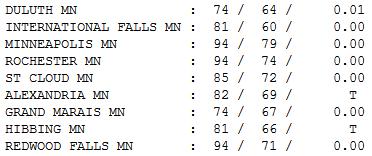
Hotter Than Expected. In spite of a weak wind shift
to the east/northeast, there was enough lingering warmth in the lowest
few thousand feet of the atmosphere and enough sunshine for low to mid
90s over southern Minnesota. It was quite a front: 74-degree highs at
Grand Marais and Duluth, 85 at St. Cloud, but a baking 94-degree high in
the Twin Cities, Redwood Falls and Rochester.
Paul's Conservation Minnesota Outlook for the Twin Cities and all of Minnesota:
TODAY: Coolest day in sight. Showers & T-storms. Dew point: 65. Winds: East 10. High: 86
WEDNESDAY NIGHT: Lingering T-storms possible. Low: 68
THURSDAY: Drier, sunnier, hotter. Dew point: 64. High: 92
FRIDAY: Sizzling sun. Dew point: 67. Low: 72. High: 98
SATURDAY: Sticky and hot with hazy sun; T-storm north? Dew point: 70. Low: 74. High: 95
SUNDAY: Early storm possible, then hazy sun. Low: 75. High: 96
MONDAY: Another 2-shower day. Sauna-like heat & humidity. Low: 74. High: 96
TUESDAY: Muggy, few T-storms possible. Low: 73. High: 94
* long range models are hinting at a more significant dip in temperature and humidity Wednesday and Thursday of next week.
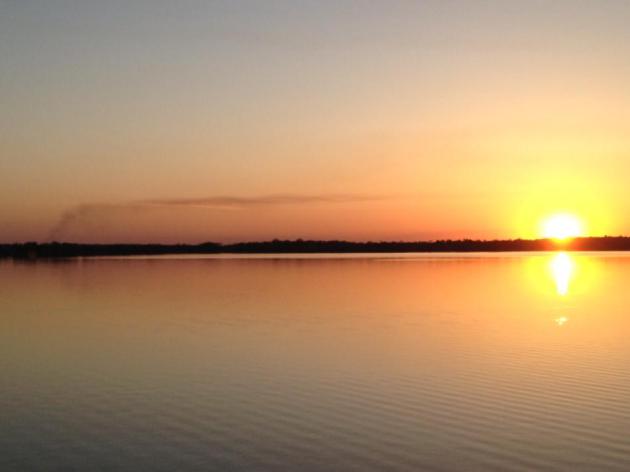
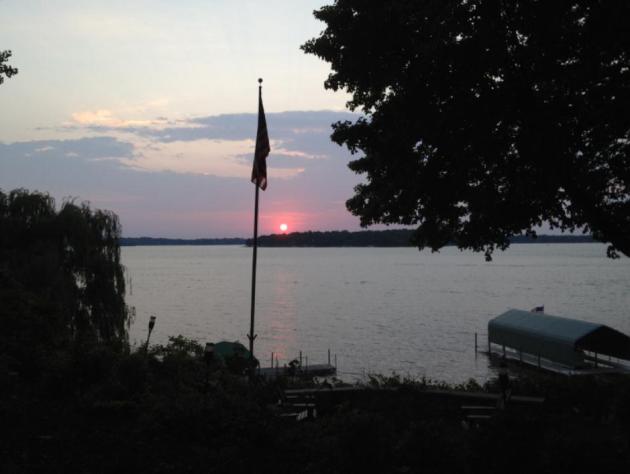
Sweet (Fleeting) Relief
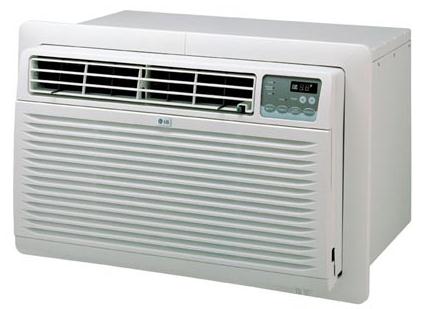
My wife isn't happy. Our air conditioner is
still busted. We hope to build a small home someday, powered by
geothermal, so we plan to tough it out. Dumb, I know.
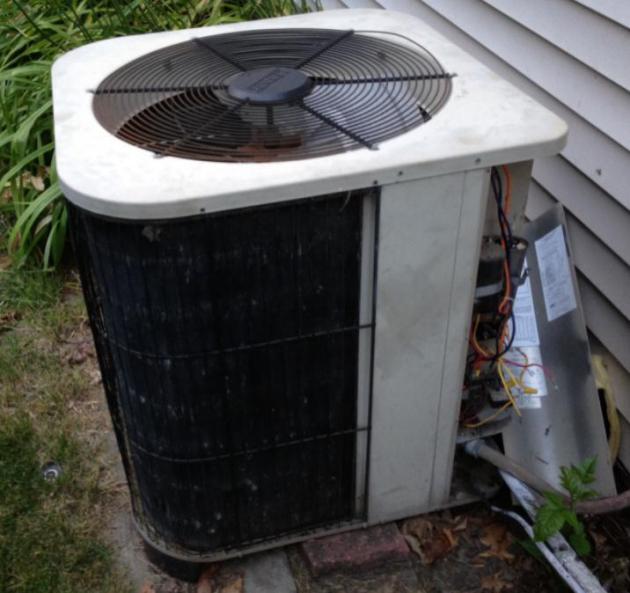
Which got me thinking about the pleasures and perils of A/C.
"Between 1993 and 2005, with summers growing
hotter and homes larger, energy consumed by residential air conditioning
in the U.S. doubled, and it leaped another 20 percent by 2010. The
climate impact of air conditioning our buildings and vehicles is now
that of almost half a billion metric tons of carbon dioxide per year"
reports The Guardian.
It's ironic: we're inadvertently heating up the
sky; our ever-growing need for A/C requires more polluting fossil fuels
to keep our homes cool. Which makes it warmer - which increases the need
for more air conditioning. A vicious cycle.
The worst drought since 1956 shows no sign of
easing anytime soon. Today will be the most comfortable day in sight;
80s with a few T-storms. Just enough rain to settle the dust.
Farms & gardens need 1 inch of water every
week, but a bloated heat bubble has pushed the main storm track into
Canada, leaving us hot and (mostly) dry.
Highs top 90 every day from tomorrow thru the
middle of next week; the new NAM model hints at upper 90s Friday. I'm
expecting at least one more week of debilitating heat across Minnesota,
from tomorrow into Wednesday of next week, followed by some relief the
end of next week as the core of the jet stream dips farther south,
allowing cooler, Canadian air to (finally) penetrate south of the
border. At the rate we're going I expect at least another 15 days above
90. That would bring our grand total up to 37, the most 90-degree days
since 1988.
Deep sigh. Excuse me while I stick my big head in the freezer.
Again.
Climate Stories....
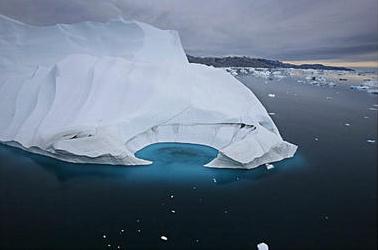
As Predicted, Massive Iceberg Breaks Off From Greenland.
Sea levels off the coast of New England are rising 3 times faster than
the global average. I tell a few of my friends considering a beachfront
home in New Jersey to buy a nice home a few blocks inland...and be
patient. Here's another piece of the global climate puzzle, as reported
by Our Amazing Planet and
The Christian Science Monitor: "
A massive iceberg larger than Manhattan has broken away from the floating end of a Greenland
glacier this week, an event scientists predicted last autumn. The giant
ice island is 46 square miles (120 square kilometers), and separated
from the terminus of the Petermann Glacier,
one of Greenland's largest. The Petermann Glacier last birthed — or
"calved" — a massive iceberg two years ago, in August 2010. The iceberg
that broke off and floated away was nearly four times the size of Manhattan, and one of the largest ever recorded in Greenland."
Photo credit above: "
In this 2007 photo, an iceberg is seen melting off the coast of Ammasalik, Greenland." John McConnico/AP/File
The Climate Post: As Country Breaks Heat Record, Studies Analyze Climate Connection.
More evidence that a warmer atmosphere is creating a riper environment
for extreme heat, drought (and downpours) in this article from
Huffington Post; here's an excerpt: "
The same week the continental United States broke its record for the hottest six months in a calendar year, the United Nations announced 2011 was among the 15 warmest so far. Climate change may have increased the chances of the types of extreme weather seen in 2011, and may have been heavily influenced by a weather pattern called La Niña. The odds of such record U.S. heat being a random coincidence -- while not 1 in 1,594,323, as the National Oceanic and Atmospheric Administration's National Climatic Data Center said in a new report -- are perhaps on the order of 1 in 100,000. One NOAA scientist claims there is an 80 percent chance the record heat can be attributed to climate change. Meanwhile, Meteorologist David Epstein called the extremes "simply a reality of nature."
"Smoking Causes Cancer; Carbon Pollution Causes Extreme Weather".
The headline may be a bit oversimplified, but greenhouse gases are
triggering a global warming trend, which - in turn - is creating an
environment in which extreme weather events can take place with
increasing frequency and intensity. Here's an excerpt from
Huffington Post:
"Smoking causes cancer. Carbon pollution causes extreme weather."
"
It really doesn’t have to be more complicated than that. We dump
billions of tons of carbon pollution into the atmosphere each year. As
a result, the concentration of carbon dioxide has increased by 40
percent. Excess carbon dioxide traps excess heat in the atmosphere.
Excess heat causes extreme heat waves, droughts and storms. And that’s
what we have been seeing. In June alone, 170 all-time high temperature
records were broken or tied in the United States, and more than 24,000 daily high temperature records
have been broke so far this year. If the climate weren’t changing, we
would expect to see about the same number of record highs and record
lows set each year due to random fluctuations. That’s what we were
seeing 50 years ago, but during the last decade there were twice as many
record highs as record lows. So far this year the ratio has been 10 to
1."
Photo credit above: Brad Birkholz.
Meteorologist: Heat Wave Shows Global Warming Is Real. Here's another article I found interesting, an excerpt from a post at
omaha.com: "
Omaha
meteorologist John Pollack said Monday that he believes the heat wave
gripping Nebraska, Iowa and much of the nation is a message from planet
Earth that global warming is real. “The Earth is saying that we can
lurch from one climate to another year after year or we can commit to
stopping global warming,” Pollack said. “Sticking your head in the sand
and waiting for the sea levels to rise is not a valid solution.” As
with any individual weather phenomenon, it's difficult to make a direct
link to global warming. However, experts say extreme weather is a marker
of the planet's changing climate."
Photo credit above: Meteorologist John Pollack, courtesy of omaha.com.
Climate Risk Heats Up As World Switches On To Air Conditioning. Some amazing statistics in this story from
The Guardian; here's an excerpt: "
The
world is warming, incomes are rising, and smaller families are living
in larger houses in hotter places. One result is a booming market for
air conditioning — world sales in 2011 were up 13 percent over 2010,
and that growth is expected to accelerate in coming decades. By my very
rough estimate, residential, commercial, and industrial air
conditioning worldwide consumes at least one trillion kilowatt-hours of
electricity annually. Vehicle air conditioners in the United States
alone use 7 to 10 billion gallons of gasoline annually. And thanks
largely to demand in warmer regions, it is possible that world
consumption of energy for cooling could explode tenfold by 2050, giving climate change an unwelcome dose of extra momentum."
 Exxon: "Just Adapt To Warming"
. Here's an excerpt of an Op-Ed from
The Statesman Journal: "
(Exxon CEO Rex) Tillerson conceded “I’m not disputing that increasing CO2 emissions
in the atmosphere is going to have an impact,” he said. “It’ll have an
impact.” Exxon has
participated in the International Panel on Climate Change panels,
authoring and peer reviewing many subcommittee papers, “So we are very
current on the science ...” But
if you think Exxon is surrendering to policies that curb the use of
their product to slow global warming, think again. The fears are
overblown, he says, the modeling is inexact and it’s all “manageable.”
We’ll just adapt, as humans have always done.No
need for policies to reverse the global warming trend, all the
consequences do is “require us to exert — or spend more policy effort on
adaptation.”
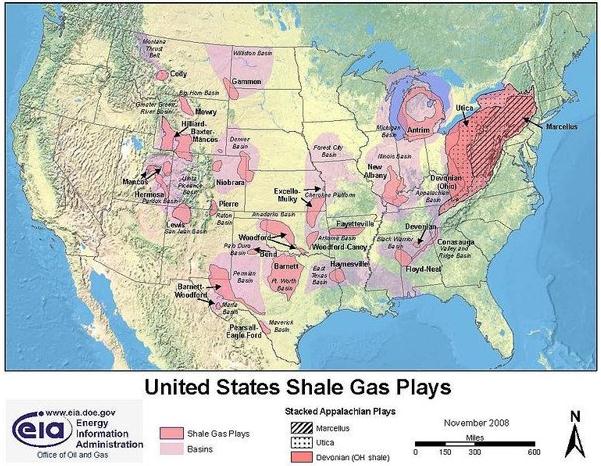
How States Are Regulating Fracking (In Maps). Here's an excerpt of a story at
The Washington Post: "
Armed
with new drilling techniques, companies are spreading out across the
United States, cracking open shale rock in search of vast new stores of
natural gas. It’s not an exaggeration to say that hydraulic
fracturing, or “fracking,” has revolutionized the U.S. energy industry.
Cheap natural gas has become America’s top source for electricity, displacing coal and bringing back jobs to once-decaying states
like Ohio. But the fracking boom has also led to plenty of
environmental concerns. Local communities are worried that the
chemicals used to pry open the shale rock can contaminate nearby
drinking water supplies. (So far, there’s scant evidence
this is happening in places like Pennsylvania, but the science is
still in its infancy.) Excess gas is often vented off, producing air
pollution."
Generation X Is Surprisingly Unconcerned About Climate Change. Here's a clip from a story from
rdmag.com: "
As
the nation suffers through a summer of record-shattering heat, a
University of Michigan report finds that Generation X is lukewarm about
climate change—uninformed about the causes and unconcerned about the
potential dangers. "Most Generation Xers are surprisingly disengaged,
dismissive or doubtful about whether global climate change is happening
and they don't spend much time worrying about it," said Jon D. Miller,
author of "The Generation X Report." The new report, the fourth in a
continuing series, compares Gen X attitudes about climate change in 2009
and 2011, and describes the levels of concern Gen Xers have about
different aspects of climate change, as well as their sources of
information on the subject."
Scientists Simple Plea To Secretary Clinton. Here's an excerpt from a post at
getenergysmartnow.com: "
Today,
a group of the nation’s leading experts on climate science sent a
brief letter to Secretary of State Hillary Clinton. The message is
simple: include climate change in the review of the Keystone XL
pipeline. From that letter:
"At the moment, your department is planning to consider the
effects of the pipeline on “recreation,” “visual resources,” and
“noise,” among other factors. Those are important—but omitting climate
change from the considerations is neither wise nor credible. The vast
volumes of carbon in the tar sands ensure that they will play an
important role in whether or not climate change gets out of hand;
understanding the role this largescale new pipeline will play in that
process is clearly crucial."


No comments:
Post a Comment