88 F. high temperature in the Twin Cities Tuesday.
83 F. average high for July 31.
93 F. high on July 31, 2011
37. Today will be the 37th consecutive day above 80 F. in the metro, the 25th day above 90 F. this year.
Mid-90s likely today. The 00z NAM is hinting at upper 90s for some towns south of the metro by mid afternoon.
July Record: every day last month brought high
temperatures above 80 F. That hasn't happened since modern-day weather
records were started in 1891. Both 1916 and 1936 came close, with 30
days above 80.
93-96 F. After a welcome weekend cool front heat
builds again next week. The ECMWF is hinting at mid 90s returning by
Tuesday of next week. Something to look forward to.
64% Based on NWS cooling degree data we've all spent
about 64% more cooling our homes/businesses than during an average
summer. Whatever that is.
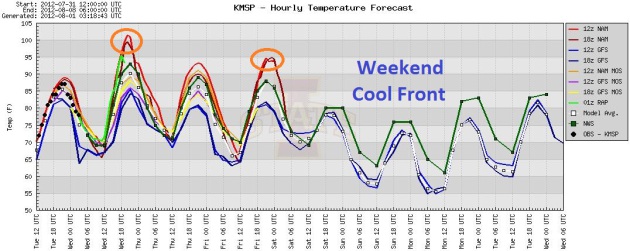
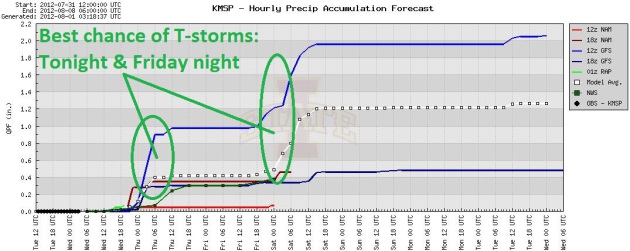
Plenty Hot. O.K. Not as hot as it was back in early
July, but mid-90s are likely today, near 90 tomorrow and then low 90s
Friday before the cool front arrives (with potentially heavy showers and
T-storms Friday night). Graph: Iowa State.
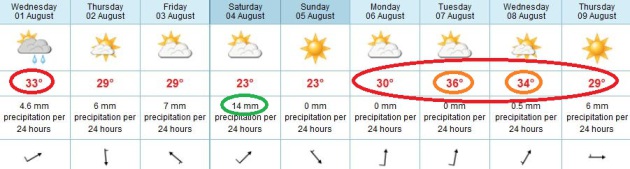
But Wait...There's More! This is getting a bit
ridiculous. I'm just the messenger here: another surge of heat is
shaping up for next week, maybe mid to upper 90s by next Tuesday. Based
on the latest ECMWF (European) model data above we may see 3-4 days
above 90 again next week. I know - I'm about ready to waive my little
white flag. I surrender.
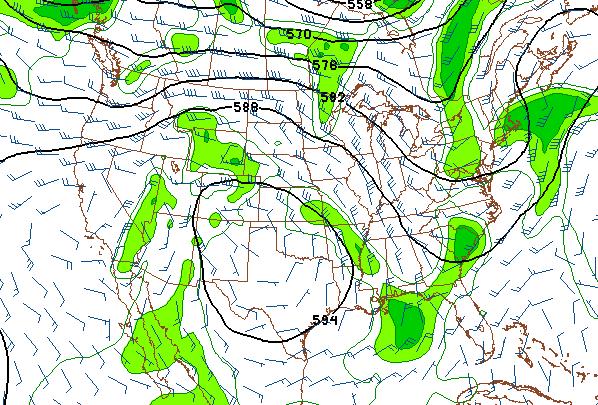
Stubborn Heat-Pump High. In previous blogs I've
shared research suggesting that a rapidly warming Arctic (warming twice
as fast as the lower 48 states) is causing jet stream winds to weaken
over the mid latitudes, allowing weather systems to track slower across
the country. Slow? Since late June weather systems have pretty much
stalled, at least over America's heartland, with a sprawling bubble of
high pressure anchored over the Plains. From time to time Canadian air
brushes the northern tier states and New England, bringing a day or two
of temporary relief. But then the hot bubble expands north once again,
shoving the main storm track north into Canada. 500 mb map above from
Tuesday evening (showing a persistent high over Texas) courtesy of NOAA
NCEP.
"
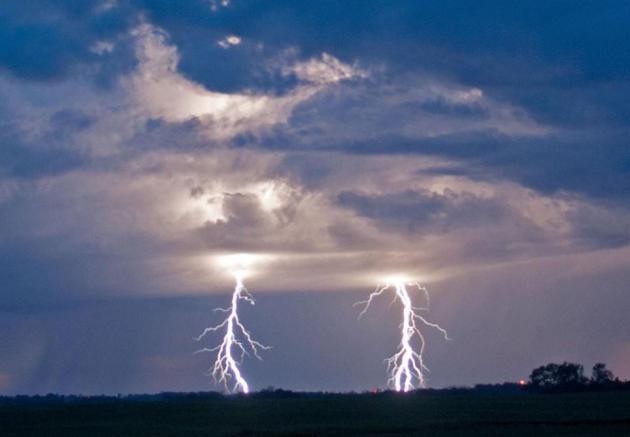
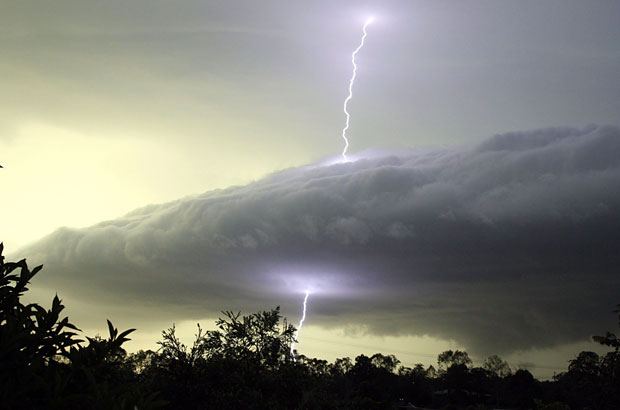
Every year lightning strikes the ground 30 million times and
injures about a thousand people in the U.S., according to the Lightning
Protection Institute." - from a story about lightning from WCIV-TV in Charleston; details below.
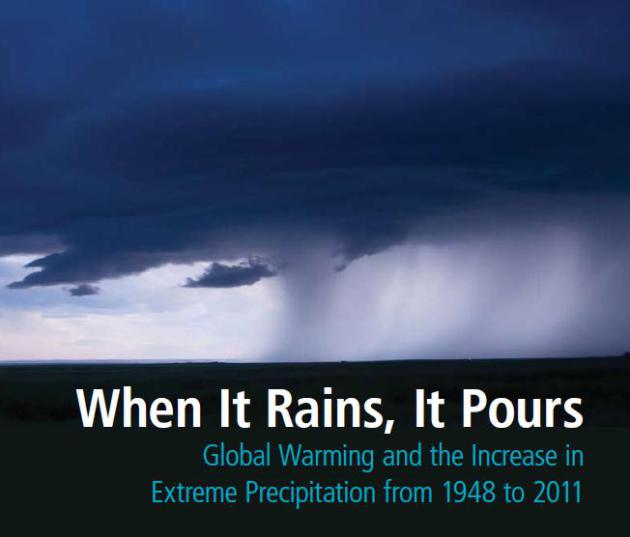
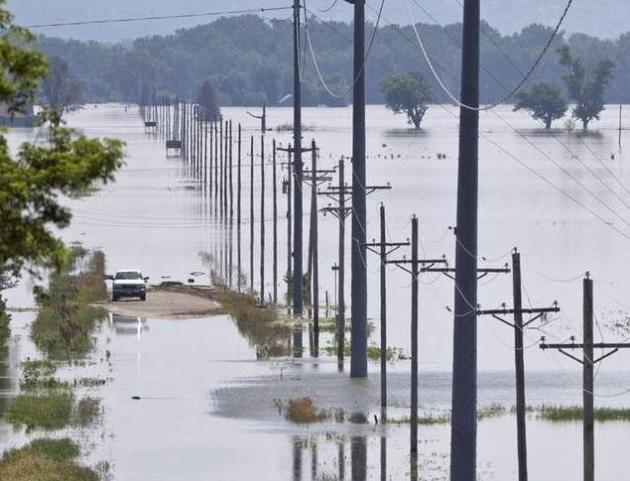
"One month after the June 20th storm led to record flooding that
devastated Duluth, Minnesota, a new Environment Minnesota Research and
Policy Center report confirms that extreme rainstorms are happening 30%
more frequently in Minnesota since 1948." - details below.
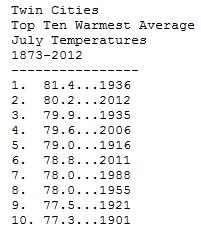
Second Warmest July On Record - First July Where Every Day Was 80+ At MSP. Here are additional details from The Minnesota Climatology Working Group: "
July
2012 will be the second warmest July on record in the Twin Cities. The
Twin Cities will wind up with the second warmest July on record with an
average temperature of 80.2 degrees, 6.4 degrees above normal. 2012
falls short of the record warmest July of 81.4 degrees from July 1936.
Also notable is that July 2012 is the second warmest month ever in the
Twin Cities for the period 1873 to 2012. July 2012 was very consistently
warm. The high temperature in the Twin Cities reached 80 degrees or
higher on all 31 days. This has never happened before in the historical
record. July 1916 and 1936 came close with 30 days each. July 2012
will also most likely have an average monthly high temperature of 90
degrees in the Twin Cities. This has happened only two other times:
92.5 degrees in 1936 and 90.2 degrees in 1988."
"
The power of confirmation bias is well known; Jonathan Haidt, in his fantastic book The Righteous Mind,
says that our rational faculty acts like a press secretary, seeking
support for policies that are already in place, not looking for new
evidence to base policies on. We get a pleasure-chemical reward when we
find evidence that supports our argument; holding controversial views,
he says, is literally addictive." - excerpt from a Telegraph article on the psychology of climate change denial; details below.
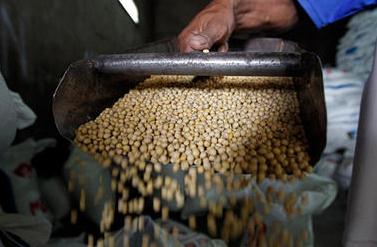
U.S. Drought Already Rippling Out Into The World. Details from
The Christian Science Monitor; here's a clip: "
Much of America's grain belt is gripped in one of the worst droughts in 50 years, and grain prices are already surging. While that's bad news for America's farmers,
the real danger is the effect that will have in poor countries, where
even small shifts in prices can have a big impact on the living
standards of hundreds of millions of people from Central America to Egypt (the biggest wheat importer in the world) and right across to Indonesia and China.
The US is the world's largest wheat and corn exporter, and its third
largest exporter of soybeans. This is less of a case of the beat of a
butterfly's wings causing a storm on the other side of the globe then a
storm here causing a catastrophe elsewhere."
Photo credit above: "
A worker runs soybeans through a machine in a warehouse belonging to a tofu factory in Jakarta, Indonesia, July 25." Supri/Reuters.
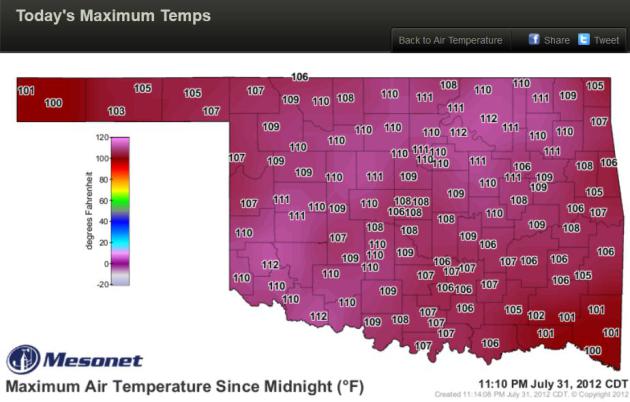
Serious Triple Digits. Air temperatures as hot as
112 F. yesterday across much of central Oklahoma? That's not the heat
index, but the actual air temperature. Map courtesty of the
Oklahoma Mesonet.
How The Drought Is Changing Business. Here's a clip from an article at USA Today and
Lexis/Nexis: "
The
overall economic costs won't be known for some time, but the consensus
among meteorologists is that 2012 already has surpassed 2011's $12
billion in drought losses, according to Steve Bowen, senior scientist
and meteorologist for Aon Benfield, a global reinsurance firm in
Chicago. He said it "may not be out of the question" that this
year's impact could rival 1988 and 1980 droughts, which had $78 billion
and $56 billion in losses (in 2012 dollars).With the debate
over climate change never far from the headlines, scientists are
delving further into weather's impact on the economy.A study based on
70 years of weather data by the National Center for Atmospheric
Research concluded last year that weather -- from heat waves to cold
snaps and droughts -- could cause up to a 1.7% rise or fall each year
in the U.S. economy's gross domestic product, equating to $507 billion
in 2011. That's not counting extreme weather events such as hurricanes
or tornadoes."
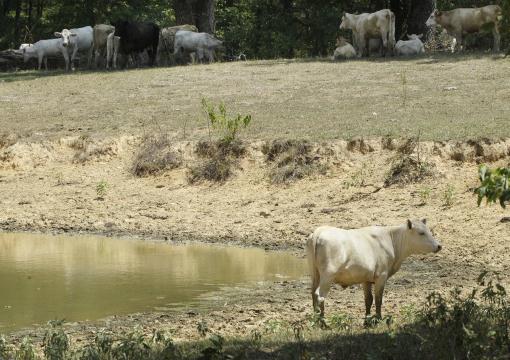
Photo credit: "
Cattle seek shade from 100-degree
temperatures at a partially dried up pond near Aplin, Ark., Tuesday,
July 31, 2012. Cattle and poultry producers in Arkansas are continuing
to feel the effects of the summer-long drought." (AP Photo/Danny Johnston)
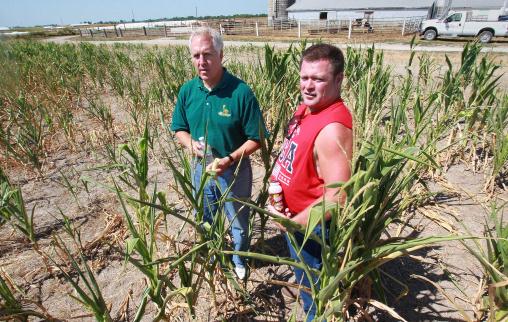
Heat Not The Only Big Concern Facing Illinois Farmers. Here's an excerpt of an article from
herald-review.com: "
The
lack of rain so far this summer isn’t the only concern facing Illinois
farmers. Researchers from the University of Illinois use fields across
the state to test various farming practices. Tours of research plots
near Tuscola and Brownstown were conducted last week, showing how the
drought is affecting agricultural research and what farmers can do to
adapt to the challenges they face. “A normal year means unexpected
things are going to happen,” said Dennis Bowman, a University of
Illinois Extension crop systems educator. “We want to alleviate
potential stress. When you put weather stresses on top of that, the
problems get compounded.”
Photo credit above: "
U.S. Congressman John Shimkus, left,
speaks on Friday July 27, 2012 with Luke Timmermann in one of
Timmermann's remaining corn fields at his St. Rose, Illinois dairy
farm. He raises the corn as feed for his dairy operation, and has had
to harvest much of it and place it in long-term storage as silage for
the livestock due to the drought. The corn is stunted in size and
development due to the drought and despite Timmermann's efforts to
increase size and yield." (AP Photo/Belleville News-Democrat, Tim Vizer)
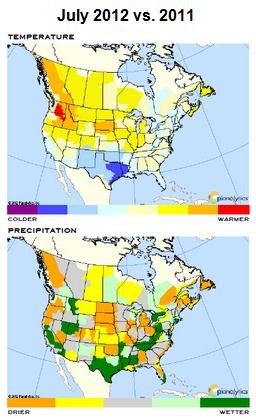
Warmest July In Over 50 Years. Details from
Planalytics: "
Although
July 2012 was warmer than last year, heat surges were focused in
different locations, driving seasonal demand in diverse regions compared
to 2011. In the U.S., July 2012 was the warmest in over 50 years and
driest since 2001. Canada experienced its 2nd warmest July in over 50
years (lagging 2006), and driest since 2005."
Significant Weather Events:
- Drought conditions expanded throughout the month, peaking at over 60% of the U.S. by late-month.
This is the most pervasive drought in over 50 years, with the most severe conditions in the Central Plains and Missouri Valley.
- July began with a heat wave spreading across the eastern two-thirds of the U.S.
The Independence Day holiday was the warmest in over 50 years.
"Drought Is An Insidious And Patient Killer". Here's an excerpt (and video clip) from
National Geographic: "
This week Water Currents’ own Jay Famiglietti came
to Washington from California to testify before Congress on the
importance of supporting research on drought and hydrology science.
Famiglietti, a professor at the University of California, Irvine’s
Department of Earth System Science and Department of Civil and
Environmental Engineering, is perhaps best known for his satellite-based
research on over-pumping of aquifers. Famiglietti told
Congress, ”Drought is an insidious and patient killer of food and fuel
crops, of livestock, of flora and fauna, and of humans, and it has
emerged as a major threat to our nation’s food, health, economic, and
water security.” He added that these impacts may be a greater threat in
the coming decades since temperatures are expected to go up."
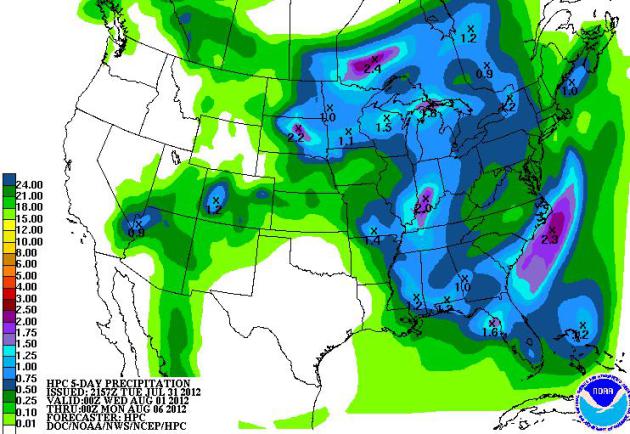
5-Day Rainfall Outlook. NOAA HPC prints out some .5
to 1"+ rainfall amounts from the Upper Midwest into the Corn Belt of the
Ohio Valley thru Monday, welcome rain extending south to Louisville and
much of Florida. But west of the Mississippi rainfall will be sparse to
non-existant, with the exception of monsoon showers and storms over
Arizona and Colorado.
Two Rounds Of T-storms. The best chance of T-storms
across Minnesota comes tonight, again Friday night, out ahead of a
significant cool front for the weekend. Too bad the cool won't last for
long.
Extended Outlook: More Extreme Rains. As I've been
sharing for many years now, the rain is not falling as gently as it did
40-80 years ago across Minnesota and the Midwest. Here are
more details from yesterday's press release from
Environment Minnesota: "
An
analysis of more than 80 million daily precipitation records from
across the contiguous United States reveals that intense rainstorms and
snowstorms have already become more frequent and more severe. Extreme
downpours are now happening 30 percent more often nationwide than in
1948. In other words, large rain or snowstorms that happened once every
12 months, on average, in the middle of the 20th century now happen
every nine months. Moreover, the largest annual storms now produce 10
percent more precipitation, on average." More highlights:
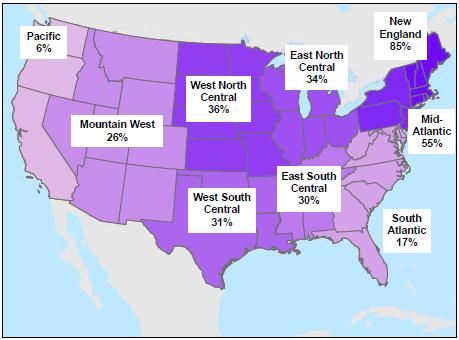
- New England has experienced the greatest change, with intense
rainstorms and snowstorms now happening 85% more often than in 1948. The
frequency of intense rain or snowstorms nearly doubled in Vermont and
Rhode Island, and more than doubled in New Hampshire.
The change
has also been pronounced in the Mid-Atlantic, the South, the Midwest
and the Mountain West. New York, Pennsylvania and Missouri each
experienced an increease in extreme dounpour frequency of more than 50%.
In total, 43 states showed significant increases in the frequency of
extreme donwpours. Only one state, Oregon, experinced a significant
decrease.
- Not only are extreme downpours more frequent, but they are also
more intense. The total amount of precipitation produced by the largest
storm each year at each station increased by 10% over the period of
analysis across the contiguous United States. The trend was most
pronounced in New England and the Middle Atlantic. Connecticut,
Delaware, Massachusetts, Maine, New Hampshire, New Jersey, New York,
Pennsylvania and Vermont all saw the intensity of the largest storm
each year increase by 20% or more. The trend also occurred across the
Midwest, the South and the West.
In total, 43 states experienced
a statistically significant increase in the amount of precipitation
produced by the largest annual rain or snow storm. Only one, Oregon, recorded a significant decrease.
Regional Trends Toward Increased Extreme Rainstorm and Snowstorm Frequency. (from Tuesday's Environment Minnesota report).
- The factual basics: The average temperature in the United States
has increased by 2 F. over the last 50 years. Nine of the ten warmest
years on record have occurred since 2000. Warmer temperatures increase
evaporation and enable the air to hold more water.
Scientists have found that the water content of the atmosphere is now increasing at a rate of about 1.3% per decade.
The additional moisture loaded into the atmosphere by global warming
provides more fuel for intense rainstorms and snowstorms. All of which
means that global warming will very likely drive future increases in
extreme downpours, with a wide range of harmful consequences from
catastrophic flooding to property damage. From the USGCRP: "Heavy
downpours that are now 1-in-20 year occurrences are projected to occur
about every 4 to 15 years by the end of this century." its report said,
while producing 10 to 25% more precipitation per storm, depending on
location and on the scale of future emissions of global warming
pollution.
* the full 47 page report from Environment Minnesota is
here. (pdf).
"
One month after the June 20th storm led to record flooding that
devastated Duluth, Minnesota, a new Environment Minnesota Research and
Policy Center report confirms that extreme rainstorms are happening 30%
more frequently in Minnesota since 1948. "As the old saying goes, when
it rains, it pours - as we have experienced here in Minnesota this year
and over the last few years," said Ken Bradley, Policy Director for
Environment Minnesota Research and Policy Center. "We need to heed
scientists' warning that this dangerous trend is linked to global
warming, and do everythign we can to cut carbon pollution today." Based
on the analysis of state data from the National Climatic Data Center,
the new report found that heavy downpours that used to happen once every
12 months on average in-state now happen every 9.2 months on average.
Moreover, the biggest storms are getting bigger. The largest annual
storms in Minnesota now produce 12 percent more precipitation, on
average, than they did 65 years ago." - Environment Minnesota.
Severe Hail. The combination of strong winds and
golfball-size hail knocked out car and apartment windows. More details
from WeatherNation TV's
Facebook page: "
Another
photo from Oakland City, IN. This one from @BigJonMusic -- He told us
there are windows blown out of cars and buildings all over town and
there's a gas leak east of Jackson St. forcing half of Oakland City to
evacuate."
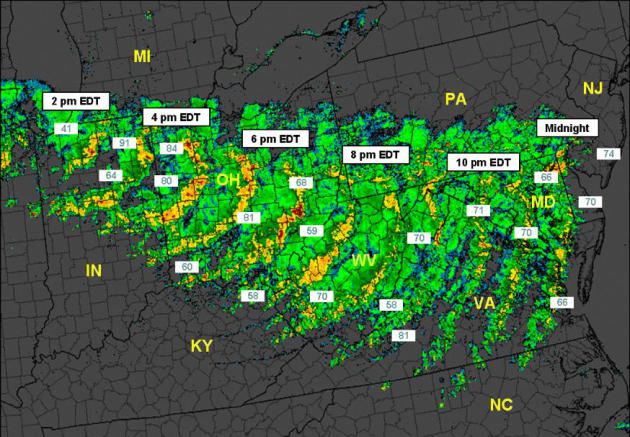
More On The June 29 Super-Derecho. Here's a good
analysis of the wild, boomerang-shaped swirl of severe winds, roughly
equivalent to a 20 minute Category 1 hurricane, that swept from Chicago
to the Tidewater region of Virginia on June 29. Details from
NOAA: "
While
not the most intense or long-lived event ever observed, the June 29,
2012 Ohio Valley/Mid Atlantic derecho was noteworthy in producing the
all-time highest recorded June or July wind gusts at several observing
sites along its path (Fort Wayne, Indiana, Zanesville, Ohio, and
Huntington, West Virginia), in addition to widespread, significant wind
damage. Five million people lost power from Chicago to the mid Atlantic
Coast, and 22 were killed. The storm also was notable for being arguably
the first derecho to capture widespread media attention, striking as it
did nearly every metropolitan area in a broadening path that extended
from Chicago and Indianapolis to Baltimore, Washington, and Tidewater
Virginia."
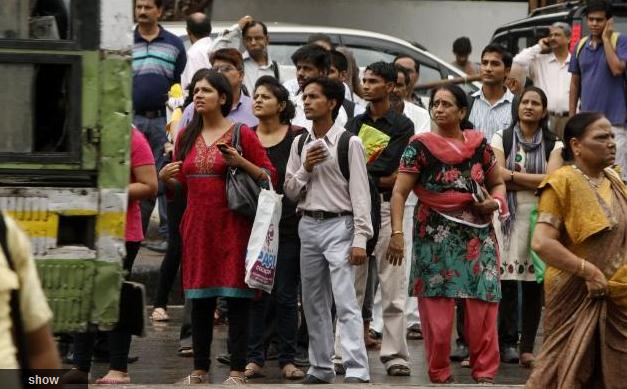
Power Grids In India Fail In Massive, Cascading Blackout Affecting More Than 600 Million. This headline got my attention. 600 million residents of India without power?
The Star Tribune has more details: "
NEW
DELHI - India's energy crisis cascadedover half the country Tuesday
when three of its regional grids collapsed, leaving 620 million people
without government-supplied electricity for several hours in, by far,
the world's biggest blackout. Hundreds of trains stalled across the
country and traffic lights went out, causing widespread traffic jams in
New Delhi. Electric crematoria stopped operating, some with bodies
half burnt, power officials said. Emergency workers rushed generators
to coal mines to rescue miners trapped underground. The massive failure
- a day after a similar, but smaller power failure - has raised
serious concerns about India's outdated infrastructure and the
government's inability to meet its huge appetite for energy as the
country aspires to become a regional economic superpower."
Photo credit above: "
Commuters wait for buses outside a
Metro station after Delhi Metro rail services were disrupted following
power outage in New Delhi, India, Tuesday, July 31, 2012. A massive
blackout hit northern and eastern India on Tuesday afternoon, leaving
600 million people without electricity in one of the world's most
widespread power failures. The outage came just a day after India's
northern power grid collapsed for several hours leaving cities and
villages across eight states powerless."
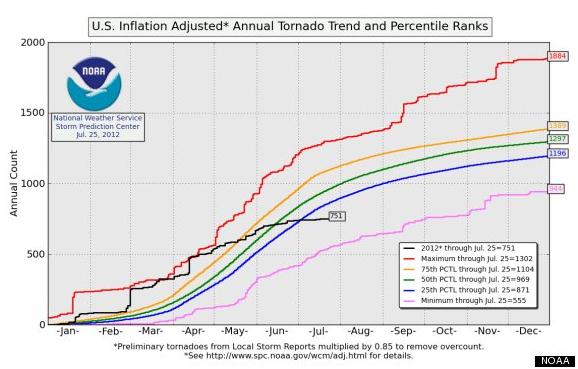
Tornado Season 2012: Record-Low Twister Count Is Drought's Silver Lining. The story from Climate Central and
Huffington Post: "
There
is at least one upside to the massive drought that covers more than
half of the lower 48 states: a near-record low number of tornadoes. In
contrast to last year, when swarms of tornadoes killed hundreds during
the spring and early summer, this year has seen a flatlining of tornado
numbers since June. Through July 23, there had been just 12 tornadoes
recorded in the U.S. this month, and unless a severe weather outbreak
in the Northeast on Thursday results in a large number of twisters,
it’s likely that the U.S. will break its record for the fewest
tornadoes in the month of July. In fact, the U.S. may even break its
record for the least tornadoes in any summer month."
Graphic credit above: "
Tornado counts after adjusting for the effects of inflation due to changes in tornado observation methods."
Deadly Phenomena Of Lightning Strikes Underrated. The story from
WCIV-TV; here's an excerpt: "
Summer
is the peak season for one of the nation's deadliest weather phenomena,
lightning. Lightning is an underrated weather hazard. Yet, it is a
leading storm-related killer and results in more than $1 billion in
property damage each year in the U.S., according to the Insurance
Information Institute (I.I.I.). Lightning is a charge from the
atmosphere to the ground emanating from a thunderstorm. The air
surrounding a bolt can be as hot as 54,000 degrees or about six times
as hot as the sun -- the reason for lightning's potentially fatal
danger. Every year lightning strikes the ground 30 million times and
injures about a thousand people in the U.S., according to the Lightning
Protection Institute. An average of 54 people are killed in this
country alone by the intense electrical discharges from a thunderstorm.
Four people have been killed so far this year."
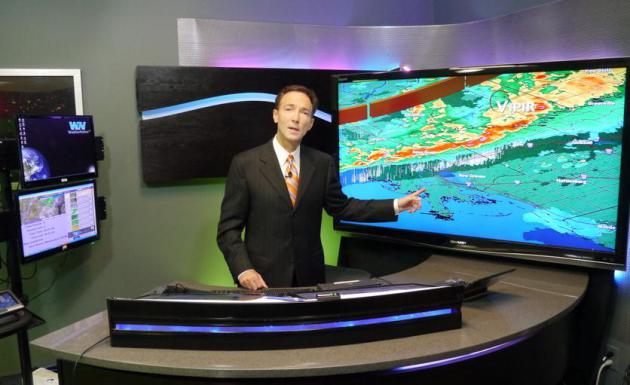
Americans Loath To Heed Weather Warnings. This article, from
WeatherBug, caught my eye - here's an excerpt: "
When
flash-flood warnings rolled across Alexandria Carasia`s television
screen in June 2009, she decided they weren`t such a big deal.
"Sometimes they exaggerate," said Carasia, 84, of Jeannette. Then the
rain came, and the nearby creek crept across the street and into her
yard, toppling the wall she built as a little girl with her father and
11 siblings. Carasia`s skepticism about weather warnings isn`t uncommon.
A third of those polled for a study by Federal Signal Corp. said they
have to actually see a tornado, flood or other danger to care about the
emergency. Less than half of the survey`s respondents said they would
take steps to get to safety based on a severe weather warning. Federal
Signal Corp. is an Illinois-based manufacturer of public safety
communications equipment. "It`s concerning. Some people need to see a
funnel cloud barreling in the distance (before they act)," said Fred
McMullen of the National Weather Service in Moon, who monitors regional
weather patterns with sophisticated 3-D maps on giant computer and
television screens."
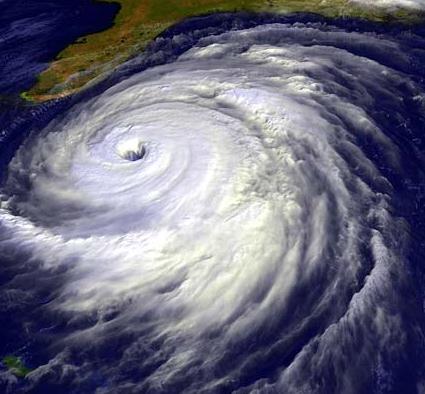
Most Recent Category 5 Hurricanes Wouldn't Have Made The Cut In The Pre-Satellite Era. Here's a clip from an interesting article on rating hurricane intensity from
The Houston Chronicle: "
As we approach the heart of the Atlantic hurricane season — and the next tropical storm
could well form during the next week deep in the Atlantic tropics — the
Journal of Climate has published an interesting new paper (see .pdf). One of the challenges of comparing modern hurricane activity to historic activity
is that our tools keep changing. They’re improving, naturally, but
this causes problems when we try to make sense of whether there’s
anything significant about present-day activity. It’s important to
understand whether hurricanes might be getting stronger as the world
warms. Although there is some evidence to suggest the strongest storms
today are a bit stronger than they have been in the past — i.e. there
are a few more Category 5 storms today than in the past — the scientific community remains divided on this question. The most recent IPCC report on climate and extreme weather
topic stated, “Average tropical cyclone maximum wind speed is likely
to increase, although increases may not occur in all ocean basins.”
Refining "Superfog" Forecasts. Here's an excerpt of an article that caught my eye from
The Herald Tribune: "
One
meteorologist dubbed it superfog, while others simply refer to it as a
whiteout. It is a phenomenon that can happen when smoke from a
smoldering fire combines with fog or other moisture in the air,
creating a dense mixture that can cut visibility to a few feet. It
typically occurs in the hours before dawn, with sometimes disastrous
results on nearby roads. It seems unpredictable, covering roads minutes
after they were completely clear. But U.S. Forest Service
meteorologists used information from Florida highway crashes where
smoke and fog were present to develop an index predicting those
conditions. One is now working on a more precise way to determine when
superfog is likely to happen."
"Ask Paul". Weather-related Q&A:
Dear Mr. Douglas:
"Is there an arithmetic formula to determine a heat index value by using the function of temperature and dew point?"
Forest Hundley-Clark
Plymouth
Forest - I couldn't find an equation that
incorporates dew point; everything (that I could find) is tied to
relative humidity. Knowing temperature and dew point you can calculate
relative humidity (Google it). From
Wikipedia:
"The formula below approximates the heat index
in degrees Fahrenheit, to within ±1.3 °F. It is the result of a
multivariate fit (temperature equal to or greater than 80°F and
relative humidity equal to or greater than 40%) to a model of the human
body. This equation reproduces the above NOAA National Weather
Service table (except the values at 90°F & 45%/70% relative
humidity vary unrounded by less than -1/+1, respectively)."

where
 = heat index (in degrees Fahrenheit)
 = ambient dry-bulb temperature (in degrees Fahrenheit)
 = relative humidity (in percent)


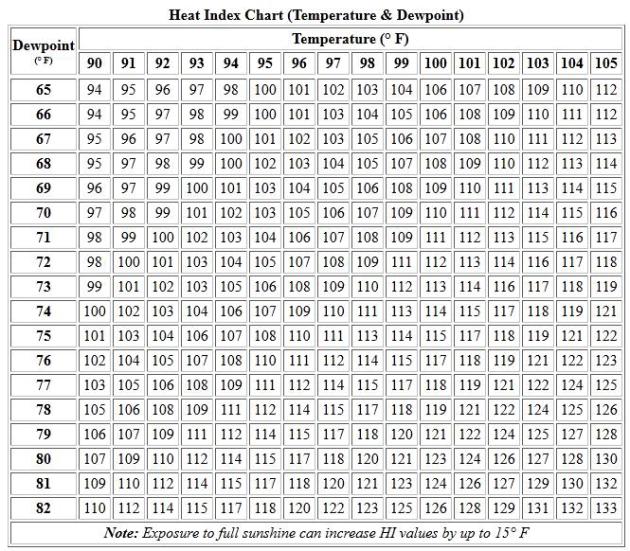
Not sure how much free time you have on your hands, but it's easier to consult a table like the one below:
Heat Index. Knowing dewpoint and air temperature you can easily check on the latest heat index. Chart courtesy of
weatherimages.org.
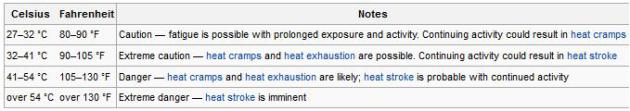
What Heat Index Is Considered Dangerous? Anytime the heat index goes above 100-105 F. you have to take the situation very seriously. The table above is from Wikipedia.
Hi Paul,
"Assuming the temperature reaches at least 80
on July 31, which sounds very likely, can you confirm that July 2012
will be the first month in recorded history for the Twin Cities that
every day had a high temperature of 80 or above? I haven't seen anything
related to this in the media or from the National Weather Service, but a
database of Minneapolis climate data I have that dates back to 1891
indicates that every month prior to this July had at least one day that
didn't have a high of at least 80, and I am just curious if my
information is correct."
Thank you.
Dave Gullickson
Dave, thanks for bringing this factoid to my
attention. You are correct. Every day in July saw highs of 80 F. or
higher, a first for the Twin Cities in July. 1916 and 1936 came close;
each of those Julys brought a total of 30 days above 80 F. Appreciate
the great nugget!
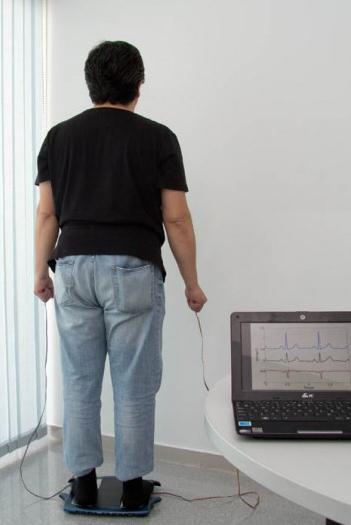
Experimental Weigh Scale Also Checks Your Heart. Details from
gizmag.com: "
People
being monitored for heart conditions currently have to go into a
hospital or clinic on a regular basis, to have an electrocardiogram
performed on them. That may be about to change, however, as researchers
from Spain’s Universitat Politècnica de Catalunya have developed a
bathroom scale that performs the procedure right in the user’s home."
Like A Flood: Get Ready For A New iPhone This September.
Yes, there's a 47% probability, although I hear it won't be the "5",
just "the new iPhone". I'll believe it when I see it. Buyer beware, the
rumor-mill is grinding away. Here's the latest from
redorbit.com: "
iPhone rumor news came like a flood yesterday, with the deluge starting just after lunch, Pacific time. Rene Ritchie over at iMore.com
made sure we had something interesting to wake up to, running a story
with the headline “Apple iPhone 5 and iPad mini event planned for
September 12, iPhone 5 release date for September 21.” According to
Ritchie’s report, sources had said Apple would hold a special event on
Wednesday, September 12 to announce not only a new iPhone and not only a
new iPod Nano, but a new iPad Mini as well, making it one of the most
ambitious product announcements ever. Similar to iPhone announcements
in the past, the next Apple smartphone will begin shipping just 9 days
later, on September 21." (Photo: Brian Peterson, Star Tribune).
iPhone 5 Created From Leaked Parts And Plans. Fanboy Alert - let's hop on the rumor mill together; here's an excerpt from
gizmag.com: "
We've been hearing quite a few rumors about what the anticipated iPhone 5
will look like, which is no surprise. But if a set of photos from
Japanese repair shop iLab making its way around the web is to be
believed, someone has gone a step further and attempted to assemble what
the new iPhone could look like based on the leaked parts we've heard
about so far."
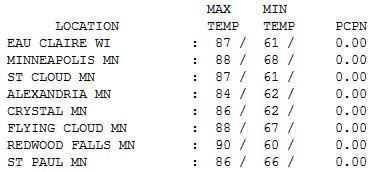
Almost Pleasant. I'm still struck by how far we've
come this summer. We've reached the point where highs in the upper 80s
and dew points in the low to mid 60s can be misinterpreted as "relief".
The worst of the sauna-like heat pushed south, keeping highs in the 80s
statewide; ranging from 84 at Alexandria to 87 St. Cloud, 88 Twin Cities
and 90 at Redwood Falls.
Paul's Conservation Minnesota Outlook for the Twin Cities and all of Minnesota:
TODAY: Hot sun, uncomfortable by afternoon. Dew point: 68 (rising). Winds: SW 10. High: 95
WEDNESDAY NIGHT: T-storms in the area. Still very humid. Low: 72
THURSDAY: Partly sunny, a bit less humid. Dew point: 63 (falling slightly). High: near 90
FRIDAY: Stuffy, nighttime storms. Dew point: 65. Low: 73. High: 93
SATURDAY: Wet start, Partial clearing, breezy and cooler. Dew point: 57. Winds: W 15+. Low: 68. High: 84
SUNDAY: More sun, noticeably cooler! Dew point: 53. Winds: NW 10-15. Low: 62. High: 79
MONDAY: Sunny and warmer. Dew point: 58. Low: 66. High: 89
TUESDAY: Sticky sun, hot again. Dew point: 65. Low: 70. High: 92
A Two-Shower Day
"Summer afternoon—summer afternoon; to me those
have always been the two most beautiful words in the English language"
wrote Henry James.
Aaah, the memories. It was on a lovely summer afternoon that I opened up my latest electric bill.... and nearly had a coronary!
Based on NWS cooling degree days we've spent 64 percent more than average cooling our homes and businesses since June 1.
July was the 2nd warmest on record; the first
July since modern-day records began in 1891 where EVERY day was 80 F. or
warmer. Not one cool, rainy day wash-out, which is unusual.
Today will be the 37th consecutive day above 80,
in fact a few models are hinting at 95-100 F. heat. We may top 90 every
day thru Friday - the best chance of T-storms tonight, again Friday
night. A wet start Saturday gives way to partial clearing, as cooler,
Canadian air pushes south. Sunday still looks like the sunnier, milder
day.
Next week 100-degree heat stays just south of
Minnesota; highs near 90 Monday & Tuesday. The drought will get much
worse over America's heartland. The tenacity of the heat is nothing
short of awe-inspiring.
Just when you think you've seen it all, along comes the (endless) summer of 2012. Think cool thoughts.
Climate Stories...
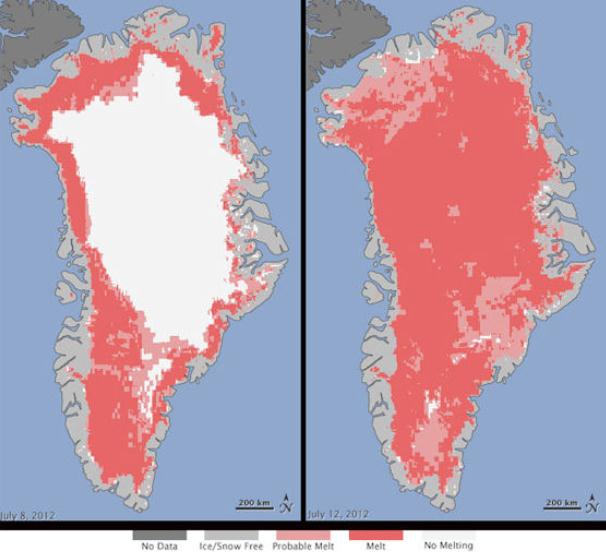
Melting Of the Greenland Ice-Sheet: Short Term Event Or Long Term Climate Change? Here's an excerpt from
wired.com: "
While
this news is very significant in the climatology and glaciology
community, some are going step further and are attempting to connect it
with other indicators of climate change. The definitive answer to that
question is not clear and many news outlets are doing a good job
providing a balanced view of this news. Several points should be made
about this news: The media is using the term “unprecedented”. In fact,
the NASA press release about this
is using the term “unprecedented”. What is “unprecedented” about this
news is the ability for the satellites to see the warming, and the
speed with which that data can be seen by the scientists. The warming
itself certainly is not unprecedented. Conditions supporting this were
last measured directly in 1889, and ice core samples,
which have the ability offer evidence of climate conditions over
100,000 years old, have indicated that vast warming occurs approximately
every 150 years. For this to happen in 2012 is not unreasonable."
Map credit above: "
The image on the left is from 8 July
12, while that on the right is from 12 July 2012, showing a profound
increase in reflectivity of the landmass. Such increased reflectivity
indicates a transition from solid ice and snow to liquid water." Image courtesy of Nasa.gov.
Climate Change And Confirmation Basis: What Would It Take To Change Your Mind? Time
to tackle the psychology of climate change denial. For some, now amount
of evidence will ever be enough. It goes much deeper than that. Here's
an excerpt of an article from
The Telegraph: "
Ask
yourself the following: what would it take to make you change your
mind on a strongly held belief? An empirical one, a matter of fact.
Especially one which you have, in part, defined yourself by. It's very
difficult to do. The power of confirmation bias is well known; Jonathan Haidt, in his fantastic book The Righteous Mind,
says that our rational faculty acts like a press secretary, seeking
support for policies that are already in place, not looking for new
evidence to base policies on. We get a pleasure-chemical reward when we
find evidence that supports our argument; holding controversial views,
he says, is literally addictive. And now, with the advent of the
internet, it is easy to find supportive evidence for almost any beliefs
you may hold. Illuminati nuts, 9/11 truthers and Obama birthers, Moon
landing conspiracists, Aids denialists, Young-Earth creationists; all of
them can find superficially convincing evidence for their beliefs
within seconds of reaching the Google home page."
* That faint, distant rustle is the sound of (professional) climate deniers grasping at straws:
Conservatives Still Trying To Dispute Global Temperature Trend. Here's an excerpt from a recent post at
Media Matters: "
Scientist: Watts' Data Only Concerns The Continental U.S. "Which Is Approximately 2% Of Global Surface Area." Scott Mandia, Professor of Earth and Space Sciences at Suffolk Community College and co-founder of the Climate Science Rapid Response Team, stated: "Fox
News is incorrect. Watts' data is for the 48 continental US states
which is approximately 2% of global surface area. His analysis cannot be
used to speak to global climate change." [Email to Media Matters,
7/31/12]
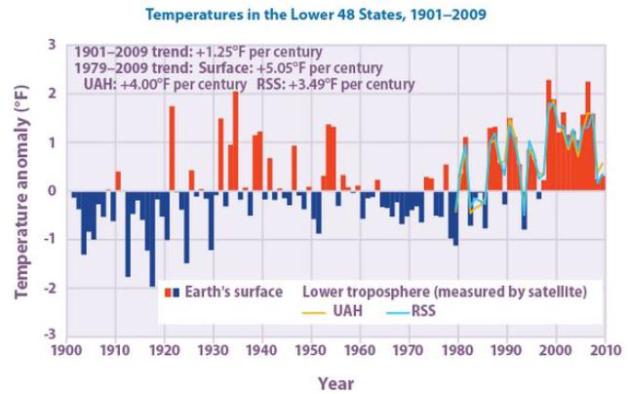
Satellite Data Confirm Warming Trend Globally And In The U.S. Professor
Mandia further noted that "The rate of warming measured in the US is
in line with satellite inferred trends and satellites do not have
thermometers nor are they 'poorly sited.'" The following graph (above)
created with 2010 data provided by NOAA shows that surface temperatures
for the continental U.S. (red and blue bars) closely track two methods
of analyzing satellite temperatures (yellow and teal lines)."
Agricultural Adaptation To A Changing Climate: Economic And Environmental Implications Vary By U.S. Region. Here's a section from a
new paper from the USDA and The Economic Research Service: "
...Regionally,
crop sector impacts from climate change are likely to be greatest in
the Corn Belt, with annual losses ranging from $1.1 billion to $4.1
billion across scenarios. Heightened damage from crop pests could lead
to additional losses of $400 million to $600 million in that region.
Economic effects in other regions may be positive or negative, depending
on how well crop rotation and tillage practices accommodate changes in
temperature and precipitation and how market-mediated prices change for
predominant regional crops. Drought-tolerant varieties increase returns
nationally and in regions that plant them, indicating that further
development of drought-tolerant varieties could be beneficial under a
wide range of adverse climate changes."


No comments:
Post a Comment