80 F. high Sunday in the cities (morning clouds and heavy rain kept us cooler than predicted).
83 F. average high for July 29.
89 F. high on July 29, 2011.
.51" rain fell on the Twin Cities Sunday morning.
4.9" rain so far in July at KMSP, 1.14" wetter than average, to date. Soil moisture in the immediate metro area is in good shape.
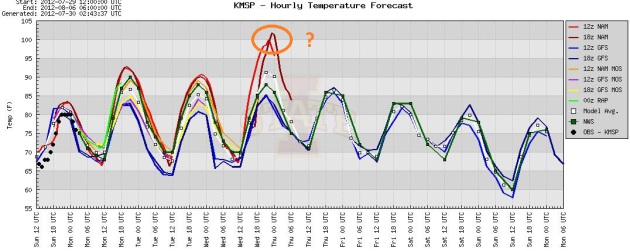
Another Midweek Heat Spike? Assuming the sun stays
out today (likely) we should hit 90 F. again, maybe 2-3 F. cooler
Tuesday as winds shift to the north/northwest, before surging into the
90s again Wednesday. The latest NAM models are hinting at upper 90s, one
of the runs showing 100+ Wednesday afternoon. I don't think it will get
that hot, but mid-90s seem more likely by midweek. Lovely.
Not Quite As Extreme. Minnesota will be on the
northern edge of the persistent heat wave gripping much of America's
midsection, topping 90 today and Wednesday. More clouds and T-storms
Thursday and Friday keep us a bit cooler, a push of Canadian air
dropping temperatures into the low 80s next weekend (70s up north); but
the latest ECMWF is hinting at more 90s next week, maybe mid-90s
returning by next Tuesday. Yeah - this is getting old.
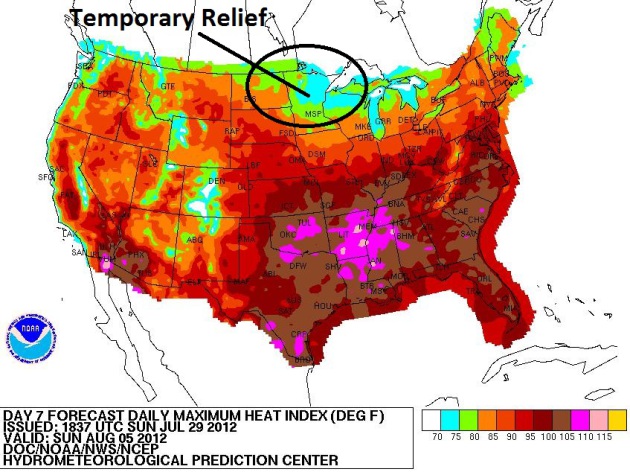
A Whiff of Weekend Relief. The strongest push of
Canadian air since early June is forecast to arrive Saturday as winds
swing around to the northwest, pulling slightly cooler, drier air south
of the border. By Sunday the predicted heat index (above) will drop into
the low 70s over the northern half of Minnesota, a welcome push of free
A/C (one that will last about 48 hours, give or take).
$61 million. Amount of money the Koch brothers have allegedly given to groups denying climate science since 1997. Source:
Greenpeace.
"
The evidence is solid and accumulating rapidly. Humanity is
putting itself at increasing peril through human-induced climate
change. As a global community, we will need to move rapidly and
resolutely in the coming quarter-century from an economy based on
fossil-fuels to one based on new, cutting-edge, low-carbon energy
technologies." - Dr. Jeffrey Sachs, Director of Columbia University's Earth Institute, in an article at madison.com; details below.
26 days above 90 F. at Indianapolis, a new record. Old record set in 1901.
Converted Skeptic. "
Call me a converted skeptic.
Three years ago I identified scientific issues that, in my mind, threw
doubt on the very existence of global warming. Now, after organizing an
intensive research effort involving a dozen scientists, I’ve concluded
that global warming is real, that the prior estimates of the rate were
correct, and that cause is human....
Our results show that the
average temperature of the Earth’s land has risen by two and a half
degrees Fahrenheit over the past 250 years, and one and a half degrees
Fahrenheit over the most recent 50 years. Moreover, it appears likely
that essentially all of this increase is due to the human emission of
greenhouse gases."
- excerpt of a New York Times Op-Ed from former climate skeptic,
Richard Muller, lead author of the "BEST" (Berkeley Earth Surface
Temperature) project. Details from The New York Times below.
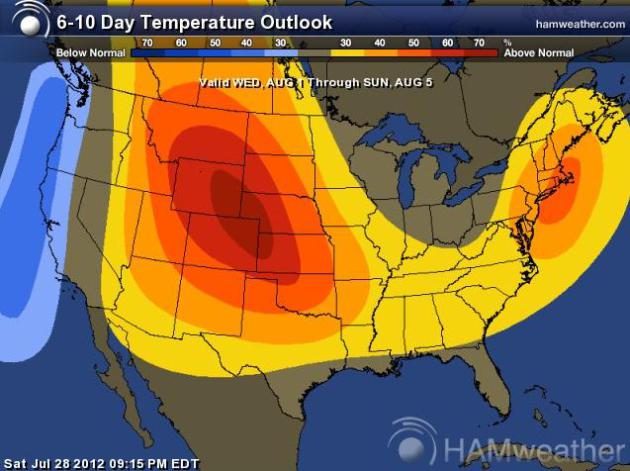
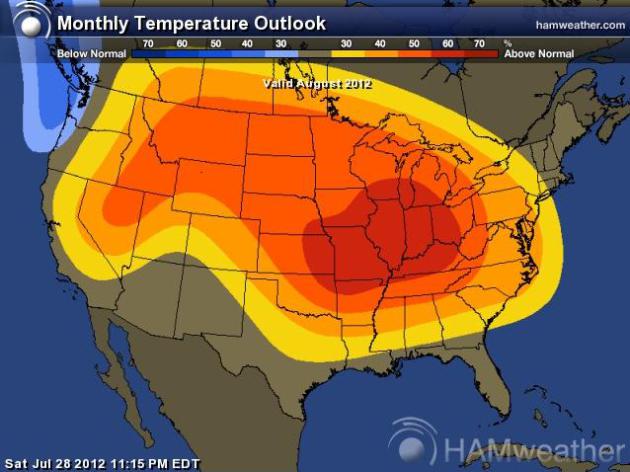
Nagging Warm Bias. Although NOAA CPC's 6-10 Day
temperature outlook shows the worst of the heat shifting across the
Plains into the Rockies, the extended outlook for August (upper right)
shows a warm bias for much of the USA, the center of the heat forecast
over the Middle Mississippi Valley and the Ohio Valley, complicating any
recovery from the drought for much of the Corn Belt.
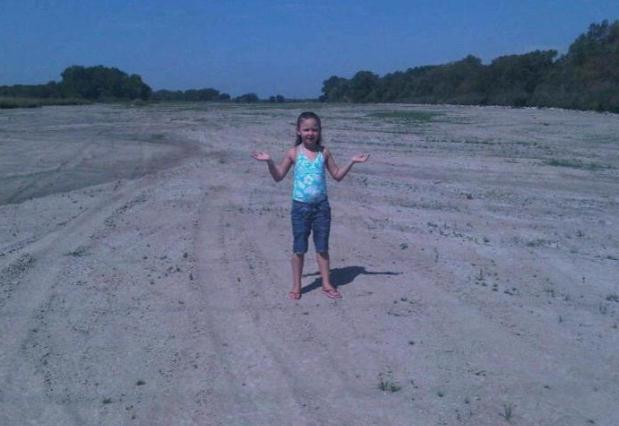
Withering Drought. Here's a post from the Hastings, Nebraska office of the
National Weather Service: "
Where's the water for swimming in the Platte?"
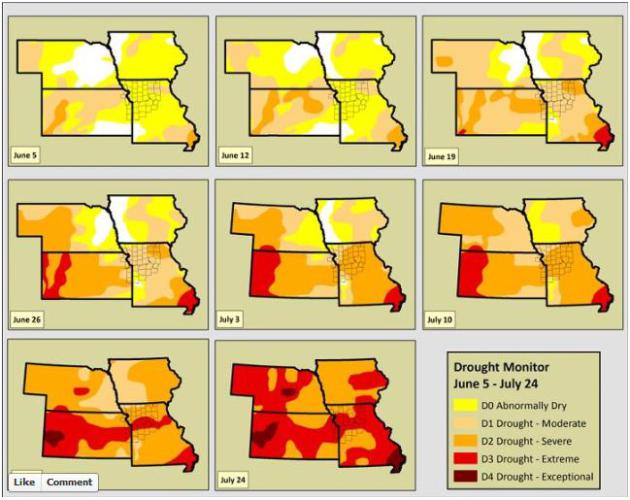
Expanding Drought. Here's an entry from the Pleasant Hills, Missouri office of the NWS, via
Facebook: "
Curious
how the drought has progressed since early June? We've constructed a
"drought progress map" focused on changes to the drought status from
June 5th through the latest drought monitor update on July 24."
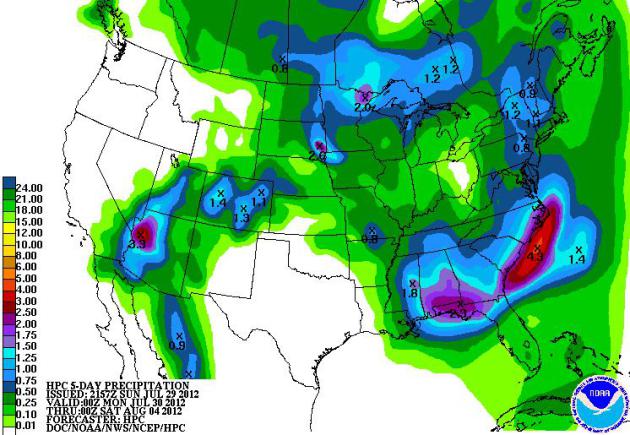 5-Day Rainfall Outlook.
The drought continues to worsen over the Central Plains; little rain
expected through Saturday of this week. Monsoon rains soak Arizona,
heavy showers and T-storms over the southeastern USA, the approach of
slightly cooler air sparking some 1/2 to 2" amounts over the Upper
Midwest by late week. Map: NOAA HPC.
* a tornado at
11,900 feet above sea level?
KOMOnews.com has the story of a Colorado hiker/photographer who captured the "second highest" tornado in U.S. history.
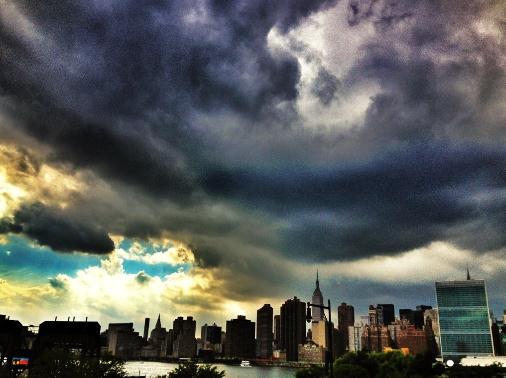
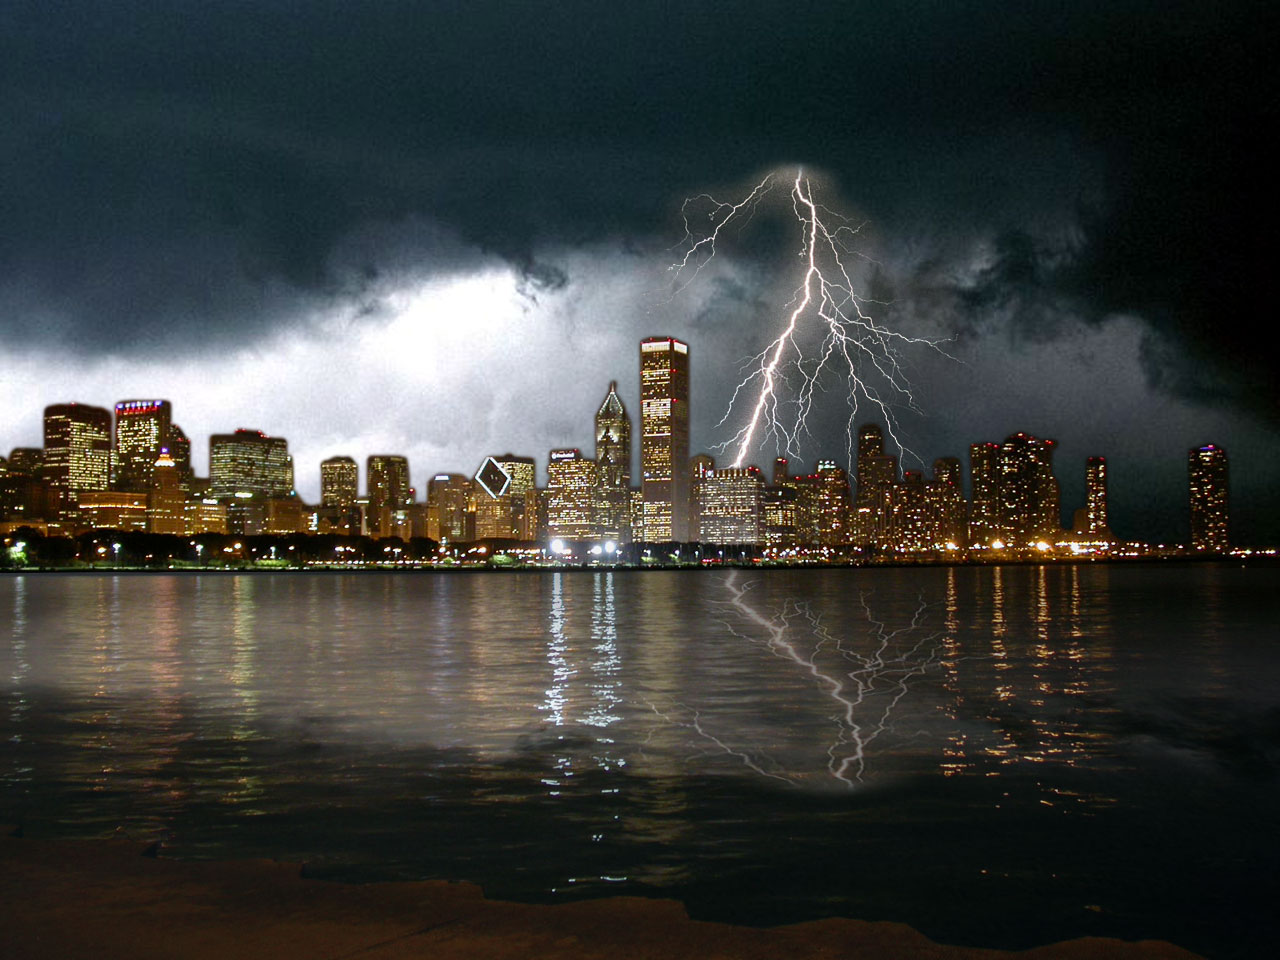
The Big (Unsettled) Apple. Thanks to @roland99 for sending in a photo of a turbulent sky over Manhattan.
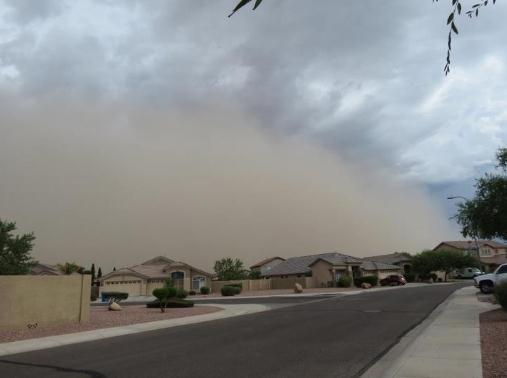
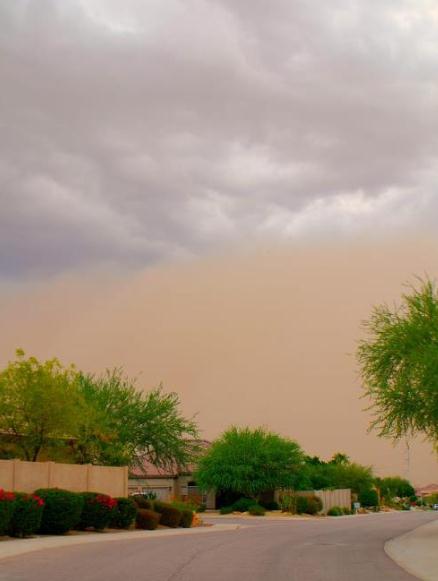
Haboob Warming.
Jodi Daly captured the photo (upper left) as a haboob, a massing cloud
of dust and sand triggered by T-storm outflow boundaries swept across
Tolleson, Arizona. Upper right: Loren Ziegler snapped a photo as the
rolling cloud of sand pushed into metro Phoenix.
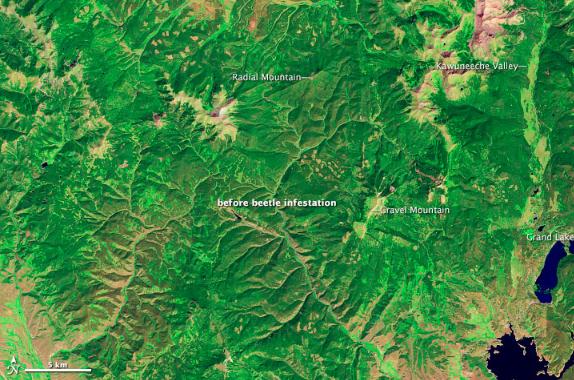
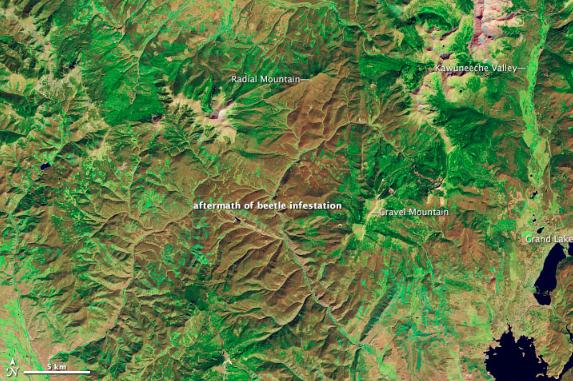
Beetle Invasion From Space. Milder winters have
allowed bark beetles to survive, and decimate millions of acres of
forestland out west; here's an excerpt of a story from
NASA's Earth Observatory: "
A single pine bark beetle
is about the size of a grain of rice. But when the beetle population
swells, it can have a major impact on forest health. And that’s exactly
what has been happening across the Rocky Mountains over the past
decade. In Colorado, severe beetle infestations showed up in lodgepole
pine forests about 50 miles west of Boulder and Fort Collins around
2000. Over time, the affected area grew so that by 2011 the infestation
had spread east to ponderosa pine forests that were much closer to the
two cities. (A map showing the progression between 1998 and 2011 is available here). The beetle epidemic caused so many trees to die-off that the impacts are visible from space. The Thematic Mapper on Landsat 5 acquired these images of lodgepole pine forests near Grand Lake, Colorado on September 11, 2005, and September 28, 2011—before and after a severe infestation led to die-off of the tree canopy."
"Ask Paul". Weather-related questions, rants and assorted threats:
Paul,
"A couple of days ago, you mentioned that you expected highs in the
low 70s by the end of next week. Now you're predicting 90s! What's
responsible for the huge swing in the forecast? Is it beyond reason to
hope for an early end to this summer from hell? Those of use without air
conditioning are really suffering."
Jack Delehanty
Minneapolis
Jack - I tried to answer your
question in Sunday's print weather column. It won't come as much of a
shock when I tell you that long-range forecasting is more art than
science. I based my cooler forecast (for next weekend) on the ECMWF
(European) model, which has been doing a pretty good job in recent
months, better than most of the U.S. models - but still not perfect.
This just in: there will never be a "perfect" long range forecast. As
new data comes in the forecast changes, new data initializing the
weather models 4 times/day. Maddening? Yes, but look for trends over
time - are the models getting wetter, drier, warmer or cooler over time?
Is there general agreement among (all) models are is the meteorologist
going out on a limb with one specific model?
I believe the worst of the heat is
behind us now. We will see more 90-degree days, probably another 8-12 by
late September, but the odds of 100-degree heat are dropping now with
each passing day. The heat wave anchored over Kansas City has been
remarkably persistent for 6 weeks now, but it's showing signs of
shrinking and shifting south in early August. The boundary separating
blast-furnace heat from cool, Canadian air is slowly migrating south
over time, and I stand by the forecast - I
still think we'll see some temporary relief from the 90s by next
weekend; maybe a couple days in the upper 70s and low 80s next Saturday
and Sunday before heating up (again) next week.
Why The London Olympics Is The First Real-Time Games.
You have to give NBC Universal credit for taking a calculated risk
(making all the events available in real-time on the web - not saving
everything for taped, after-the-fact broadcast in prime time hours
later. Here's an excerpt from
mashable.com: "
Whether London 2012 is the first “social” Games has sparked much debate in news media and on the social web. While compelling arguments
have been made for both sides, social media’s role in the Olympics
isn’t the most exciting conversation about this year’s competition. It’s
about timing. The London 2012 Olympics are undoubtedly the first
real-time Games. It differs from any other Olympic event in how fans
and viewers can experience all competitions while they’re taking place.
Though Friday’s Opening Ceremonies weren’t broadcast live in the United States, all 32 sporting events will be live streamed for the first time ever."
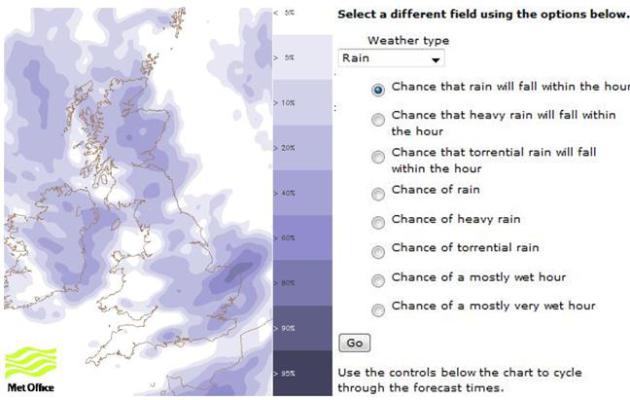
UK Ensemble Olympic Showcase. The
U.K. Met Office
has created some special high-res models and graphics showing
hour-by-hour rain chances for the Olympic Games in London. More details:
"
An animated probabilistic rainfall forecast. The forecast spans a
30 hour period and is divided into hourly steps. Each frame shows the
chance that rain (greater than 0.2 mm/h) will fall sometime within a
1 hour time window displayed on the image. No information is provided
on the duration of rainfall — it could last for the full hour or just a
few minutes. The product giving the chance of more than 30 minutes of
rain in an hour should be used to find out if it is likely to be
mostly wet or not."
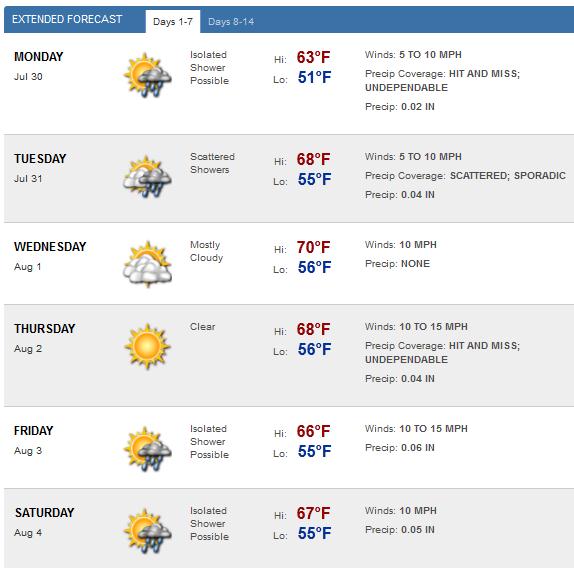
Olympics Weather: Cool & Soggy. Click here
to see the latest extended forecast for London from Ham Weather. Highs
will be in the 60s through Friday with frequent showers, possible
thunder. Typical weather for Great Britain.
Want To Save Money? Move Downtown. It may be counterintuitive, but there's some sound logic to this. Here's an excerpt from smartmoney.com: "If
you want to save money these days, you have to move into the city.
Crazy, but true. No wonder McKinsey & Co., the strategy consultant,
recently produced a report predicting a new golden age for the American
city. When I was growing up, the story of the American city was a sad
one. The middle class had fled to the suburbs. Downtown was dying. But
based on my math, people are going to be moving back. Why? Three
reasons: Interest rates. Gas prices. And the Internet. Let me explain."
17 Funniest Descriptions Of Interview Subjects The News Has Ever Broadcast.
Yes, these Chyron fonts (character generators) actually showed up on
the Boob Tube, during local TV newscasts. If you need a laugh click over
to
funnyordie.com.
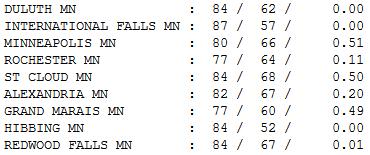
Wet Start, Fine Finish. Morning clouds and half an
inch of rain Sunday morning gave way to clearing by afternoon, but some
of the sun's energy went into evaporating soil moisture, instead of
heating up the air, limiting MSP to a high of 80, while St. Cloud (which
saw skies clear faster) zoomed up to 84, 87 reported at International
Falls.
Paul's Conservation Minnesota Outlook for the Twin Cities and all of Minnesota:
TODAY: Hot sun, breezy. Dew point: 65. Winds: W/NW 15+ High: 92
MONDAY NIGHT: Clear, a bit more comfortable. Low: 68
TUESDAY: Sunny, little wind. Less humid. Dew point: 60. High: near 90
WEDNESDAY: Hot sun, T-storms rumble in late. Dew point: 64. Low: 70. High: 94
THURSDAY: Sticky, stray T-storm. Dew point: 66. Low: 71. High: 89
FRIDAY: Sunny start, PM storms. Dew point: 68. Low: 72. High: 91
SATURDAY: Wet start. Breezy as skies clear, turning cooler. Dew point: 61. Low: 68. High: 83
SUNDAY: Sunny, less humid. Dew point: 56 (!) Low: 62. High: near 80 (70s up north).
* long range models are hinting at low to mid 90s returning to MSP the first half of next week.
Soggy Medals
My favorite Olympic events? Umbrella-Wrestling
and Synchronized Puddle-Jumping. Track and Field participants may need
fins & scuba gear as skies over London unload torrents of cool,
ill-timed rain.
My earnest suggestion is still falling on deaf,
IOC ears. "Every Olympic event should include one fan pulled from the
stands, to provide some perspective."
I'd watch that.
Shocking news: a nearly perpetual heat wave
centered over Kansas City expands north again this week, although it
won't be as withering as previous hot spells. T-storms flare up late
Wednesday, and linger into early Saturday, when slightly cooler air
pushes south.
Yes 80-85 F now qualifies as "relief".
The fairly reliable ECMWF model shows another run of mid-90s next week; NOAA CPC predicts a warmer-than-average August.
We've always had heat waves, drought &
downpours. But there's a growing body of evidence that these extremes
are becoming more extreme; coming more frequently.
Today's climate stories (below) include a new
study from former climate skeptic, Richard Muller. The great irony:
Koch-money funded the research, which essentially confirms what climate
scientists predicted 30 years ago.
It's a Homer Simpson moment.
Doh.
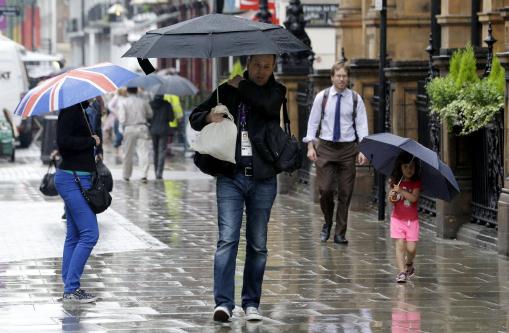
Photo credit above: "People walk with
umbrellas near Russell Square during a wet morning, Friday, July 27,
2012, in London. The city is hosting 2012 Summer Olympics with opening
ceremonies on Friday." (AP Photo/Julio Cortez)
Climate Stories...
Climate Change Study Forces Skeptical Scientists To Change Minds. More on the Muller "conversion" and the latest "BEST" results from
The Guardian; here's an excerpt: "
The
Earth's land has warmed by 1.5C over the past 250 years and "humans
are almost entirely the cause", according to a scientific study set up
to address climate change sceptics' concerns about whether human-induced global warming is occurring. Prof Richard Muller, a physicist and climate change sceptic who founded the Berkeley Earth Surface Temperature (Best)
project, said he was surprised by the findings. "We were not expecting
this, but as scientists, it is our duty to let the evidence change our
minds." He added that he now considers himself a "converted sceptic"
and his views had undergone a "total turnaround" in a short space of
time."
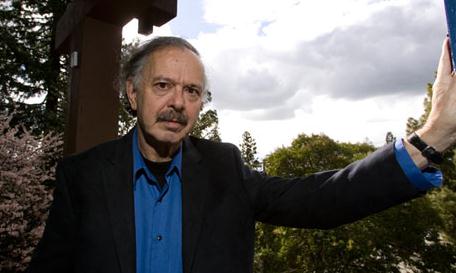
Photo credit above: "
Prof Richard Muller considers himself a converted sceptic following the study's surprise results." Photograph: Dan Tuffs for the Guardian.
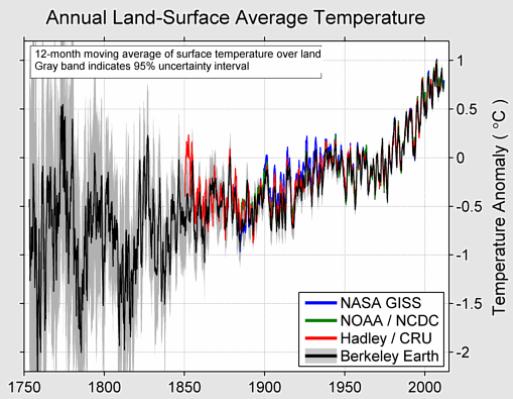
Berkeley Earth Surface Temperature Results. This new
reanalysis of surface stations incorporated 1.6 billion temperature
records from 16 preexisting data archives. More details from the
Berkeley site: "
Berkeley
Earth has just released analysis of land-surface temperature records
going back 250 years, about 100 years further than previous studies.
The analysis shows that the rise in average world land temperature
globe is approximately 1.5 degrees C in the past 250 years, and about
0.9 degrees in the past 50 years."
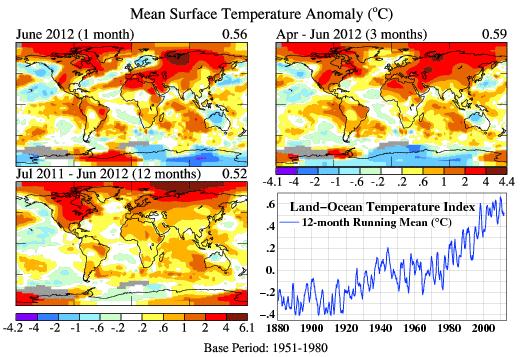
Global Temperature Trends. North Ameria is frying
this summer, but the U.K. is experiencing one of the coolest summers in
decades. Keeping a global perspective is challenging, but essential.
Here is more information from
Columbia University: "
(Above)
are maps of the mean surface temperature anomaly for the past month,
the past three months, and the past 12 months. Regional weather
patterns, apparent on the monthly time scale, tend to disappear in
averages over longer time scales. In the chart in the lower right we
show the 12-month running means of the global land-ocean temperature
anomalies."
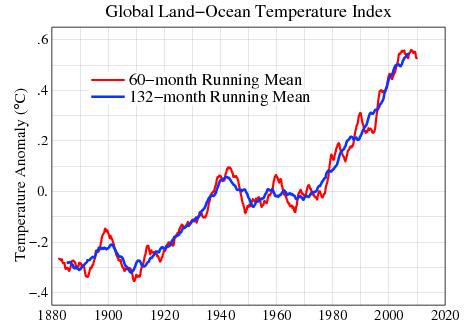
No, Warming "Didnt' Stop In 1998". Map above from
Columbia University: "
The
figure (above) shows 60-month (5-year) and 132-month (11-year to
minimize the effect of the solar cycle) running means of the surface
temperature deviation from the 1951-1980 mean. This graph makes clear
that global warming is continuing — it did not stop in 1998. The year
1998 was remarkably warm relative to the underlying trend line (see updated Figure 12 of "Storms"), in association with the El Nino" of the century (updated Figure 13).
But the underlying global temperature has continued to rise, despite
the fact that solar irradiance for the past few years has been stuck in
the deepest solar minimum in the period of satellite data (updated Figure 11)."
"Our Summer Of Climate Truth". Here's an excerpt of a
post from Dr. Jeffrey D. Sachs, economics professor and Director of the
Earth Institute at Columbia University, at
madison.com: "...
The
past couple of years have brought a shocking number of extreme events
all over the planet. In many cases, short-run natural factors rather
than human activity played a role. During 2011, for example, La Niña
conditions prevailed in the Pacific Ocean. This means that especially
warm water was concentrated near Southeast Asia while colder water was
concentrated near Peru. This temporary condition caused many short-term
changes in rainfall and temperature patterns, leading, for example, to
heavy floods in Thailand. Yet, even after carefully controlling for
such natural year-to-year shifts, scientists are also finding that
several recent disasters likely reflect human-caused climate change as
well. For example, human-caused warming of the Indian Ocean probably
played a role in the 2011 severe drought in the Horn of Africa. The
current U.S. mega-drought probably reflects a mix of natural causes,
including La Niña, and a massive heat wave intensified by human-caused
climate change."
New Global Temperature Reanalysis Confirms Warming; Blames CO2. Here's an excerpt of an Op-Ed from a (former) climate skeptic, Richard Muller at
The New York Times "
Richard
Muller, the head of the Berkeley Earth Surface Temperature project,
will publish an op/ed next week in the New York Times summarizing his
group's findings with regard to global temperature trends. From a copy
of the op/ed, Converted Skeptic, circulating on the web: CALL me a
converted skeptic. Three years ago I identified scientific issues that,
in my mind, threw doubt on the very existence of global warming. Now,
after organizing an intensive research effort involving a dozen
scientists, I’ve concluded that global warming is real, that the prior
estimates of the rate were correct, and that cause is human."
* Another perspective on the Muller findings from the L.A. Times
here.
Bombshell: Koch-Funded Study Finds "Global Warming Is Real", "On The High End" And "Essentially All" Due To Carbon Pollution. An excerpt from Joe Romm at
Think Progress: "...
Yes,
yes, I know, the finding itself is “dog bites man.” What makes this
“man bites dog” is that Muller has been a skeptic of climate science,
and the single biggest funder of this study is the “Charles G. Koch Charitable Foundation ($150,000).” The Kochs are the leading funder of climate disinformation in the world!
It gets better:
Our results show that the average temperature of the earth’s
land has risen by two and a half degrees Fahrenheit over the past 250
years, including an increase of one and a half degrees over the most
recent 50 years. Moreover, it appears likely that essentially all of this increase results from the human emission of greenhouse gases.
These findings are stronger than those of the
Intergovernmental Panel on Climate Change, the United Nations group
that defines the scientific and diplomatic consensus on global warming."
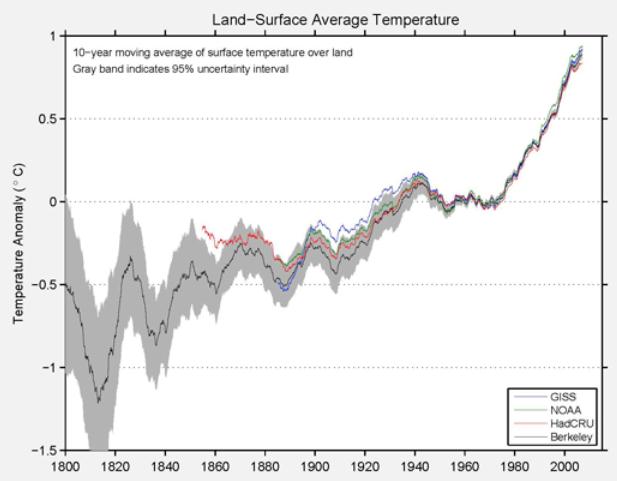
Graphic credit above: "The decadal land-surface average
temperature using a 10-year moving average of surface temperatures over
land. Anomalies are relative to the Jan 1950 – December 1979 mean. The
grey band indicates 95% statistical and spatial uncertainty interval.”
A Koch-funded reanalysis of 1.6 billion temperature reports finds that
“essentially all of this increase results from the human emission of
greenhouse gases.”
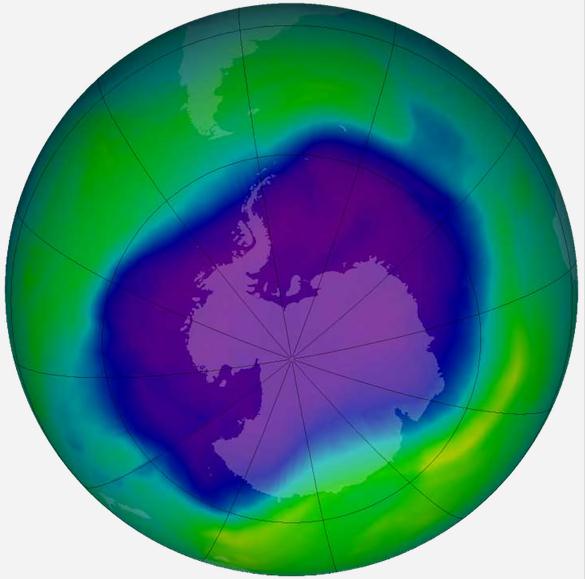
Climate Change Could Erode Ozone Layer Over U.S. Here's an excerpt from a blog at
smithsonian.com: "
For
the past 25 years, it seemed that we’d pretty much solved the ozone
problem. In the 1970s and 80s, people around the world grew
increasingly alarmed as research revealed that chemicals we were
producing—such as CFCs, used in refrigeration— had started destroying
the crucial ozone layer, high up in the atmopshere, that protects us
from the sun’s harmful UV radiation. In response, world governments came
together to sign the Montreal Protocol in
1987, which phased out the production of ozone-depleting chemicals.
The concentration of these chemicals in the atmosphere leveled off
within a decade. Yesterday, though, Harvard scientists hit us with some
bad news: It looks as if climate change could actually cause the
depletion of the ozone layer to resume on a wide scale, with grim
implications for the United States."
Image credit above: "
Climate change could produce an ozone hole over the U.S. similar to the one observed over Antarctica, above, in 2006." Image via NASA.
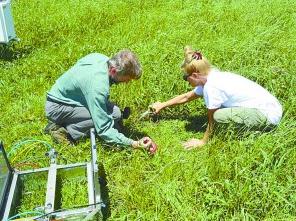
Following The Isotopes Leads Scientists To Useful Climate Change Data. Here's a snippet of an article at
The Prairie Star: "
Rebecca
Phillips is working this summer in the blooming alfalfa fields at the
ARS-Northern Great Plains Research Laboratory south of Mandan, N.D.,
measuring trace gases that have been associated with climate change.
The ARS plant physiologist has been conducting this work for the past
few years and has collected useful data for producers. Phillips said her
goal in studying these gases is to give producers information on how
they can be productive and profitable using the best conservation
management practices that reduce gas emissions."
Photo credit above: "
Rebecca Phillips, plant pathologist
at ARS-Northern Great Plains Research Laboratory, works out in the
fields in Australia studying carbon fluxes with other scientists."
Readers Jump Into The Climate Fray. Here's an excerpt from an interesting article at
The New York Times
(focused on reader response to a series of recent NYT article on
climate change posing new risks to aging infrastructure and how extreme
storms and higher water vapor levels may be impacting Earth's ozone
layer): "...
Other readers e-mailed directly with their thoughts.
Rick Eisenstat, a former Navy officer, weighed in on the question of
whether climate change presents a real and present danger to the United
States and the world. “In fact,” Mr. Eisenstat wrote, “the military
has already answered that it is. This determination is often absent
from the national debate but the impact it can have on it — and the
country at large — is significant.” He said the American military was
leading the way in energy conservation efforts to save money and reduce
threats to supply lines. These efforts are having a significant impact
on greenhouse gas emissions, said Mr. Eisenstat, now a law student at
Tulane University."

 5-Day Rainfall Outlook.
The drought continues to worsen over the Central Plains; little rain
expected through Saturday of this week. Monsoon rains soak Arizona,
heavy showers and T-storms over the southeastern USA, the approach of
slightly cooler air sparking some 1/2 to 2" amounts over the Upper
Midwest by late week. Map: NOAA HPC.






No comments:
Post a Comment