36 F. high in the Twin Cities Wednesday.
34 F. average high for November 27.
39 F. high on November 27, 2011.
40s by Saturday.
50s expected Monday (slight chance of a T-shower). Go figure.
Amazing Grace
The Lord is my shepherd; I shall not want.
The measure of a person isn't what they have, but what they give, right?
My mom passed away yesterday. I wish you could
have known her. Grace was a force of nature. She grew up dirt-poor, in a
tent, during The Depression. She raised 3 kids, went on to become a
prolific antiques dealer. She taught us the most important lesson:
family comes first. "Do the right thing ... never give up" she'd say
with a stern smile. I was in awe of her. I still am. Todd Nelson will be
filling in while I'm with family.
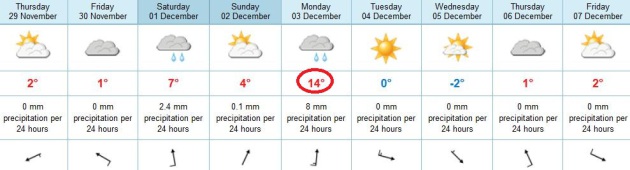
The weather map is mercifully quiet. Roughly 3
weeks from the Winter Solstice it seems odd to be tracking rain; drizzle
Saturday, a few heavier showers and T-showers Monday.
Expect highs from 45-50 F. over the weekend, then well into the 50s on Monday, before cooling down by midweek.
We thaw out late next week, but colder air
building over Canada arrives by the second week of December. Any snow by
mid-month will come in dribs & drabs; still no sign of The Big One.
I'll keep searching.
My loss hasn't hit me yet. A word to the wise:
take no one for granted. Do the right thing. Never give up. And give mom
extra hugs.
Do it today.
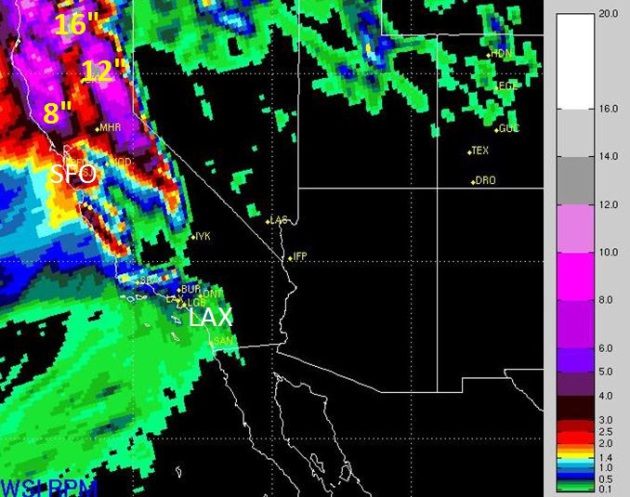
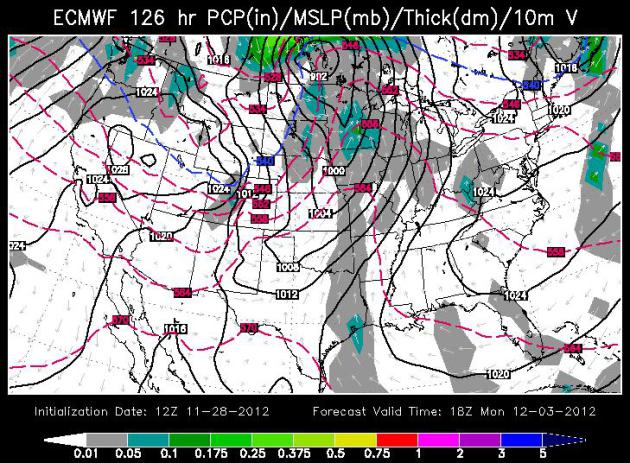
Staggering Precipitation Amounts. WSI's
high-resolution (12 kilometer) RPM model prints out about 4-5" for San
Francisco and Portland, Oregon, but as much as 16-20" of precipitation
for northern California. That's 1-2 hurricane's worth of moisture, which
may translate into some 150-200" snowfall amounts for the Cascade and
Sierra Range. If this forecast verifies some areas of the west will
experience historic river flooding and an extreme avalanche risk.
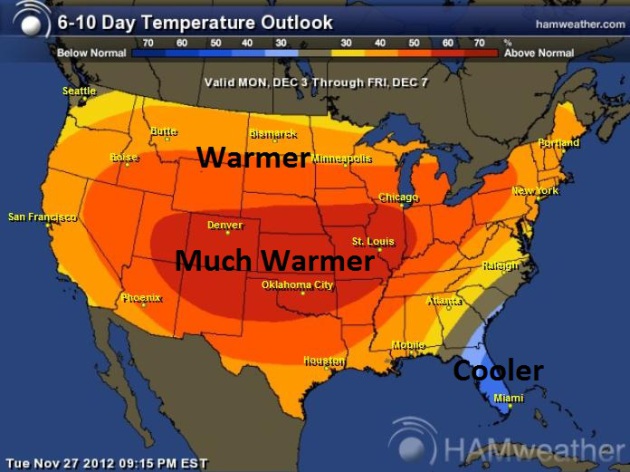
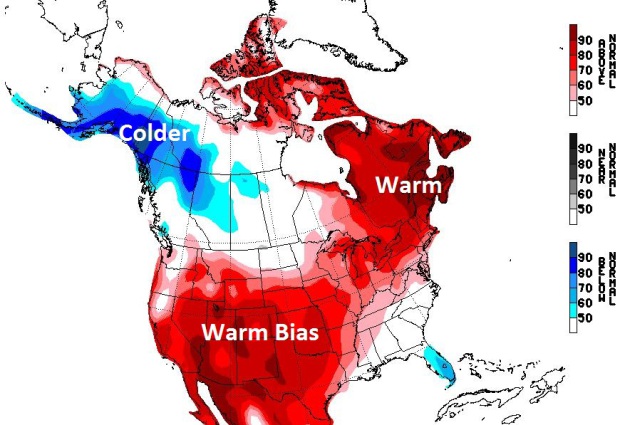
December On Hold. The 6-10 day temperature trends
show temperatures well above average across most of the USA, thanks to a
persistent wind flow from the Pacific - Canadian air temporarily
bottled up in Canada. Map above: NOAA CPC and Ham Weather.
Zonal Flow. Typical for late September or
mid-October, a (persistent - vigorous) west to east wind flow from the
Pacific is a bit more unusual heading into the first week of December.
The NOAA animation above shows 500 mb winds (18,000 feet) thru Saturday.
Above Average. The first full week of December may
bring highs consistently above freezing, in fact most of the days will
probably feature highs in the 40s. 50+ F. highs are possible Monday,
again late next week, based on latest ECMWF guidance.
NAEFS Guidance. Experimental long-range guidance for
December 5 - 11 shows a continuing block, keeping Alaska bitter, with
mild Pacific winds pumping 40s, 50s and 60s into the Lower 48 states.
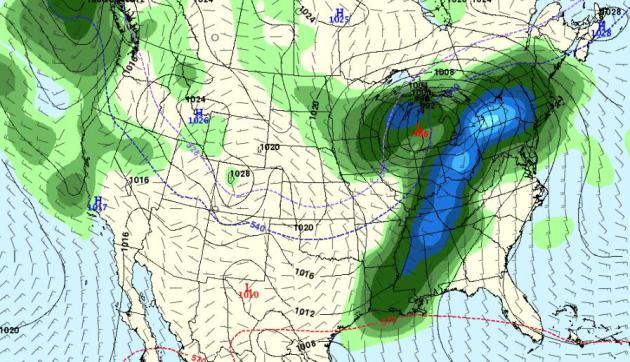
Monday: Hints of Early April? A strong warm front
may spark showers, even a stray T-shower Monday. South of the warm
frontal boundary highs may reach the 60s in Iowa and Nebraska, 50s into
southern Minnesota. Slightly cooler weather returns Tuesday, but
temperatures recover into the 40s and 50s again by late next week as
Pacific air continues to overwhelm the Lower 48. Map above: WSI.
Temperature Readjustment? The long-range 16-day GFS
shows significantly colder air returning by December 12-13, a storm
tracking just south and east of Minnesota capable of triggering some
accumulating snow. My confidence level is still low, but it sounds right
- with a sun angle as low as it is in mid-January it can't stay in the
40s and 50s much for an extended period, at least not in December.
Flu Outbreaks Predicted With Weather Forecasting Techniques.
Outbreaks of flu tend to follow specific weather patterns - which is
interesting. Predict the weather (accurately) and maybe you can predict
when you'll come down with the crud? Lovely. Details from
UCAR: "...
In
previous work, Shaman and colleagues had found that wintertime U.S.
flu epidemics tended to occur following very dry weather. Using a
prediction model that incorporates this finding, Shaman and co-author
Alicia Karspeck, an NCAR scientist, used Web-based estimates of
flu-related sickness from the winters of 2003–04 to 2008–09 in New York
City to retrospectively generate weekly flu forecasts. They found that
the technique could predict the peak timing of the outbreak more than
seven weeks in advance of the actual peak. “Analogous to weather
prediction, this system can potentially be used to estimate the
probability of regional outbreaks of the flu several weeks in advance,”
Karspeck says. “One exciting element of this work is that we've
applied quantitative forecasting techniques developed within the
geosciences community to the challenge of real-time infectious disease
prediction. This has been a tremendously fruitful cross-disciplinary
collaboration.”
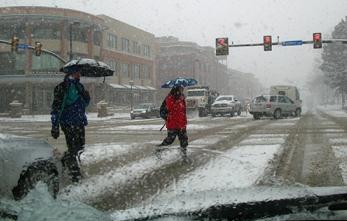
Photo credit above: "Pedestrians
contend with wintry weather in Boulder, Colorado. As flu outbreaks peak
during the colder months, researchers are employing techniques from
weather prediction to forecast outbreak timing and severity." UCAR. Photo by Carlye Calvin.
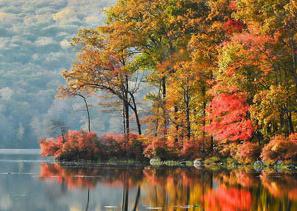
Trees Are Shedding Leaves Later Than Usual. Here's a clip from
EarthSky.org: "
Scientists
examined changes in the growing season over the Northern Hemisphere
during 1982 to 2008 and found that end of the growing season has
shifted to later in the year. Scientists regard changes in the growing
season as an important indicator of the response of terrestrial
ecosystems to climate change. The results of the research were published in the July 2011 issue of the journal Global Change Biology and were further reviewed by
Climate Central on October 17, 2012. To measure the length of the
growing season, scientists used NDVI (normalized difference vegetation
index) data collected by satellites to estimate the “greenness” of
vegetation growing across the Northern Hemisphere during 1982 to 2008.
The NDVI calculates how much visible light is absorbed by vegetation.
Healthy vegetation absorbs most visible light..."
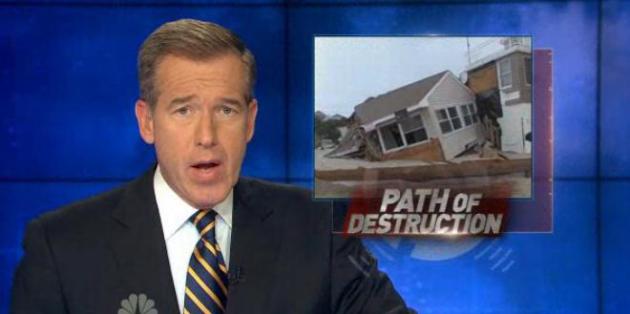
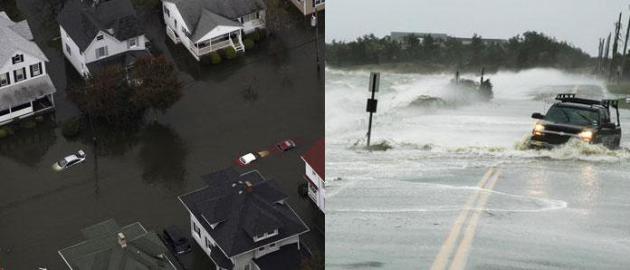
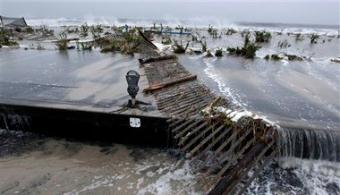
Sandy Damage Rivals Katrina. Sandy wasn't as intense
as Katrina, but it was 3 times larger, impacting an area 900 miles wide
with tropical storm force winds or stronger. And it came ashore over a
very heavily populated part of the USA. My hunch: Sandy will wind up
costing over $100 billion.
NBC News has more details: "
Although
Hurricane Katrina took more lives when it hit the Gulf Coast, the
economic and housing damage brought by Hurricane Sandy was much larger
with losses already topping $71 billion. NBC's Katy Tur reports."
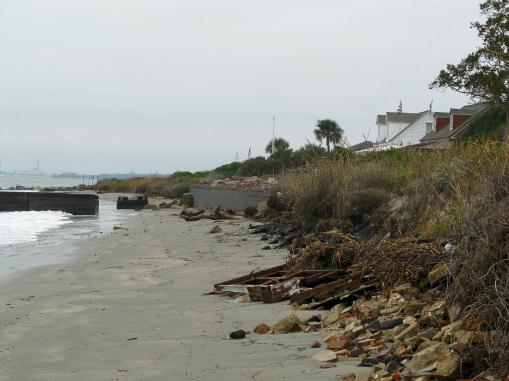
Seas Rising Faster Than Projected, Low Areas Threatened.
What, scientists were actually conservative with their estimates? But
let's keep ignoring the elephant in the dining room (or in this case, on
the coast).
Reuters has the story; here's an excerpt: "
Sea
levels are rising 60 percent faster than U.N. projections, threatening
low-lying areas from Miami to the Maldives, a study said on Wednesday.
The report, issued during U.N. talks in Qatar on combating climate
change, also said temperatures were creeping higher in line with U.N.
scenarios, rejecting hopes the rate had been exaggerated. "Global
warming has not slowed down, (nor is it) lagging behind the
projections," said Stefan Rahmstorf, lead author at the Potsdam
Institute for Climate Impact Research that compared U.N. projections to
what has actually happened from the early 1990s to 2011..."
Photo credit : "
Erosion caused by high water is seen along
the beach on Sullivans Island, S.C., in this photograph made on
Wednesday, Nov. 14, 2012. Scientists at Clemson University and Georgia
Tech have proposed it could be possible to raise the coastline during
an era of sea level rise by injecting sediment-laden slurry into
fractures beneath the earth's surface." (AP Photo/Bruce Smith).
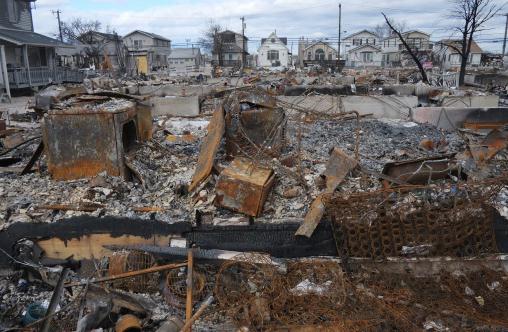
In Sandy's Wake, Lessons About Fire Safety More Relevant Than Ever. I know it's counterintuitive (during a flooding storm surge), but fire was a huge hazard with Sandy. More details from
Benzinga: "...
Many
people still keep traditional candles as part of their hurricane or
disaster preparedness kit. But these candles can create extra hazards if
left unattended, even for a short time. In some cases, homeowners fall
asleep with a candle burning and wake up to find the house burning
around them. Battery operated candles are a much safer alternative and
can also last much longer than regular candles..."
Photo credit above: "The ruins of burned out
homes are framed by surviving buildings in the Breezy Point section
of the Queens borough of New York, Saturday, Nov. 24, 2012. A fire
destroyed more than 100 homes in the oceanfront community during the
storm." (AP Photo/Mark Lennihan)
Turning To The Cloud In A Disaster. With Sandy I saw
a number of people fleeing with photo albums and thumbdrives, even some
lugging home computers filled with family memories. It was a reminder
(to me) to back stuff up, the things that can't be replaced (like family
photos and videos). The cloud is one good option, as
Cisco explains: "
Two
weeks after Hurricane Sandy barreled up the East Coast, devastating
parts of densely populated New York and New Jersey, the full costs of
the megastorm are still being assessed. The "once-a-century" storm left
more than 8 million homes and businesses without power, shutting down
everything from oil refineries to transportation to the stock market.
The disruption could shave a half percentage point off of GDP. Behind
those statistics are millions of businesses, big and small, grappling
with new questions disaster preparedness in an age of extreme weather.
And, increasingly, they are concluding that the answers may lie in the
cloud..."
"Ask Paul". Weather-related Q&A:
Last year it was a brown Christmas and that happens from time to time. When was the last time we had 2 brown Christmas in a row?
Mike
Chanhassen, MN
Mike - I asked my friend and contact at the
Minnesota Climatology Working Group, Pete Boulay, about your question
and here is his response: "The last time there was an inch of snow
or less on the ground for two years in a row was Christmas 1976 and
1977. It also happened in 1957 and 1958 and 43-44, 30-31, 22-23, and there was a three years in a row from 1904-06."
California City Building "Tsunami-Resistant" Port. Insurancejournal.com has the story; here's an excerpt: "...
Port
officials are hoping that tsunami is among the last of many that have
forced major repairs in Crescent City, a tiny commercial fishing
village on California’s rugged northern coast. Officials are spending
$54 million to build the West Coast’s first harbor able to withstand the
kind of tsunami expected to hit once every 50 years – the same kind
that hit in 2011, when the highest surge in the boat basin measured 8.1
feet (2.5 meters) and currents were estimated at 22 feet (6.7 meters)
per second. Officials are building 244 new steel pilings that will be 30
inches (76 centimeters) in diameter and 70 feet (21 meters) long.
Thirty feet (9 meters) or more will be sunk into bedrock. The dock
nearest the entrance will be 16 feet (5 meters) long and 8 feet (2.4
meters) deep to dampen incoming waves. The pilings will extend 18 feet
(5.5 meters) above the water so that surges 7 1/2 feet (2.3 meters) up
and 7 1/2 feet down will not rip docks loose..."
Image above: NOAA.
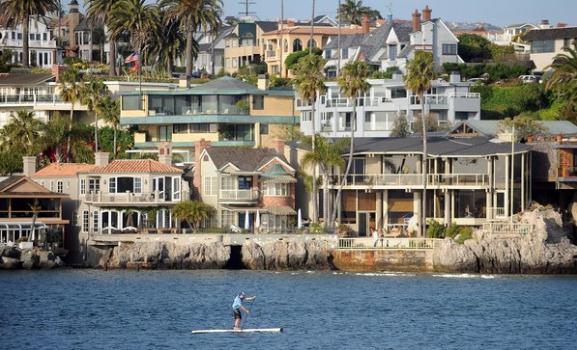
California Confronts A Sea Change. The story from
The Los Angeles Times; here's the introduction: "
Governors Andrew Cuomo of New York and Chris Christie
of New Jersey don't need to wait on gridlocked Washington to confront
future risks from climate-change intensified storms. They can instead
look at how California is already moving forward on common-sense
adaptations, and do it themselves. With 3.5 million Californians living
within three feet of sea level, and the best available science
projecting a 3- to 5-foot rise in sea level for the state by 2100, doing
nothing would be irresponsible. In Northern California, rising sea
levels are projected to affect more than a quarter of a million people
and threaten more than $60 billion in infrastructure in the San
Francisco Bay/Delta region, putting power stations, water-treatment
plants, roads, buildings and the San Francisco and Oakland airports
(both built on filled wetlands) at risk. In Southern California,
scientists point to the loss of 3,000 beachfront homes to major El Niño
winter storms in the 1980s as suggestive of what climate change has in
store..."
Photo credit above: "
In Newport Beach in Southern
California, city planners are looking into raising sea walls in
waterfront neighborhoods like Balboa Island that are prone to flooding."
(Los Angeles Times)
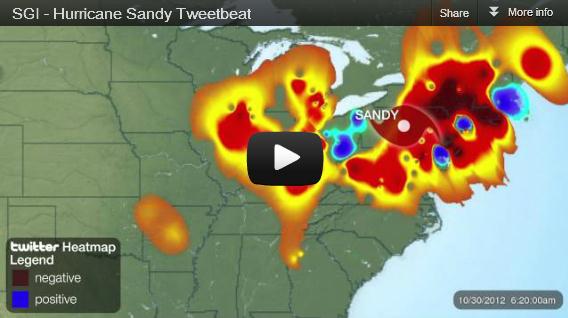
SGI Twitter Heat Map: Supercomputer Show Where The Angriest Tweeters Live.
This is pretty cool, in a depressing sort of way. Silicon Graphics
supercomputers can map, in real-time, where happy vs. angry tweets are
sent from, worldwide. Here is a
Huffington Post story showing how SGI leveraged this new technology tracking tweets during Superstorm Sandy: "...
The
Global Twitter Heartbeat tracks about 10 percent of the 500 million
tweets posted daily -- that's approximately 50 million posts analyzed
each day. Thus far, SGI has created heat maps illustrating people's
feelings on Twitter about Hurricane Sandy and the 2012 election night. To see the project in action, watch the clip below, showing how U.S. tweets were affected as the so-called "Frankenstorm" barreled up the East Coast in late October. (Red patches represent negative sentiments. Blue patches are positive.)"
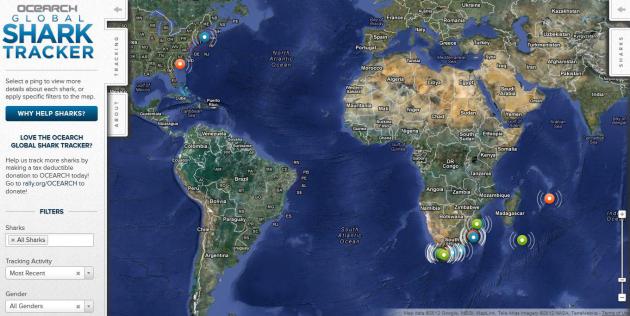
Ocearch Global Shark Tracker. No weather to track? No worries! Now you can track sharks, in near-real-time. Crazy, but check out
this link. Happy to see Lake Mille Lacs and Superior are (still!) shark-free. Yep, you can find just about anything online.
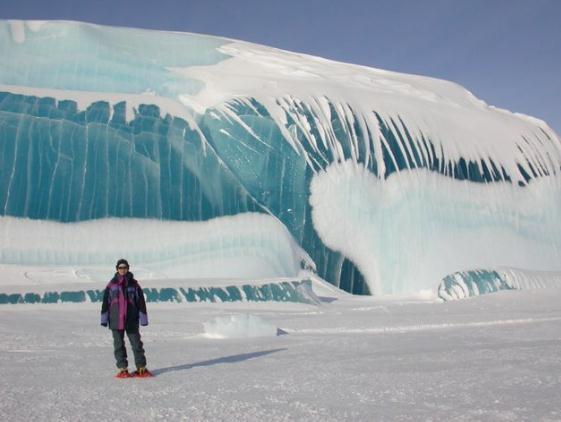
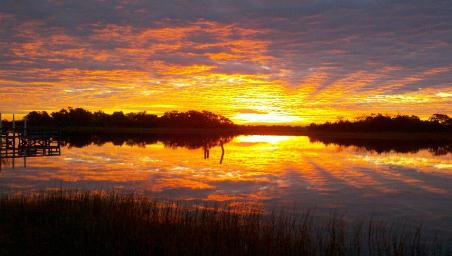
Rolling Blue Waves Hit The Antarctic Coastline. What created this amazing photo? Details via
Yahoo: "
These
brilliant blue beauties, which look like tidal waves frozen at their
highest point, were captured by French astrophysicist (and part-time
photographer) Tony Travouillon as he travelled across Antarctica."
Photo credit: "
Don't expect to see surfboards - or
snowboards - on these majestic frozen outcroppings near the Dumont
D'Urville research station in Antarctica." Photo by
Tony Travouillon.
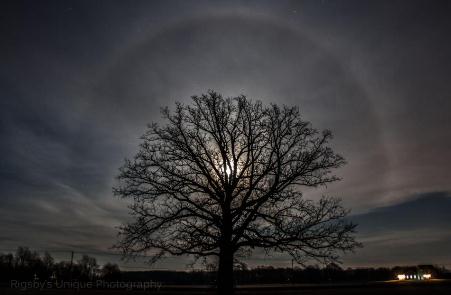
Ring Around The Moon. Here's a great example of the
22 degree halo, white moonlight being refracted (bent) by ice crystals
in cirrus clouds 25,000 feet above the ground. Details via Aaron Rigsby
and
WeatherNation TV.
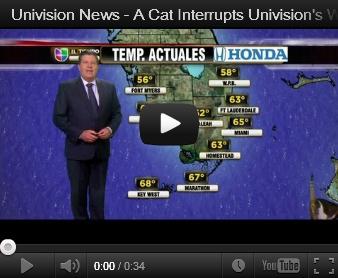
Cat Interrupts Univision Weather Report. This is
pretty funny - the forecast calls for...cats? Note how cool the
weatherguy is - I'm amazed he didn't crack up? Must be a dog-lover.
Details via
YouTube: "
There
are several cats that have turned the Univision parking lot into their
home and sometimes they make it into the studio. This cat just walked
right through the weatherman's report. Follow us @UnivisionNews."
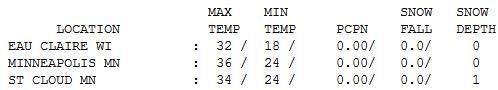
Flirting With Average. With a mix of clouds and
sunshine temperatures were within a whisker of average yesterday,
ranging from 32 at Eau Claire to 34 St. Cloud, 36 Twin Cities and a
balmy 41 at Redwood Falls.
November 28 in Minnesota Weather History. Information courtesy of the
MPX office of the NWS:
1991: Parts of central Minnesota received heavy snow including a record 16 inches of snow in New Ulm.
1835: 11 below zero at Ft. Snelling.
Paul's Conservation Minnesota Outlook for the Twin Cities and all of Minnesota:
TODAY: Mix of clouds and sun, seasonably cool. Winds: NE 10. High: 36
THURSDAY NIGHT: Patchy clouds, near-normal. Low: 25
FRIDAY: Partly sunny. Good travel weather. Low: 29. High: 38
SATURDAY: Clouds thicken. A little rain or drizzle. Low: 30. High: 45
SUNDAY: Intervals of sun, above average. Low: 33. High: 47
MONDAY Unseasonably mild. Showers, clap of thunder? Low: 35. High: 54 (60 over far southern MN?)
TUESDAY: Mostly cloudy, colder wind kicks in. Low: 31. High: 37
WEDNESDAY: Bright sun, less wind. Low: 18. High: 33
* Highs should top 40 again by the end of next week.
Climate Stories...
What Role Did Climate Change Play In Superstorm Sandy? PropertyCasualty360.com attempts to connect the weather and climate dots; here's an excerpt: "
Superstorm
Sandy, a “perfect storm” that was caused by an unusual combination of
seasonal weather phenomena converging above the Northeast, has stirred
some conversation in the media about whether the storm was caused, or
made worse, by climate change. Scientists have long warned about the
risk of a deadly hurricane over the Tri-State area, which would suggest
Sandy could be an expected weather event. But recent studies,
including a report
co-authored by MIT climate scientist Kerry Emanuel in February 2012,
note that climate change could combine with the effects of storm surge
to cause 100-year-flooding to occur every two decades in New York,
suggesting that an event like Sandy may be more than just a
long-expected storm..."
Photo credit above:
(AP Photo/Mel Evans)
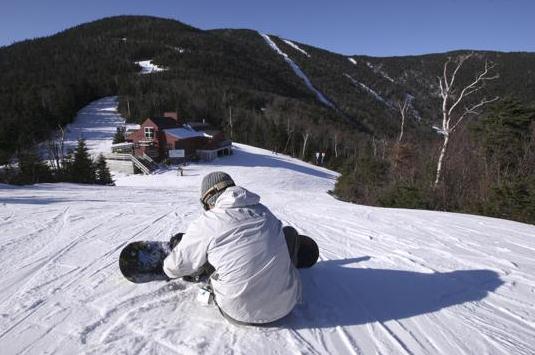
Climate Change Threat Looms Over Ski Industry. This
may be relevant to Minnesota and Wisconsin resorts as well, as snowfall
has become spotty and irregular in recent years - not the predictable
snow we saw in the 60s, 70s and early 80s.
The Boston Globe reports: "...
Snow
making will become even more important in the coming decades as New
England’s natural snowfalls diminish, according to Scott’s study.
Resorts are already spending millions of dollars to increase their
capacity — Stowe Mountain Resort in northern Vermont spent $4.7 million
this year alone — and by the 2020s, Vermont and New Hampshire resorts
may have to increase their snow making output by as much as 50 percent.
“Man-made snow is such an integral part of skiing on the East Coast,”
said Greg Kwasnik, spokesman for Loon Mountain Resort in Lincoln, N.H.
“People may not realize it, but man-made snow is what makes it all
possible.” But snow making also depends on the weather cooperating — the
temperature has to be in the low 20s or colder..."
Photo credit above: "
Jake Bartlett stepped into his snowboard at Sugarbush Mountain. Ski area operators have high hopes for the season." By Katie Johnston. Globe Staff
/ November 26, 2012
Melting Permafrost A New Peril In Global Warming: U.N.
The concern is methane - as permafrost melts methane is released, a
greenhouse gas 20 times more powerful than carbon dioxide. This causes
warming, which melts more permafrost, releasing more methane (etc etc).
This is one of several "positive feedbacks" climate scientists are
concerned about, as reported by
Reuters: "
Permafrost
lands across Siberia and Alaska that contain vast stores of carbon are
beginning to thaw, bringing with it the threat of a big increase in
global warming by 2100, a U.N. report said on Tuesday. A thaw of the vast areas of permanently frozen ground in Russia, Canada, China
and the United States also threatens local homes, roads, railways and
oil pipelines, the U.N. Environment Programme (UNEP) said in the report
which was released at the U.N. climate talks being held this week and
next in Qatar. "Permafrost has begun to thaw," Kevin Schaefer, lead author at the University of Colorado told a news conference in Doha..." Photo: NASA.
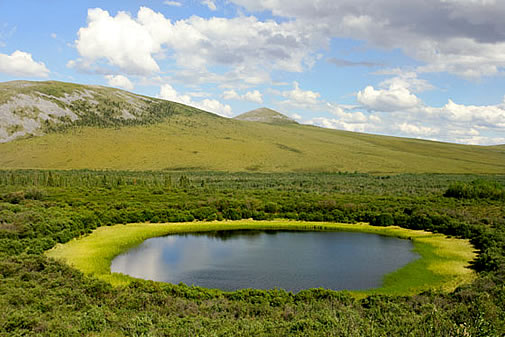
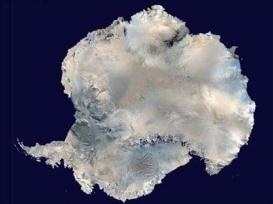
Researchers Head To Coldest Place On Earth For Global Warming Insight. The Olympian has the story - here's a clip: "...
For
almost a month, the group will sleep in tents and toil for up to 15
hours a day in converted shipping containers. Temperatures hover around
5 degrees Fahrenheit and 90 mph winds create massive snowdrifts and
whiteouts. The reason for enduring that misery would seem to be a
contradiction. Their work will provide crucial insight into global
warming. The NIU professors are researchers in a key part of a $10
million National Science Foundation project known as WISSARD, for
Whillans Ice Stream Subglacial Access Research Drilling. It's a
long-winded phrase for an effort aimed at studying ice sheet stability
and subglacial life in West Antarctica. That's an important region for
climate change. Scientific evidence indicates that relatively recent
instability in the Antarctic ice sheet, which covers the land, is
raising sea levels..."
Read more here: http://www.theolympian.com/2012/11/22/2329455/researchers-head-to-coldest-place.html#storylink=cpy
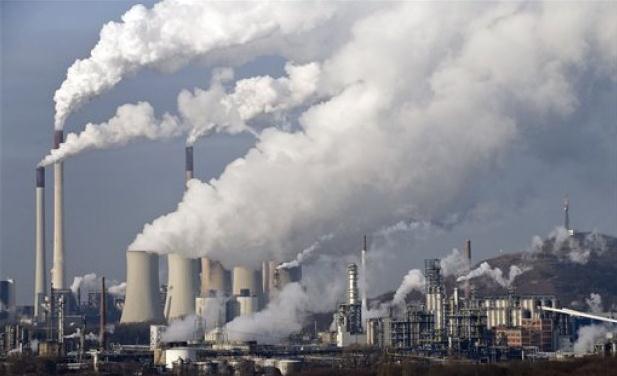
U.N. Report Warns Of Widening Climate Gap.
The Daily Herald has the story - here's the introduction: "
A
U.N. report on rising greenhouse gas emissions reminded world
governments Wednesday that their efforts to fight climate change are far
from enough to meet their stated goal of limiting global warming to 2
degrees Celsius (3.6 Fahrenheit). The report by the U.N. Environment
Program, released just days ahead of a major climate conference, said
the concentration of heat-trapping greenhouse gases like carbon dioxide
in the atmosphere is up about 20 percent since 2000. Scientists say
those emissions are contributing to climate change and that failure to
contain them could have dangerous consequences, including rising sea
levels inundating coastal cities, dramatic shifts in rainfall
disrupting agriculture and drinking water, the spread of diseases and
the extinction of species..."
Photo credit: "In this Dec.
16, 2009 file photo, steam and smoke rise from a coal burning power
plant in Gelsenkirchen, Germany. A United Nations report on rising
greenhouse gas emissions reminded world governments Wednesday, Nov. 21,
2012 that their efforts to fight climate change are far from enough to
meet their stated goal of limiting global warming to 2 degrees C (3.6
F)." (AP Photo/Martin Meissner, File)
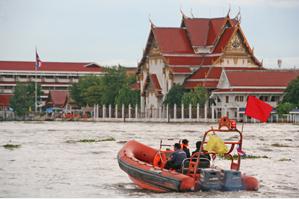
Climate Change: Natural Disasters Made History In 2011. The story from
irinnews.org; here's a clip: "
Many of the worst natural disasters of 2011 were also the most severe the affected countries had ever experienced, revealed the Global Climate Risk Index (CRI) 2013, which was released in Doha on 27 November. Brazil, Cambodia, El Salvador,Laos and Thailand appear
in the CRI’s 10 most-affected countries; all recorded their severest
natural hazards-related catastrophes in 2011. Floods and landslides
claimed the lives of more than 1,000 people and caused almost US$5
billion in direct losses in Brazil, said the index, which is produced
by the NGO Germanwatch. Thailand is listed as 2011’s most natural
disaster-affected country. The country experienced its worst flooding
ever that year, triggered by the landfall of Tropical Storm Nock-ten.
The flooding led to losses worth $43 billion, making it one of the most
costly natural disasters of the world..."
Photo credit above: "Thailand experienced its worst flooding in 2011." Photo: Shermaine Ho/IRIN.


No comments:
Post a Comment