17 F. high yesterday in the Twin Cities.
24 F. average high for January 23.
26 F. high on January 23, 2012.
2/10ths of an inch of snow fell on the metro early Wednesday morning.
1.6" snow so far in January, 7.6" less than normal, to date.
17.4" snow so far this winter. Average snowfall as of January 23: 31"
Thaw possible Sunday, likely by Monday.
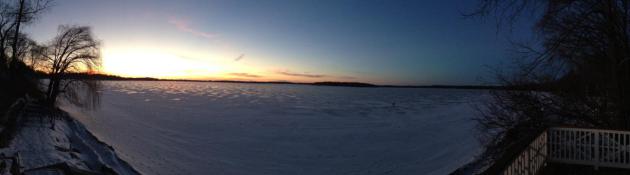
Winter Magic
We live in Minnesota for many reasons. The
lakes, great schools, strong work ethic, a sense of tolerance and
progressive pride. As much as we grumble about cold fronts most of us
like the change of seasons; the traditions that help to define us.
Fishing Opener. Aquatennial. State Fair. Deer Hunting Opener. Winter
Carnival.
In 1885 a clueless newspaper writer in New York
City referred to St. Paul, then the fastest growing city in America, as
"a little Siberia, unfit for human habitation in winter." So city
officials decided to throw a big party, a snowy, icy in-your-face...
highlighting ice palaces, parades & massive toboggan slides. It's
grown ever since, a source of civic pride. You really should check it
out. The St. Paul Winter Carnival runs thru Feb. 3.
A subzero relapse this morning, again early
Saturday, gives way to a thaw Sunday and Monday. A slushy coating is by
late Sunday, even a rain-snow mix Tuesday, and we can't rule out a couple inches of slushy snow - but the brunt of any
moisture tracks east of Minnesota.
What a shock.
One more subzero surge the first few days of
February, then long-range models suggest moderation. I suspect the worst
of the chill may be over by February 6.
Then again, I'm a naive optimist.
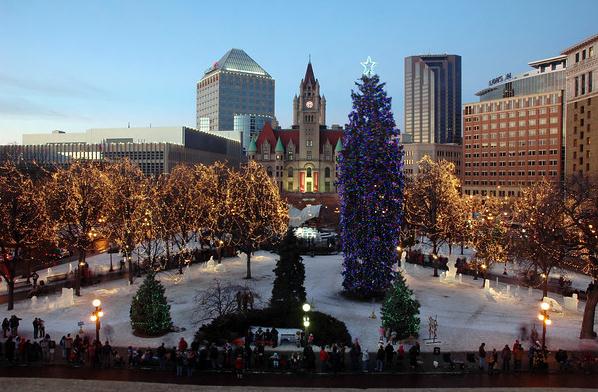
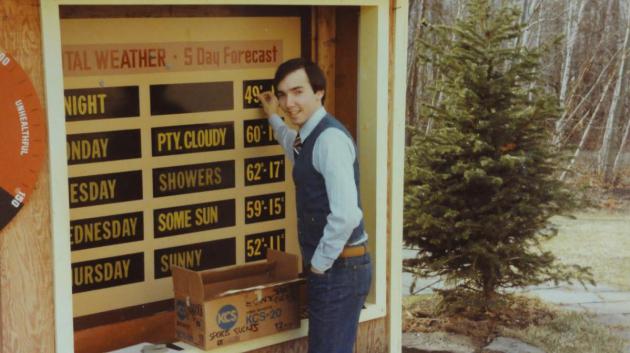
* file photo above courtesy of photographer
Tom Maloney at The St. Paul Winter Carnival.
Coolest Celebration on Earth. The
St. Paul Winter Carnival
kicks off tomorrow, and runs thru the first few days of February. No
significant snow is in sight, but major, ice-statue-threatening thaws
are probably not going to be a problem in St. Paul this year. We may
approach or even top 32 F. for a couple hours next Monday and Tuesday,
but right now I do not see a meltdown. Here's more on the history of the
St. Paul Winter Carnival: "
In 1886, Saint Paul was America’s
fastest growing city. Growing from 39,000 residents in 1880 to 120,000
residents in 1886, Saint Paul had also become America’s third largest
rail center. To celebrate their city’s success, Saint Paul business
leaders produced the inaugural Saint Paul Winter Carnival, which was
held during the first two weeks of February in 1886. In addition to
showcasing Saint Paul, the business leaders wanted to disprove a New
York newspaper reporter who had described their beloved city as
“another Siberia, unfit for human habitation in the winter.” Patterned
after Montreal’s Winter Carnival, the first Saint Paul Winter Carnival
included parades, skiing, snow shoeing, a blanket tossing contest,
and push ball, a game played with giant balls. The most successful
attractions were its ice castle and six large toboggan slides.
Throughout its 125-year history, the Saint Paul Winter Carnival has
been an integral part of the social fabric of Saint Paul. Carnival
reaches out to the people of the Greater Saint Paul area to weave a
tapestry of cultures with educational and cultural programming."
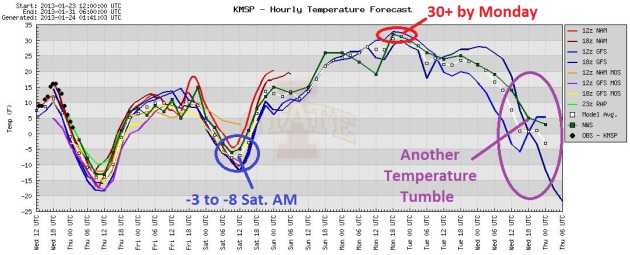
Something For Everyone. After a subzero start this
morning, temperatures struggle into the low teens tomorrow, before
tumbling (just) below zero Saturday morning. Then a more substantial
warming trend begins, a good chance of highs near freezing by Sunday and
Monday, before another cold front has us reaching for parkas by the
middle of next week. Graph: Iowa State.
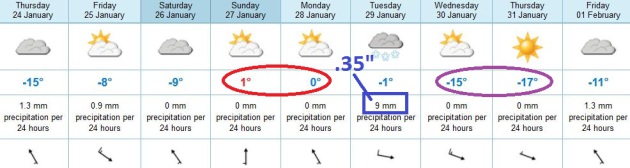
Slush Alert. It's been a long time since we've seen a
"plowable snowfall", in fact the last 2"+ snow in the metro was
December 9 (10.5"). It's all or nothing, right? After a welcome
early-week thaw the ECMWF model prints out .35" liquid Tuesday, but it
may be just warm enough aloft for some of that moisture to fall as rain
or sleet. That said, there is a potential for a couple inches of slushy
snow Tuesday before another surge of Canadian air arrives by midweek.
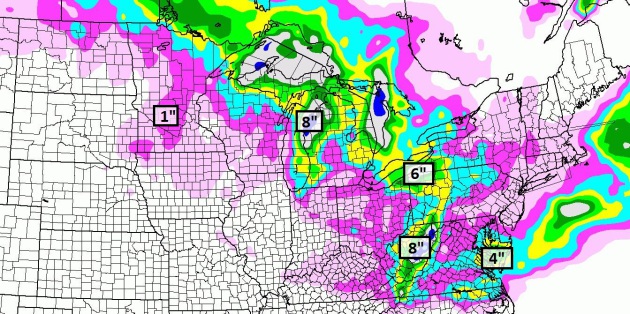
Predicted Snowfall By Saturday Night. The latest NAM
model (NOAA) prints out significant lake effect snows downwind of the
Great Lakes. An unusually mild start to winter means that there's very
little ice on the Great Lakes, so the current (subzero) air passing
over (open) water is able to maximize snow squalls downwind. An inch of
snow is possible over central Minnesota, a couple inches of slush from
Richmond to Norfolk, Virginia, maybe 8" for the hills of West Virginia
and Lower Michigan.
Cold Start To February. The models are fairly
consistent from run to run, showing another delightful dollop of frigid
air sailing south between Feb. 2-5, a few more nights below zero. But I
don't think it will be quite as cold as earlier this week.
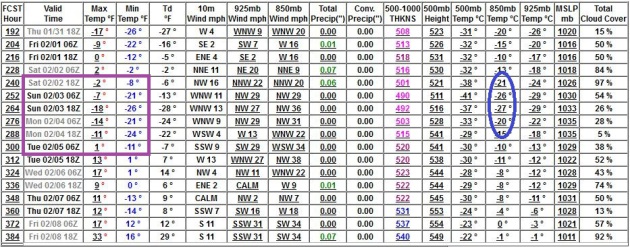
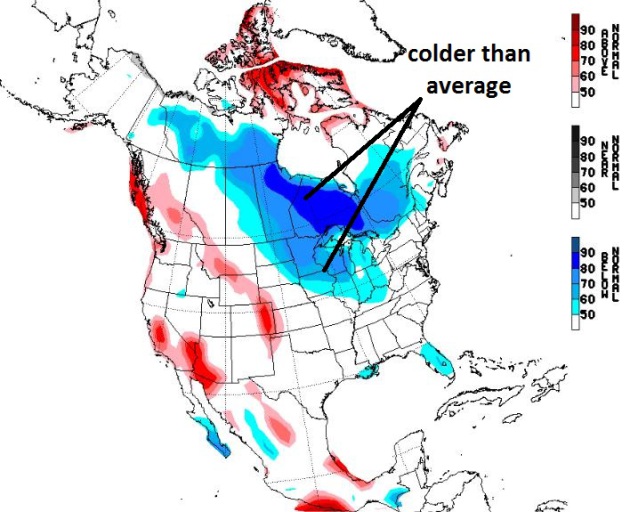
NAEFS Extended Trends. The forecast from January 31
to February 6 shows another chunk of numbing air, with temperatures
well below average, from the Dakotas into the Great Lakes during the
first week of February. I still expect moderating temperatures, maybe
30s, by the second week of next month. I hope that's not just wishful
thinking.
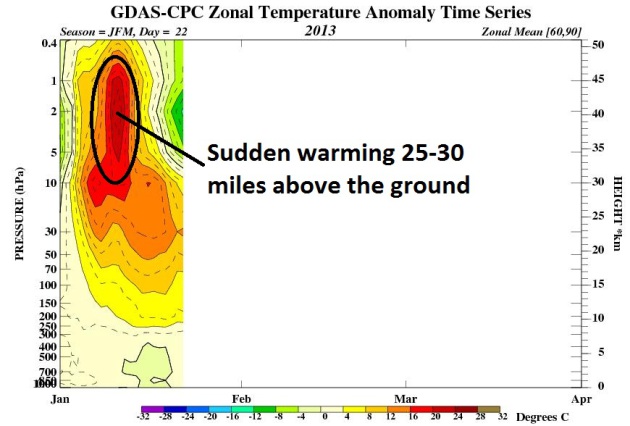
Sudden Stratospheric Warming = Cold Intrusions Over Lower 48 States. Meteorologists look for cues. One big cue for subzero air is (paradoxically) sudden warming
in the stratosphere, the upper atmosphere, where temperatures warm
with altitude. This happened a couple weeks ago, as described by
climate scientist Gavin Schmidt: "Stratospheric
sudden warnings happen when there is a large planetary wave - usually
originating in the tropics - that propagates northward and upward and
disrupts the normal polar vortex. Think of it as an ocean wave breaking
on a tide pool. The temperatures in the stratosphere near the pole go
up a lot because of anomalous downward movement. The
connection between the SSW and the surface winds are a well known
phenomena - see papers by Baldwin and dunkerton a decade or do ago.
After an SSW you get (after about 5-10 days) a negative phase AO
associated with very non-zonal jet streams, leading to large temperature
excursions (both +ve and -ve)." Image above courtesy of NOAA.
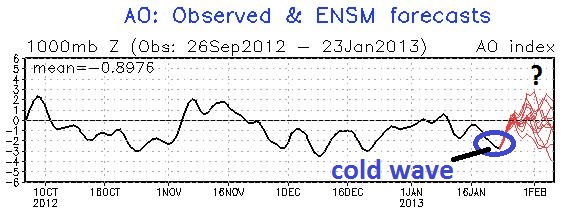
Arctic Oscillation Forecast.
The AO reached a minimum earlier this week, coinciding with subzero
air draining into the Lower 48 states of the USA. A more positive phase
implies warming (nationwide) next week east of the Rockies. After
February 1 it's anyone's guess - a wide divergence of solutions. I still
suspect a very cold start to February, followed by moderation with 20s
and 30s returning by the second week of February. Graphic above: NOAA.
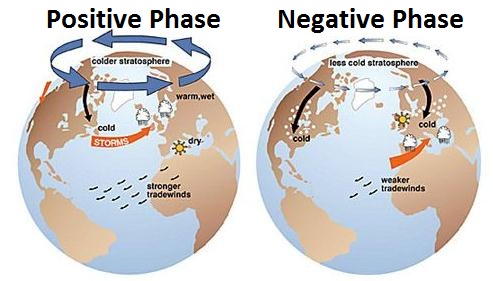
Good Explanation Of Arctic Oscillation.
Why should you care whether the phase of the Arctic Oscillation
(AO) is negative or positive? Because if you know which way the
atmosphere is leaning, you can make a better long range forecast.
"Unusually mild winter with a persistent Pacific breeze [positive phase
like we had most of last winter] or outbreaks of bitter cold [negative
phase, like we've seen since mid-January of this winter]". This may be
more than you've ever wanted to know, but here's a good description
from The National Snow and Ice Data Center: "The
Arctic Oscillation refers to opposing atmospheric pressure patterns in
northern middle and high latitudes. The oscillation exhibits a
"negative phase" with relatively high pressure over the polar region
and low pressure at midlatitudes (about 45 degrees North), and a
"positive phase" in which the pattern is reversed. In the positive
phase, higher pressure at midlatitudes drives ocean storms farther
north, and changes in the circulation pattern bring wetter weather to
Alaska, Scotland and Scandinavia, as well as drier conditions to the
western United States and the Mediterranean. In the positive phase,
frigid winter air does not extend as far into the middle of North
America as it would during the negative phase of the oscillation. This
keeps much of the United States east of the Rocky Mountains warmer
than normal, but leaves Greenland and Newfoundland colder than usual.
Weather patterns in the negative phase are in general "opposite" to
those of the positive phase, as illustrated below. Over most of the
past century, the Arctic Oscillation alternated between its positive
and negative phases. Starting in the 1970s, however, the oscillation
has tended to stay in the positive phase, causing lower than normal
arctic air pressure and higher than normal temperatures in much of the
United States and northern Eurasia."
Arctic Oscillation graphic above courtesy of J. Wallace, at the University of Washington.
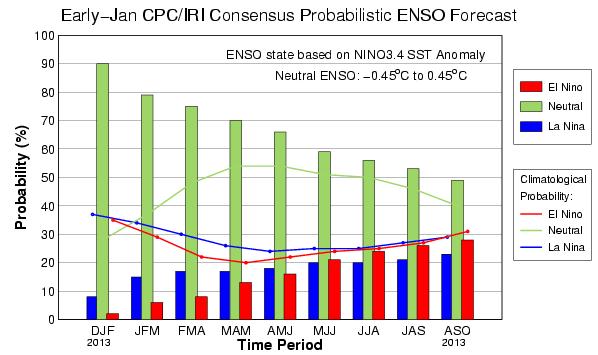
ENSO Outlook for 2013. Here is a prediction of ENSO probability (El Nino, La Nina) from
The International Research Institute for Climate and Society.
Odds favor "ENSO-neutral", which might help our ability to pull out of
a long-term drought over the Plains and Upper Midwest. The worst-case
scenario would be a La Nina cooling phase, which correlates with
drought and much drier than average weather during the summer,
especially central and southern Plains. We'll see.
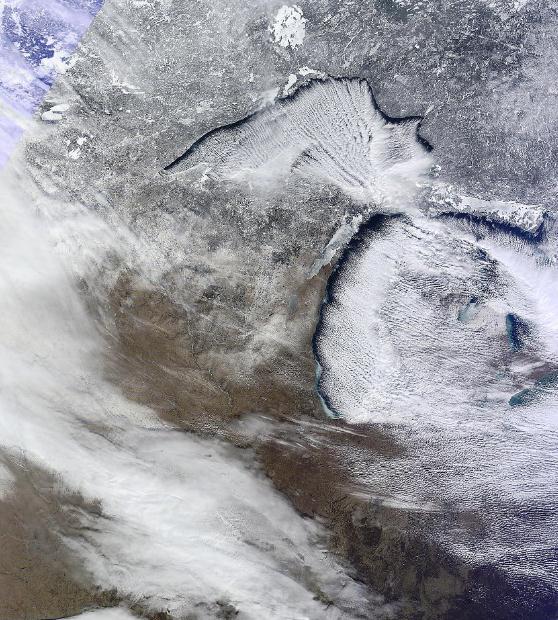
Serious Lake Effect. Subzero air passing over the
(warmer) Great Lakes whipped up plumes of lake effect snow squalls,
pumping heavy snow into downwind communities. This is a little unusual
for late January, when ice should be covering most of the Great Lakes -
this scenario is more typical of late November or early December. Image
courtesy of the
Marquette, Michigan National Weather Service office and CIMSS, University of Wisconsin.
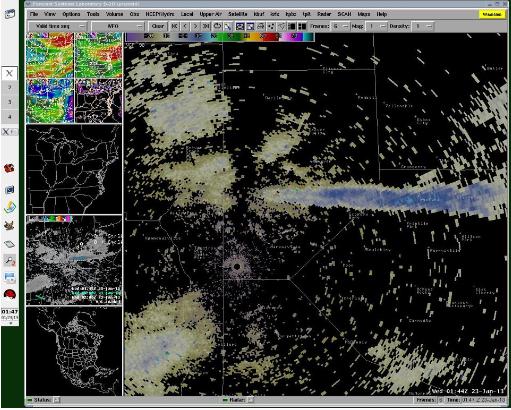
Utility-Enhanced Snow Squalls. This post from the
Pittsburgh NWS caught my eye - steam from a local nuclear power plant "seeding" the clouds, enhancing snowfall rates: "
Check
out the band of snow being generated by the Beaver Valley Nuclear
Power Plant near Shippingport. Up to an inch of snow has fallen as a
result of the steam billowing from the stacks."
"Ask Paul." Weather Related Q&A:
Hi Paul,
"I've wondered for years how meteorologists measure the dewpoint when temperatures drop below 32F degrees. I'm thinking of a wet bulb freezing below 32F and yet see dewpoint readings down to single digits and even below zero."
Thanks!
Very best,
Fred Opie
Fred,
this is a great question, one that is (sadly) beyond my pay grade. I
turned it over to the local Twin Cities office of the National Weather
Service. Michelle Margraf at NOAA was kind enough to provide a very
thorough response:
From NOAA's Michelle Margraf:
The dew point is measured by automated sensors at
temperatures above or below freezing by determining the temperature at
which dew or frost condenses on a chilled mirror hygrometer. In fact,
it's common for water vapor in the air to stay in liquid form (super
cooled droplets) down to -20 degrees Celsius, making it easy for it to
condensate on the chilled mirror. Another method to determining the dew
point, which is used by ASOS sites, is to calculate the dew point from
measurements of temperature and relative humidity. Before automated
equipment were available, the dew point was calculated by using the "dry
bulb" temperature and "wet bulb" temperature, and a psychrometric
calculator.
Here's a paragraph from the attached document
describing how to take wet bulb temperature readings when temperatures
are below freezing (i.e. make sure the wick is frozen before taking a
measurement).
If the dry-bulb temperature is 37°F or less:
1. At least 15 minutes before determining the wet-bulb temperature, immerse the wick into
water that has been kept at room temperature. Remove any excess water from the wet-bulb.
2. At observation time, stand as far from the psychrometer as practical and ventilate it by
means of the fan, whirling apparatus, or sling for approximately 10 seconds.
3. Read the wet-bulb temperature to the nearest 0.1° and make a mental note of the reading.
4. If the wet-bulb temperature is less than 32°F, examine the wick. If the wick is not obviously
frozen, touch it with clean ice or some other cold object to cause ice to form on it.
5. Repeat steps 2 and 3 until the lowest wet-bulb reading (indicated by two successive readings
of the same value) is obtained. At this time read both thermometers then convert to degrees
Celsius to the nearest 0.1°C.
6. Record the dry- and wet-bulb temperatures in columns 19 and 20 on MF1M-10.
7. Obtain the difference between the dry- and wet-bulb temperatures. Use this difference and
the wet-bulb to compute the dew point on the psychrometric calculator.
Thanks Michelle!
Top Ten Sky Sights for 2013 for Minnesota
January 21 – Very close pairing of Moon and Jupiter
February 12-20 – Best view of Mercury this year
March 10-24 – Best view of comet PANSTARRS (Astronomers are still not sure if this comet will be great or a dud. How will it pan out?)
May 21-30 – Conjunction of
Mercury, Venus, Jupiter (The wackos may be out again for this one, you
know, planets aligning, end of world, etc)
June 23 – Biggest full Moon (Will be hyped but hard to tell the difference between this and other full moons)
August 12 – Peak of Perseid meteor shower
October 18 – Penumbral lunar eclipse
Mid Nov thru Dec – Comet ISON (Not sure of this one yet either but it looks promising.)
December – Venus as a beautiful evening object
Dec 13-14 Geminid meteor shower (I threw this in to make ten but it will be hindered by nearly full moon this year)
* my thanks to Parke Kunkle, Faculty of Minneapolis CTC and a volunteer at the amazing Bell Museum. You can sign up for the
Astronomer's Update
through the Bell Museum. They run monthly updates that include where
to look for these sights and others. If you love astronomy (one of the
many benefits of living in Minnesota's Big Sky Country) you should
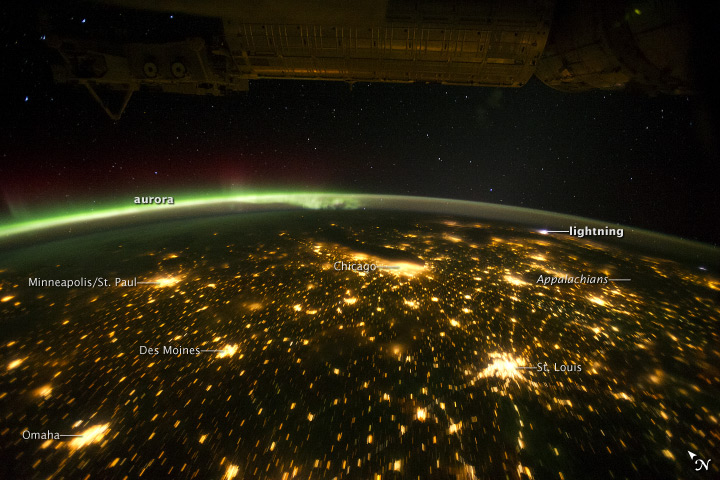
absolutely do this. Aurora image above courtesy of NASA and the
International Space Station.
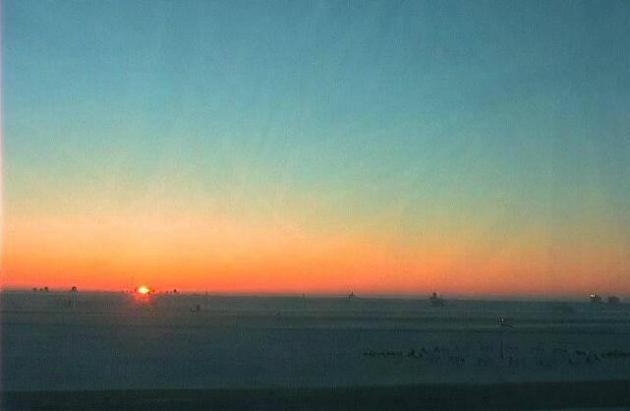
First Sunrise In 65 Days. Is a lack of sunlight making you a little loopy? Just be glad you didn't settle in Barrow, Alaska. Details from the
Alaska NWS: "
Residents
of Barrow, Alaska watched the sun climb above the horizon for the
first time in 65 days, after it set on November 18, 2012. The sun
skirted along the southern horizon for about 43 minutes today. Tomorrow
it will remain above the horizon for 1 hour and 27 minutes. The
amount of sunlight will rapidly increase in Barrow until May 10th, at
which point the sun will remain above the horizon for 24 hours a day
for nearly 3 months. It was clear in Barrow today and a FAA webcam
captured the short but welcome return of sunshine. Watch the sun trace
across the horizon in the video below."
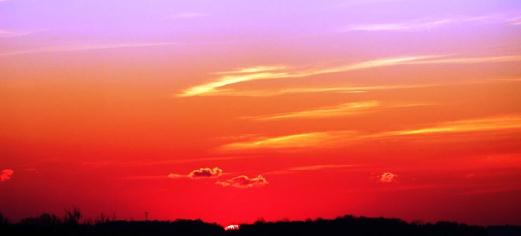
Hurry Up Spring. Tim Butz snapped this photo from his home in Ellicott City, Maryland yesterday.
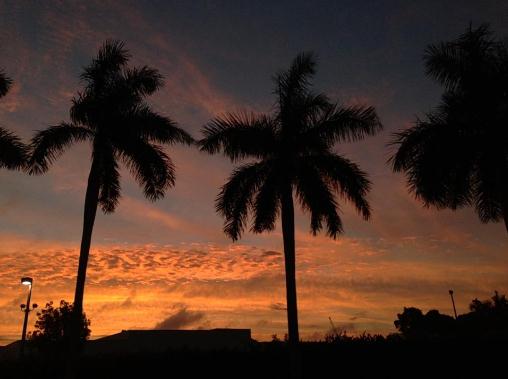
Soul-Soothing. Stare at this image of palm trees in
Miami for 30 seconds. Your blood pressure may drop a few notches. Then
again it may just make you nutty. Image courtesy of the Miami National
Weather Service.
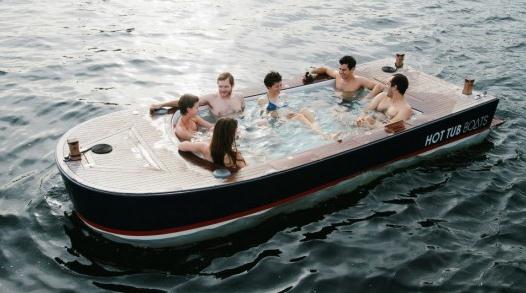
Hot Tub Boat Combines Cruising And Soaking. Hey, I've found the perfect boat! I wonder if they'll have one of these at
The Boat Show, which kicks off next Thursday at the Minneapolis Convention Center.
Gizmag.com has the hot, soggy details: "
Can’t
decide between lounging in the hot tub or going boating? Well, why
not do both? People in and around The Netherlands can already do so,
in a HotTug.
Now, North Americans can also get in on the action, with the Hot Tub
Boat. Manufactured in Seattle, the 6-passenger 15-foot (4.6-meter)
vessel features an 8-foot (2.4-meter) rectangular hot tub, heated up to
104ºF (40ºC) by a built-in diesel boiler. The boat itself is
propelled by a 24-volt electric drive system, maintaining a cruising
speed of 4 knots..."
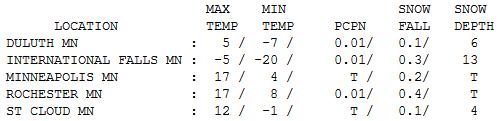
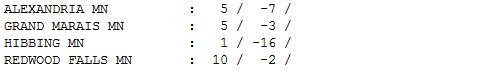
Comfortably Numb. Kind of sad when 17 F.
seems....reasonable. Compared to International Falls we experienced a
Club Med Vacation. INL woke up to -20, with a "high" of -5. Elsewhere
highs ranged from 1 at Hibbing to 12 St. Cloud to 17 in Rochester.
Paul's Conservation Minnesota Outlook for the Twin Cities and all of Minnesota:
TODAY: Subzero start. Clouds slowly increase. Winds: SE 10. High: 10
THURSDAY NIGHT: Light snow or flurries - dusting/coating possible. Low: 8
FRIDAY: Dusting of flakes early, then clearing and windy. High: 17
SATURDAY: Fading sun, slow moderation. Wake-up: -7. High: 15
SUNDAY: Mostly cloudy, flurries at night. Wake-up: 13. High: near 30
MONDAY: Early slush, then milder. Wake-up: 22. High: 33
TUESDAY: Light rain-snow mix. Some slush possible. Wake-up: 26. High: 31
WEDNESDAY: Slow clearing, colder again. Wake-up: 7. High: 14
Climate Stories...
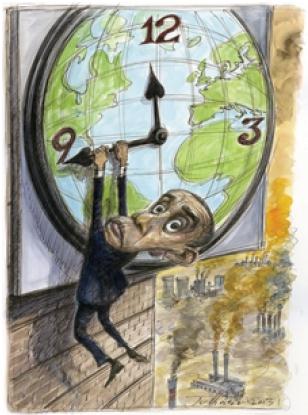
Obama's Climate Challenge. Here's an excerpt of a long, but thorough
Rolling Stone article: "...
Now
Obama gets another shot at it. "The politics of global warming are
changing fast," says Kevin Knobloch, the president of the Union of
Concerned Scientists. Thanks to a year of extreme weather and Hurricane
Sandy, a large majority of Americans – nearly 90 percent – favor
action on global warming, even if there are economic costs. The U.S.
economy is on the road to recovery and no longer offers an excuse for
inaction. Big Coal, traditionally the loudest voice against climate
action, has been weakened by a glut of cheap natural gas and the
economic viability of solar and wind power. China has new political
leadership that appears open to discussing a global agreement to cut
carbon. And Obama himself has nothing left to lose..."
Graphic Illustration by Victor Juhasz, Rolling Stone.
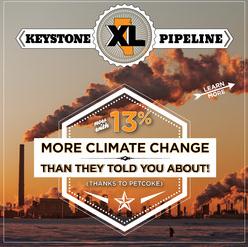
New Analysis Shows Simple Math: Keystone XL Pipeline = Tar Sands Expansion = Climate Change. Here's an excerpt from a blog post at
The Natural Resources Defense Council: "
New research confirms what we have heard time and again from the industry itself: the proposed Keystone XL tar sands pipeline will be a direct cause of an increase in tar sands oil development.
More tar sands oil taken out of the ground means more dangerous
pollution that hurts our climate and health. And, this new research also
shows that tar sands will cause even more climate pollution than we
previously thought due to the impacts of the high carbon byproduct
petroleum coke. This is especially important in a time where our
communities are feeling the damage of climate change
in violent storms, wildfires, droughts and floods. Just recently a
federal advisory panel—established by Congress in 1990 to analyze
climate research—released the draft of its third National Climatic Assessment. The report confirmed there is “unambiguous evidence” that the earth is warming...."
Two Hopeful Signs The Obama Administration Will Not Approve The Keystone XL Tar Sands Pipeline. Joe Romm at
Think Progress has the story; here's the intro: "
50-50.
Those were the odds you could get in DC for a bet on whether or not
Obama would ultimately approve the Keystone XL tar sands pipeline.
But this week I think the odds turned against the pipeline, for two reasons:
- Obama devoted far more of his second inaugural address to
climate change than anybody expected — and framed the issue in stark,
moral terms.
- The State Department decision won’t come until after March, which means it will almost certainly be made by the new Secretary, climate hawk John Kerry...."

No comments:
Post a Comment