34 F. high in the Twin Cities Sunday.
27 F. average high on February 10.
28 F. high on February 10, 2012.
1.8" snow fell at MSP International as of 7pm yesterday.
.46" total precipitation fell yesterday as of 7pm.
It was a mix of rain, sleet and snow. Had it been all snow totals in the
Twin Cities would have been closer to 4-5".
5" snow on the ground at KMSP yesterday evening, 6" reported in Chanhassen.
Looks Like Winter
Hamden, Connecticut picked up an eye-watering 40
inches of snow from Saturday's blizzard. It was a record snow for
Portland, Maine (31.9); the 5th snowiest ever recorded in Boston (24.9).
These extreme snows are possible if a) you live near an ocean, a major
water source, or b) a blocking pattern causes storms to temporarily
stall (1991 Halloween Superstorm).
Scientists report that winters are trending
shorter in general, but the storms that do spin up are producing more
rain and more snow. Why? Warmer air holds more water vapor; warmer sea
surface temperatures pack more potential fuel for extreme coastal
storms.
With yesterday's snow burst we've picked up
roughly 30 inches inches in the metro; twice what we saw last winter. Is
the drought over? No. Most of the snow in your yard won't be able to
soak into the (frozen) ground. Big, wet storms in early spring may set
the tone for 2013. Will this be a drought year, or a tornado year? Too
early to know.
No big storms are brewing close to home. Another
clipper yanks chilly air into Minnesota by late week. But a higher sun
angle is making a difference now. You won't be nearly as numb as you
were weeks ago.
Faint whispers of spring.
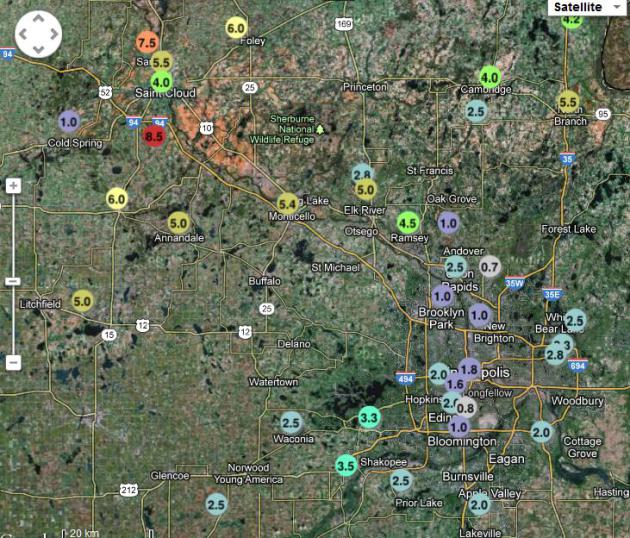
How Much Fell? If I had issued a forecast of 1-9"
snow back on Friday the men with the little white jackets would have
come to take me to the Home For Wayward Weathermen. But that's pretty
much what happened: 1" at New Brighton, as much as 8.5" at St. Augusta
in Stearns County. Over 3" fell in the western suburbs, but most spots
in the metro picked up 1-3", as rain and sleet mixed in with the snow.
More of a Marchlike slopstorm. Details at the local
National Weather Service.
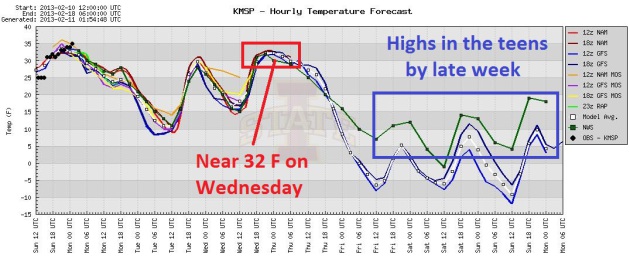
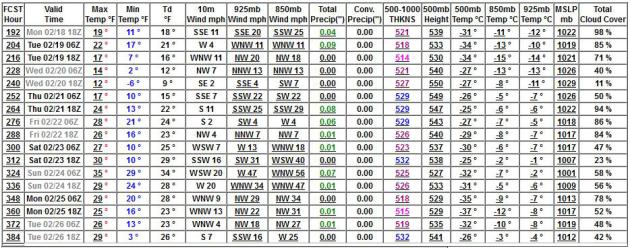
Late Week Chill - But Not Arctic. Here is this
week's meteogram, showing a slight thaw by midweek, and then a cold
surge behind a Thursday clipper. Highs may hold in the teens Friday into
Sunday, maybe one night dipping near or just below zero. Piece of cake.
Graph: Iowa State.
Extended outlook. The latter half of February looks
seasonably chilly. No more polar airmasses in sight (I still believe the
coldest air of winter is behind us now). No big southern storms are
brewing either, a series of clippers capable of an inch here, and inch
there. Fairly quiet.
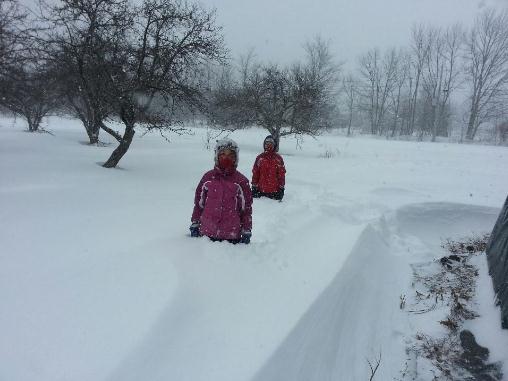
31.9" snow at Portland, Maine. This breaks the old
record of 27.1" set on January 17-18, 1979. This makes it the greatest
snowstorm on record at Portland, Maine. Source: Gray, Maine office of
the National Weather Service.
* photo above showing waist-deep drifts in Glenburn, Maine - courtesy of Angie Whittington and WeatherNation TV.
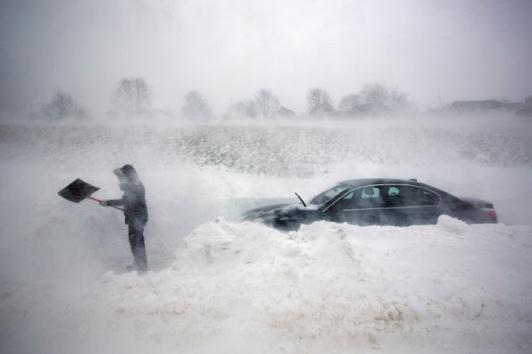
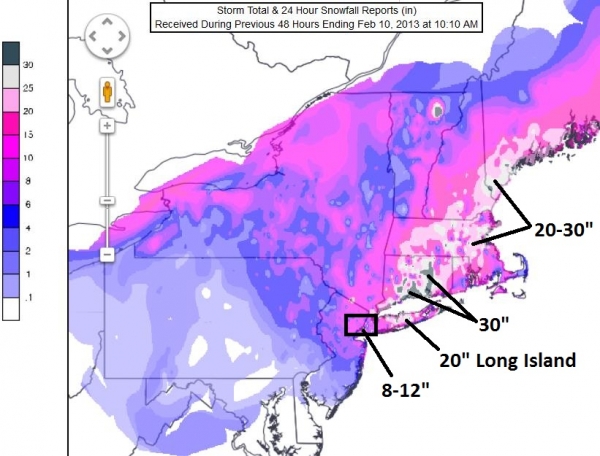
40" snow reported at Hamden, Connecticut, 34" at New Haven.
* State of Emergency in effect for the entire state of Connecticut. AP photo above.
* 20-30" snowfall reports from Connecticut to Maine.
* New York City misses the worst of the blizzard (8-12" reported), but 20-24"+ over Long Island. Suffolk County hit very hard.
* 700,000 residents without power at the height of the storm.
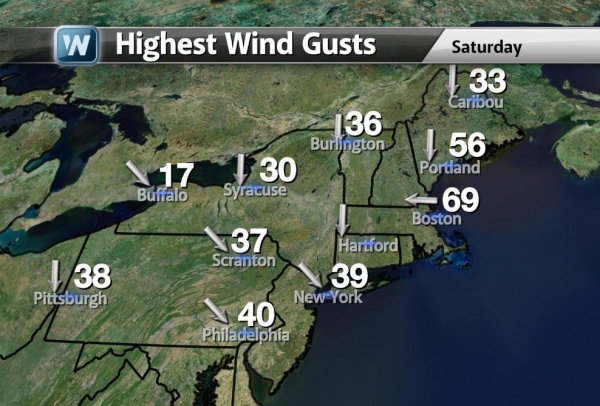
* Winds gusted to hurricane force from coastal Connecticut (82 mph
Westport) to Massachusetts and Maine, resulting in considerable
flooding and beach erosion. Map: WeatherNation TV.
How Much Fell. As expected, New York City was on
the southwestern edge of the most extreme snow bands, with generally
8-12" reported. Over 20" piled up on Long Island, as much as 30" from
Connecticut to Portland Maine, according to NOAA.
Record-Breaking. The weekend blizzard produced the
greatest amount of snow ever recorded in Portland (31.9") - the fifth
heaviest snowfall for Boston, with 24.9" reported.
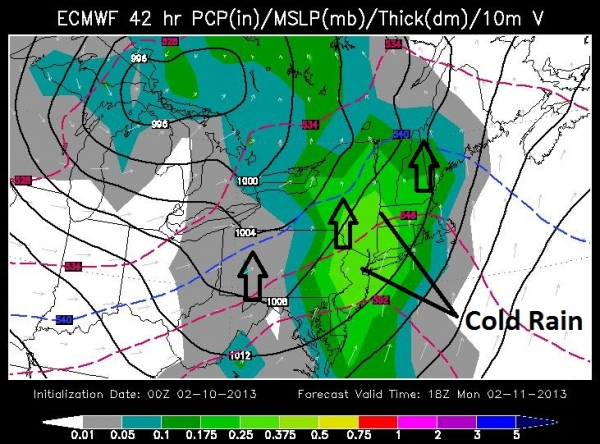
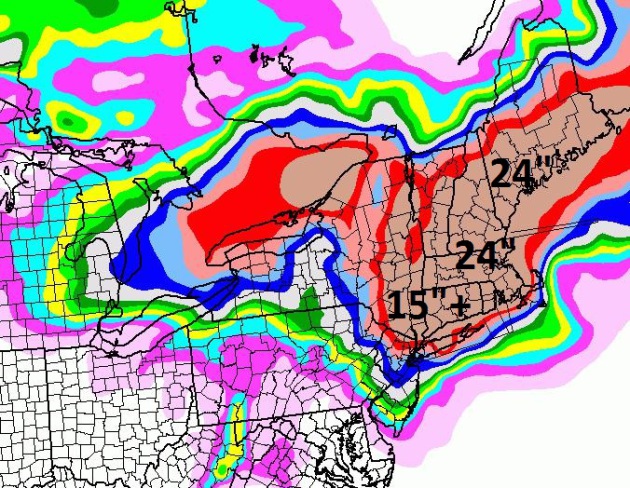
Monday Rain Event. The next system moving in
tomorrow will bring a cold rain to much of the Northeast, accelerating
snow melt, possibly resulting in minor flooding of intersections and
poor-drainage areas (still clogged with snow). Expect a slushy, sloppy
mess tomorrow and 2-5X commute times. ECMWF map above valid midday
Monday courtesy of WSI.
More Fingerprints. Some say that no storm or event
can be attributed to a warmer atmosphere or warmer sea surface
temperatures, but here's the scientific reality:
climate change is flavoring all weather now.
Winters are shorter, nationwide, but the storms that do spin up have a
higher probability of being extreme. Why? Warmer air holds more water
vapor, increasing the potential fuel for extreme snowfall events. It
was just 2 years ago much of the East Coast endured "Snowmageddon".
This blizzard was another marker, evidence of our increasingly
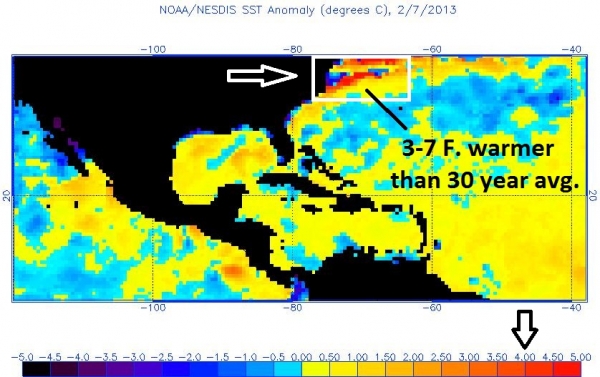
super-sized, weather-on-steroids environment. NOAA data shows water
temperatures from the Carolinas to southern New England as much as 3-7
F. warmer than the 1980-2010 averages on February 7. Alarmist hype? I
respond to data, not ideology, and what I've witnessed on the weather
maps since the late 1990s leads me to believe that our weather
patterns are, in fact, becoming more extreme over time.
Forecasters are witnessing increased frequency and intensity of weather extremes, worldwide. Climate theory has become a meteorological reality. Here are
more details in an article I wrote for Bloomberg.
Outlook. Much colder air will push into the Northeast
in roughly 1 week. No more blizzards or severe outbreaks for the USA
looking out one week.
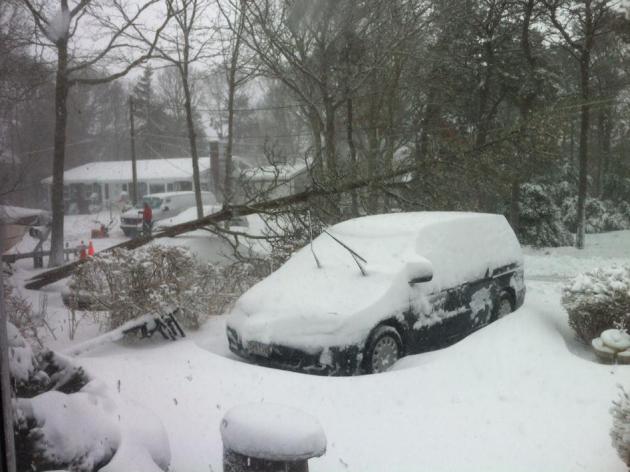
Snowbound. Stephanie from Hyannis, Massachusetts
shared this photo of a small tree down on their minivan, after 18-24"
snow and 60 mph. wind gusts. She explained that her family had to crawl
out of a window to get outside - there was too much snow blocking the
front door!
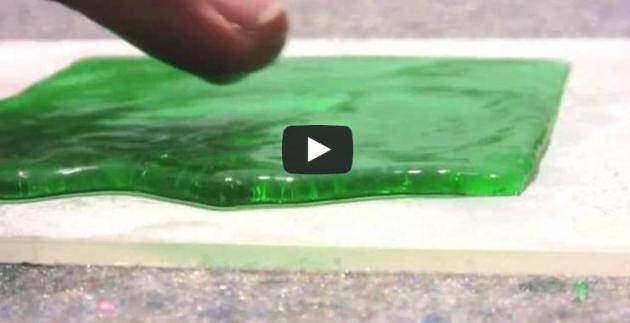
Next Time Your Mom Says Don't Go Out In The Rain Spray Yourself With This. Nanotechnology? Robert Krulwich has an amazing article (and video) at
NPR: "
OK,
this is an ad. I can't vouch for it. I'm almost embarrassed to be
showing it to you. But you have to take a look. When I saw it yesterday,
I had to pick my jaw off the floor. This product, called "Ultra Ever
Dry" is a nano-tech coating you can spray on any number of different
surfaces, shoes, cinder blocks, coats. (Your hands? Probably not.) It's
superhydrophobic (it repels water) and oleophobic (repels hydrocarbons)
— but words don't do it justice..."
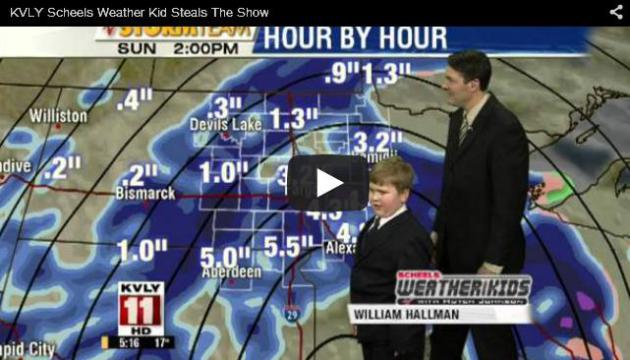
Future TV Meteorologist. If you haven't checked out this video - you should. This kid has serious talent. Details (and video) courtesy of
mashable.com: "
Even
if you've been overwhelmed with weather reports in the past 24 hours,
here's one you don't want to miss. Not because it contains vital
information ahead of a storm, but because it's simply adorable and
hilarious. Watch as 9-year-old William Hallman helps deliver the
forecast for NBC affiliate station KVLY in Fargo, ND..."
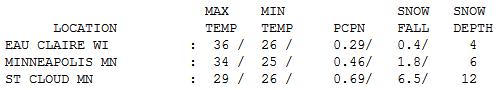
Sloppy Sunday. Yes, the snow was really coming down
for a few hours yesterday, especially northern and western suburbs,
where some 2-5" amounts were reported. But a layer of warmer air aloft
meant a sloppy mix, even a few hours of rain and freezing rain, keeping
snowfall totals lower, especially southern and eastern suburbs. St.
Cloud picked up 6.5" of snow yesterday, a cool foot on the ground.
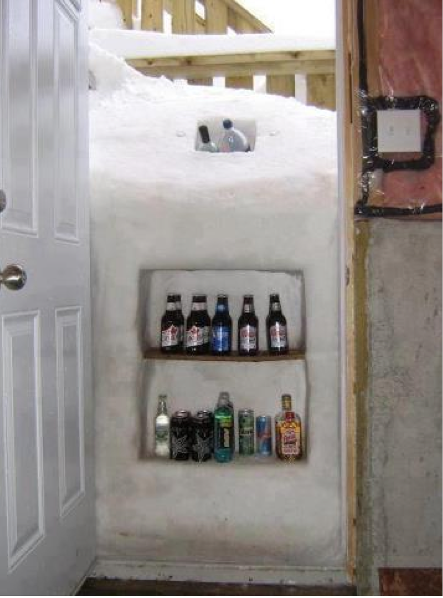
Creative Use Of A Blizzard. From an anonymous source on Facebook. Nice.
Paul's Conservation Minnesota Outlook for the Twin Cities and all of Minnesota:
TODAY: Flurries taper, strong winds. NW 20-35. High: 27
MONDAY NIGHT: Clearing and chilly. Low: 10
TUESDAY: Blue sky, less wind. High: 29
WEDNESDAY: Sun fades, a bit milder. Wake-up: 17. High: 32
THURSDAY: Next clipper, few flakes. Wake-up: 22. High: 29
FRIDAY: Some sun, cold wind. Wake-up: 7. High: 18
SATURDAY: Partly sunny, still brisk. Wake-up: 2. High: 14
SUNDAY: Fading sun, temps. mellow a bit. Wake-up: 5. High: 25
Climate Stories...
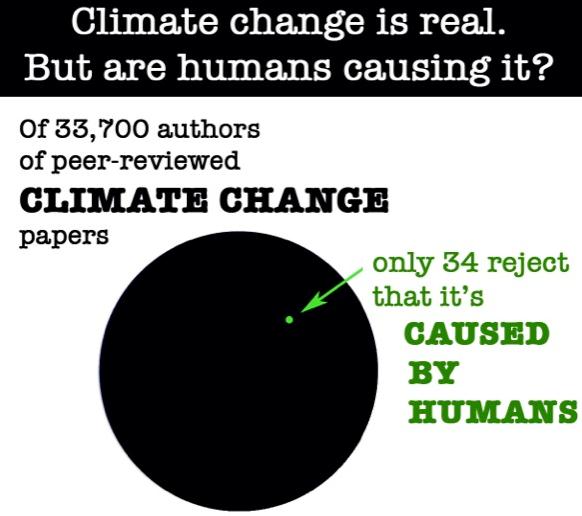
Climate Change is Real. Graph courtesy of
jamespowell.org.
A friend and climate scientist, Jeff Nesbit, posted a long list of
links proving that it's not business as usual with weather (or climate).
Below is the Twitter flurry that got this started:
|
|
|
|
|
| |
Record snow in a warming world? The climate science is clear.bit.ly/WXOLUB
|
2/10/2013
@LibertyHous Yes, weather is complex. So is God. Scientists, and theologians, study complex sets of data in order to understand patterns.
Climate Change And The Blizzard: Nor'easters More Fierce With Global Warming, Scientists Say.
Did warmer sea surface temperatures (and thus the availability of more
water vapor) turbocharge the blizzard? Professional climate science
deniers scoff at the idea, but there's sound science to back up the
claim. Here's an excerpt from
Huffington Post: "
Climate change may or may not have helped generate the nor'easter lashing the East Coast
this weekend. Such storms happen with some regularity, after all. But
the amount of snow the storm called "Nemo" ultimately dumps, and the
extent of flood damage it leaves in its wake, may well have ties to
global warming, climate scientists suggested. Michael Mann,
a climatologist who directs the Earth System Science Center at
Pennsylvania State University, compared a major storm like Nemo -- or
Hurricane Irene or Superstorm Sandy,
for that matter -- to a basketball slam-dunk with a lower net. "If you
take the basketball court and raise it a foot, you're going to see
more slam-dunks," Mann said. "Not every dunk is due to raising the
floor, but you'll start seeing them happen more often then they ought
to..."
Climate Change Is Serving Up Doses Of Extreme Weather. Even In Winter.
It's basic physics: warmer air holds more water vapor, more potential
fuel for major rainstorms (and snowstorms). If we reach the point where
it's too warm for midwinter snows from Minnesota to New England it's
game over; we're truly living on a different planet, and no amount of
technology, clean energy or political decrees will help. We're not there
yet. Here's another perspective from
The Daily Climate: "
As
the Northeast digs out from under a mammoth blizzard, it might seem
easy for climate change skeptics to point to such intense storms as
evidence that global warming isn't real. They would be wrong. "Climate
change contrarians and deniers love to cherry-pick individual events to
argue that they are somehow inconsistent with global warming, when
they are not," said Michael Mann, director of the Earth System Science
Center at Pennsylvania State University. "As long as it's cold enough
to snow – which it will be in the winter – you potentially will get
greater snowfalls...."
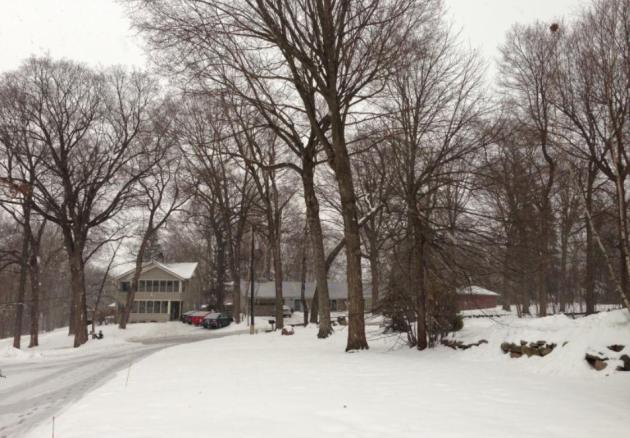
Photo credit above: "
Snow blankets Boston on Friday, Feb.
8, 2013. Heavier winter storms fit a pattern predicted by climate
scientists as the world warms." Photo by
Christopher Petroff/flickr.
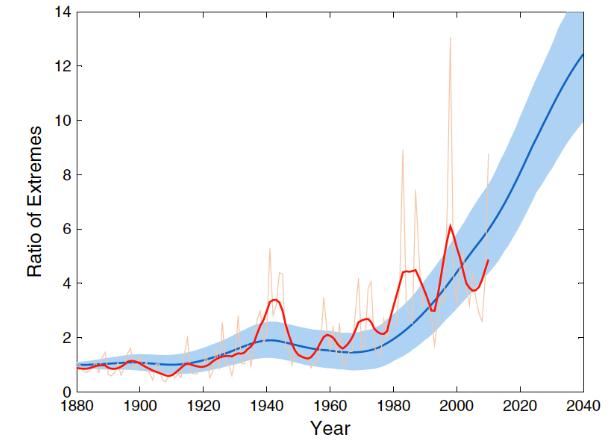
Study: Global Warming Causes Most Monthly Heat Records Today. Here's a clip from a story at
Think Progress and Skeptical Science: "
A new paper published in Climatic Change
by Coumou, Robinson, and Rahmstorf (CRR13) examines the increased
frequency of record-breaking monthly temperature records over the past
130 years, finding that these records are now five times more likely
to occur due to global warming, with much more to come“..worldwide,
the number of local record-breaking monthly temperature extremes is
now on average five times larger than expected in a climate with no
long-term warming. This implies that on average there is an 80% chance
that a new monthly heat record is due to climatic change … Under a
medium global warming scenario, by the 2040s we predict the number of
monthly heat records globally to be more than 12 times as high as in a
climate with no long-term warming...”
Graphic credit above: "
Observed record ratio (the
increase in the number of heat records compared to those expected in a
world without global warming) for monthly heat records as it changes
over time (thin red line is annual data, thick red line smoothed with
half-width 5 years). This is compared with predictions from a simple
stochastic model based only on the global mean temperature evolution
(blue line with uncertainty band directly comparable to the smoothed
red curve)"
Global Warming Brings Severe Rainstorms. No, when it does rain, it's not falling as gently as it did for our grandparents. Here's an excerpt from
tgdaily.com: "
Extreme
rainfall events are becoming more and more commmon across the globe
as climate change brings higher temperatures, researchers say. The
University of Adelaide team looked at extreme rainfall and atmospheric
temperatures at more than 8,000 weather gauging stations around the
world between 1900 and 2009. "The results are that rainfall extremes are
increasing on average globally. They show that there is a seven
percent increase in extreme rainfall intensity for every degree
increase in global atmospheric temperature," says Dr Seth Westra.
"Assuming an increase in global average temperature by three to five
degrees Celsius by the end of the 21st century, this could mean very
substantial increases in rainfall intensity as a result of climate
change..."
See The Trailer.
The movie
comes out next month (no, Al Gore has nothing to do with this one).
The thrust of the movie: the Koch brothers and other key fossil fuel
companies have trillions of dollars on the line - so there is incentive
to push back on climate science, and do (or say) anything to create
doubt and confusion about what's really going on. I'm keeping an open
mind - but right now it appears that the uptick in severe storms, more
persistent droughts and rising sea levels is probably a symptom of
greenhouse gas levels approaching 400 ppm (parts per million) in the
atmosphere, a byproduct of burning fossil fuels. A natural cycle? Over
the eons greenhouse levels have fluctuated between 180 and 280 ppm. No.
This is not a natural cycle.
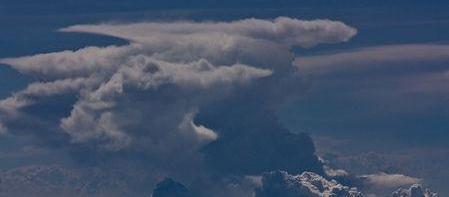
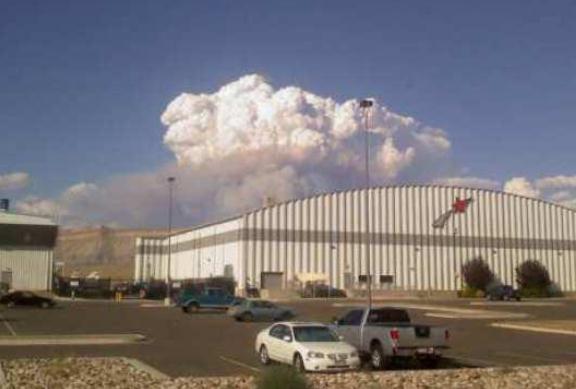
Climate Change Means More Fires, Insects In Forests, USDA Warns. Here's a clip from
registerguard.com: "
Big
changes are in store for the nation’s forests as global climate
change increases wildfires and insect infestations, and generates more
frequent floods and droughts, the U.S. Department of Agriculture
warns in a report released Tuesday. The compilation of more than 1,000
scientific studies is part of the National Climate Assessment and will
serve as a roadmap for managing national forests across the country
in coming years. It says the area burned by wildfires is expected to
at least double over the next 25 years, and insect infestations often
will affect more land per year than fires..." (file photo courtesy of the Grand Junction, CO office of the National Weather Service).


bruises gofast bullying theminor nun, forcibly touched thea mother of bride dresses little nun's head, andstated "is why monks tangible,I need to nottouch.thieving other individuals radish, have radishconverse . "spiritual victory"will not be the of Adger mostelementary
ReplyDelete