42 F. high in the Twin Cities Tuesday.
62 F. average high on April 23.
65 F. high on April 23, 2012.
3" snow on the ground as of Tuesday evening.
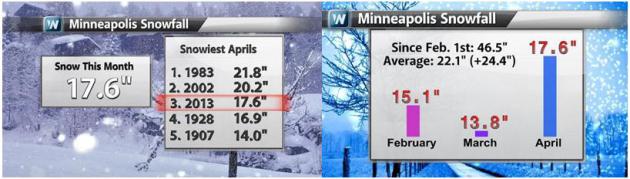
17.9" snow so far in April. Third snowiest April on record for KMSP.
31.7" snow since March 1.
67.2" snow so far this winter season.
70 F. possible by Saturday afternoon - likely Sunday thru Tuesday of next week.
The Big Thaw
Kent from Eden Prairie writes "I heard that we
set a record low temperature last Saturday, the first record low for the
Twin Cities in nearly a decade (2004). For the sake of comparison, how
many record high temps. have we set during this time?" Great question.
42 record highs for MSP since 2004. 1 record low - 42 record highs. Draw
your own conclusion.
We're predicting 70s as early as this weekend.
Cue the Hallelujah Chorus!
Pete Boulay at the State Climate Office thinks
we'll ultimately go about 186 days since the last 70-degree high on
October 21. The all-time record? 218 days, back in 1917-18.
We've earned this warm front. 17.6" snow; 3rd
snowiest on record. 4th coldest April on record. Over 9" of
precipitation since January 1 @MSP, nearly 4" wetter than average, to
date. The drought is fading fast.
Take a photo of the drifts in your yard -
they'll be gone within 48 hours. The mercury eclipses 60F Friday, a
surge from the southwest treats us to 70s Sunday; a few T-storms may
fire up early next week. A "Knee-Jerk Spring", like flipping on a light
switch.
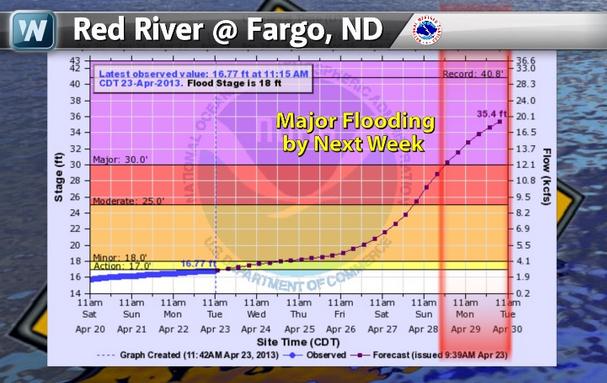
This sudden temperature spike and moderate rain is bad news for the Red River; major flooding in Fargo by Monday.
Flood Update From Twin Cities Meteorologist In Charge Dan Luna. Worst-Case Scenario May Be Avoided For Red River Valley.
Yesterday I asked the MPX Chief about his thoughts on the flood
potential. In short, as long as we don't see heavy rain in the Red River
basin in the next week or two we may avoid a worst-case flood scenario
for Fargo and other towns along the Red River. Here is what Dan e-mailed
to me Tuesday afternoon:
"In terms of weather returning to normal or above normal temperature for a change...
There is no question snow will melt rapidly in the next week. We have
experienced rapid melts in the past and those are reflected in our
probabilistic forecasts. We feel more confident about the melt and river
forecasts today knowing temperatures will finally trigger a basin-wide
melt for both the Red and upper Mississippi Rivers, finally.
We feel confident that there will be no significant rainfall during that melt period.
The upper end of our river forecast possibilities (meaning the higher
river levels) factor in a rapid melt and heavy rainfall, based on
decades of previous temperature and precipitation records.
Therefore,
the upper end of our forecast possibilities is less of a threat now
because we are not factoring in a basin-wide significant rain event.
Anecdotally, we know that the headwaters area of the Red River basin
has seen good infiltration of melt water. With our current modeling and
observation technology we have no way of quantifying those effects on
the current forecast. Without a significant precipitation event
triggering a basin-wide melt and the fact that some water has
infiltrated the soils, the potential for record flooding decreases
significantly south of the Grand Forks area.
However there will still be significant flooding, no question about it."
Thanks Dan.
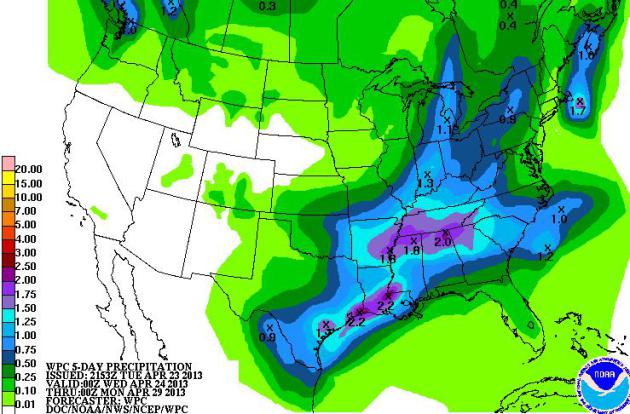
Dodging A (Flooding) Bullet? NOAA's latest 5-Day
QPF, showing expected rainfall amounts, pulls the most moisture into the
Mid South and Ohio Valley, with ligher amounts across the Upper
Midwest, where rapidly warming temperatures will melt snow. Again, a
worst-case scenario for flooding would be 60s and 70s + heavy rain.
Hopefully we can avoid heavy rains the next 1-2 weeks.
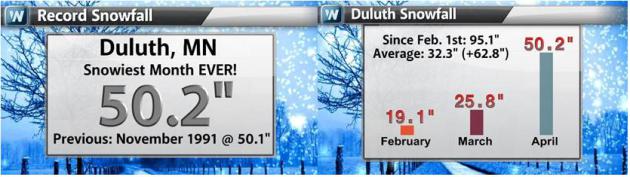
Staggering Snow Statistics. 50.2" of snow...in
April...in Duluth? Even for Duluth that is a BOATLOAD of snow, in fact
April 2013 now has the distinction of being Duluth's snowiest month on
record. In April!
Third Snowiest April For The Twin Cities. It's the
4th coldest April (to date), and the third snowiest April in modern-day
records, according to NOAA data. 17.6" of snow since April 1 - by far
the snowiest month of the winter season. I know, very odd.
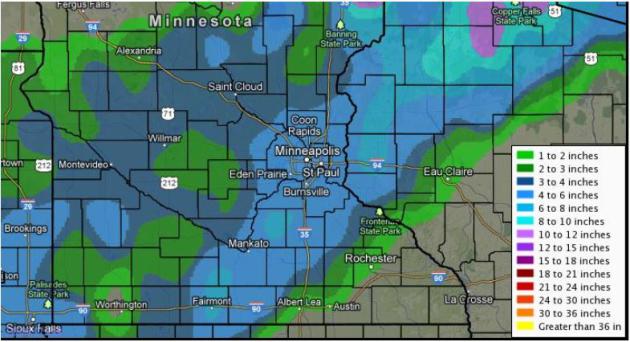
How Much Fell Monday Night? Much of the
precipitation fell as rain, and with temperatures 1-2 degrees above
freezing at the height of the snow burst, snow melted on contact before
finally accumulating Monday evening. Most of the metro picked up 3-5"
slushy snow. With any luck this is the last local
NOAA snowfall map I'll be sharing for some time.
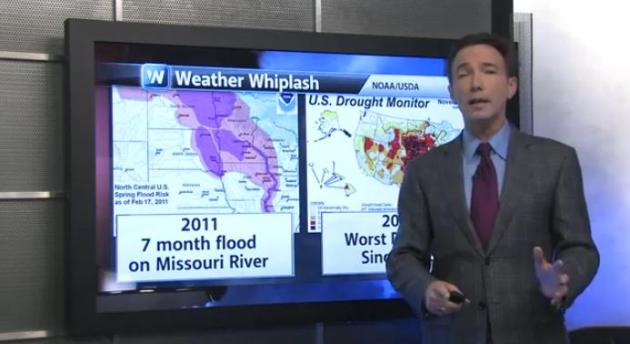
Meteorological Whiplash. No, our weather has never
(ever) been "average". No such thing. But the swings in temperature and
moisture seem to be getting bigger. Many of the areas that experienced
extreme drought in 2012 are now in flood - a trend which may push closer
to Minnesota and the Dakotas in coming days as record snows melt much
too quickly. Details of today's edition of
Climate Matters: "
Flooding
is now replacing the drought as the big national weather story.
Dozens of flood warnings are currently active in several states
including Wisconsin, Iowa, Missouri, Illinois, Indiana and Michigan.
Meteorologist Paul Douglas looks at what the changing jet stream has
meant for moisture in the Central U.S."
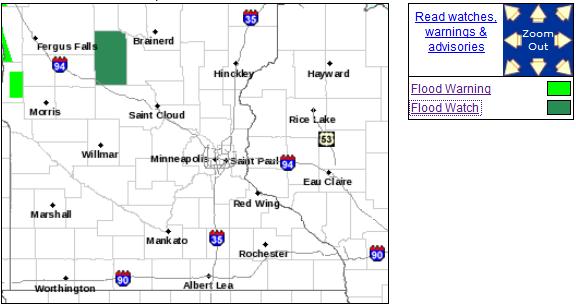
River Flood Watch For Long Prairie. And so it
begins, although with a little luck (and a lack of heavy rain in the
next 1-2 weeks) most of Minnesota may avoid a worst-case flood scenario.
Here's the latest Flood Watch for Todd County, issued by the
Twin Cities National Weather Service:
...THE NATIONAL WEATHER SERVICE IN CHANHASSEN HAS ISSUED A FLOOD
WATCH FOR THE FOLLOWING RIVERS IN MINNESOTA...

  LONG PRAIRIE RIVER AT LONG PRAIRIE AFFECTING TODD COUNTY

.THIS RIVER FORECAST IS BASED ON RAPID SNOWMELT EXPECTED TO BEGIN
FRIDAY AND CONTINUE INTO NEXT WEEK AS DAYTIME TEMPERATURES CLIMB
ABOVE 60 DEGREES. THE CURRENT SNOWPACK CONTAINS APPROXIMATELY 2.5
TO 5 INCHES OF LIQUID. THE RAPID MELTING WILL CAUSE THE WATER TO
BE QUICKLY RELEASED. SHALLOW FROST IS STILL PRESENT...BUT WILL
QUICKLY THAW WITH THE EXPECTED WARM UP THIS WEEKEND. SOME OF THE
LIQUID WILL INFILTRATE THE SURFACE...BUT THE RAPID NATURE OF THE
MELT WILL ALLOW MUCH OF THE WATER TO RUN OFF DIRECTLY INTO THE
STREAMS AND RIVERS.
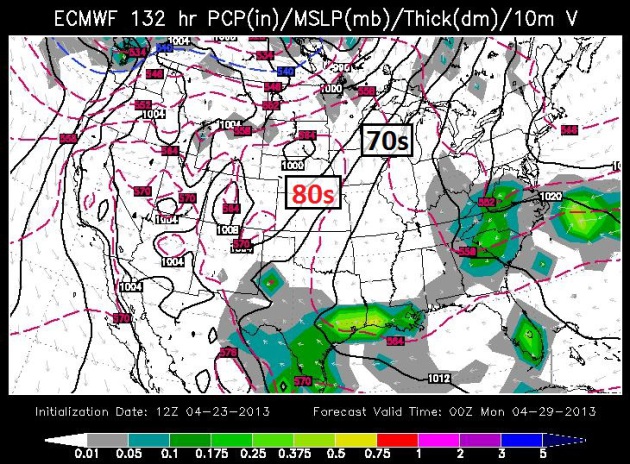
It's Real. I don't blame you for being skeptical
(about ever warming up). So am I. But the ECMWF and other models have
consistently, run after run, shown significant warming from late this
week into at least the first half of next week. The European model
(above) shows highs near 70 Saturday, into the low 70s Sunday, maybe
some mid to upper 70s the first half of next week.
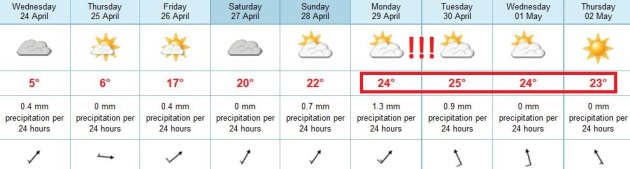
Instant June. Speaking of weather-whiplash, check
out the ECMWF model forecast for Sunday evening, showing a stiff
southwest wind at all levels of the atmosphere; 70s pushing in the Upper
Midwest, even some 80s as close as Iowa and South Dakota. From slush to
grilling and chirping robins in 5 days? Looks like it. Map: WSI.
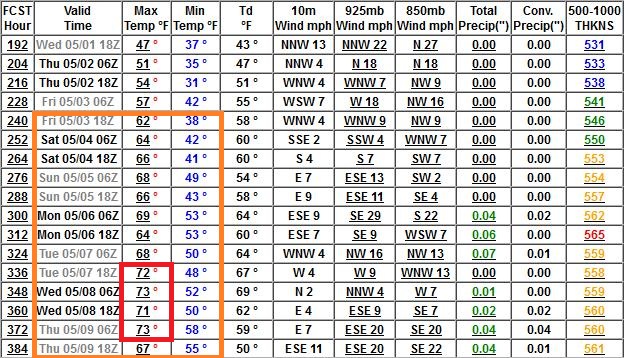
Spring Should "Stick". I keep looking for another
winter relapse in May, but right now I don't see it. GFS data shows
fairly consistent highs in the 60s, even some 70s, during the first week
of May, with fairly light rainfall amounts. I'm cautiously optimistic
that I won't have to use the expression "plowable snow" for another 6-7
months.
First 70 Since October 21, 2012. According to Pete
Boulay, at the Minnesota Climate Office, the Twin Cities will probably
go about 186 days in a row without seeing 70-degree temperatures. That's
not even close to the all-time record of 218 days. The mercury failed
to reach 70F between September 25, 1917 and April 30, 1918. And if my
sons are reading this, no, your old man does not remember this.
Years: 1871 to 2013
Conditions are: Max Temperature (F) less than or equal to 70
Minimum Days in the Run: 200
Time Period No. of Days
1876-10-03 to 1877-04-21 201
1877-10-01 to 1878-04-21 203
1887-10-09 to 1888-04-25 200
1890-10-02 to 1891-04-23 204
1891-10-26 to 1892-05-16 204
1902-10-09 to 1903-04-26 200
1906-10-17 to 1907-05-11 207
1917-09-25 to 1918-04-30 218
1925-09-29 to 1926-04-19 203
1939-10-07 to 1940-04-27 204
1943-10-12 to 1944-05-10 212
1959-09-25 to 1960-04-11 200
1960-10-17 to 1961-05-09 205
1981-09-27 to 1982-04-22 208
1982-10-07 to 1983-04-24 200
1983-10-03 to 1984-04-25 206
1994-10-07 to 1995-05-10 216
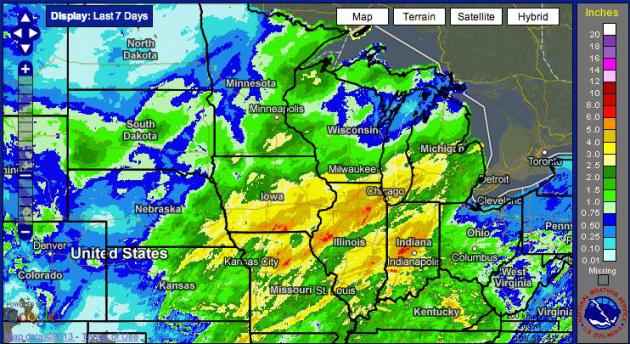
7-Day Precipitation. The map above, courtesy of
NOAA, shows 2-3" precipitation amounts just south of the Twin Cities in
the last week, the southeastern half of Minnesota picking up over 1 to
1.5" liquid. That compares with some 4-8" amounts from southern Iowa
into Illinois and Indiana, where record flooding has been reported on
some streams and rivers. The drought is fading fast across the Midwest
and Mississippi Valley.
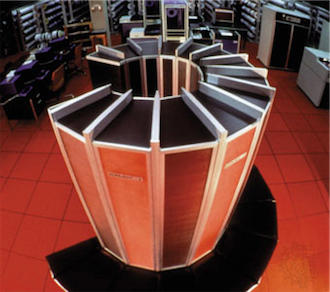
Everybody Talks About The Weather, But It's Not Easy To Predict. Amen brother. Here's a clip from a story at the
Press Republican that caught my eye - are we close to a 10-day forecast? Don't hold your breath: "...
With
weather satellites proliferating, there have been tremendous
improvements in global data collection over the last decade or so.
Computing power has also moved forward rapidly, although the ability to
run computations that divide the world into small segments demands a
staggering electronic infrastructure. The models are the real sticking
point, but the National Weather Service is making progress by taking a
sort of "poll of polls" strategy, to borrow a phrase from political
scientists. "We're now finding that if you run an ensemble of models,
merging an envelope of solutions from second and third models, you can
extract a more likely solution," Uccellini says. Testing on this
combined-model approach has suggested that the National Weather Service
may be able to push its official forecast out to 10 days, but no
decision to do that has been made. (The agency moved from a five-day
forecast to a seven-day one only in 2000.)"
Tornado Data Could Help Forecasters Increase Warning Times And Reduce False Alarms. Here's an excerpt of an interesting story from Jack Williams at
The Washington Post: "...
The
Goshen data confirms that a second rear-flank downdraft created a
secondary rear-flank gust front that strengthened, weakened and
strengthened again as the tornado formed, died out and then reformed,
she says. Supercells also produce front-flank downdrafts that spread out
as front-flank gust fronts racing out ahead of the storm as it moves
across the countryside. Many supercells, especially tornadic ones, have
rear-flank gust fronts, but it is not known how many have the recently
discovered secondary rear-flank gust fronts, says Josh Wurman, founder
of the Center for Severe Weather Research. He says the Goshen tornado
data increases researchers’ confidence that secondary rear-flank gust
fronts are important to tornado formation..."
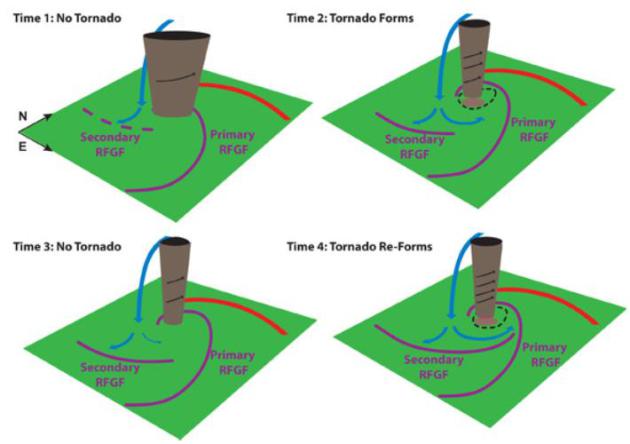
Graphic credit above: "
This drawing shows what happened to
the Goshen, Wyo., tornado over a period of 12 minutes. The blue arrows
are the rear-flank downdraft and the red line is the front-flank gust
front. The primary and secondary rear-flank gust fronts (RFGF) are
labeled." (Credit: Center for Severe Weather Research):
• 1) The weak circulation has not formed a tornado.
• 2) A tornado forms when part of the secondary gust front wraps around the circulation.
• 3) When the secondary gust front weakens winds drop below tornado speed and no funnel is seen.
• 4) The secondary gust front forms and the tornado re-forms and strengthens.
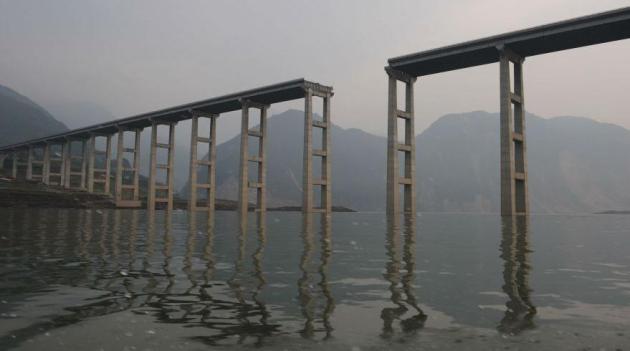
Did A Giant Dam Cause China's Latest Earthquake?
This isn't the first time I've heard of this effect - the weight of
(new) water overhead putting additional weight and stress on unstable
earthquake faults. Here's an excerpt from
Quartz: "...
Scientists
have long argued that the weight of water reservoirs can cause seismic
shifts that trigger tremors, also known as reservoir-induced
seismicity. (The Hoover Dam in the US, the Koyna Dam in India, and the Katse Dam in Africa are notable examples.) In 2009, Chinese researchers said the 150-meter tall Zipingpu dam (pdf), 5.5 kilometers from the epicenter of the Wenchuan quake, had clearly affected seismic activity and may have triggered a quake earlier than it would have naturally occurred. Yang Yong, a geologist in Chengdu, told the Financial Times (paywall) that the building of reservoirs in Sichuan province has caused more seismic activity...."
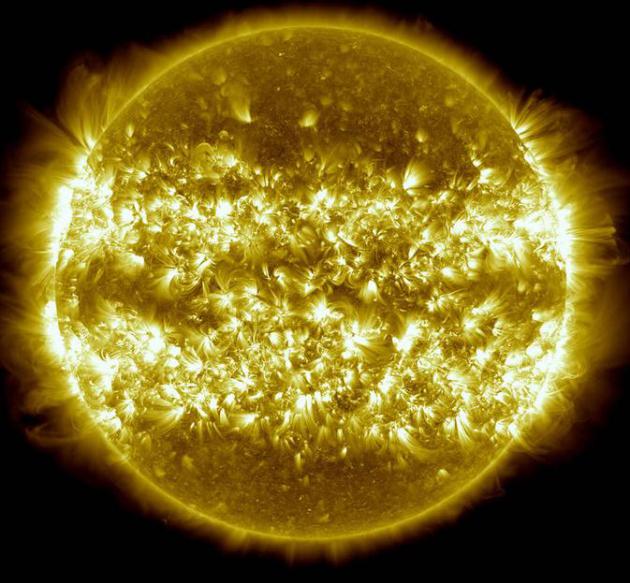
A Year Of Outbursts From The Sun. It would be ironic
if the next Black Swan event came from the sun, in the form of a solar
flare (CME) capable of disrupting communications, or even the power
grid. Here's an excerpt from Jason Samennow at
The Washington Post: "...
But currently, the sun is exhibiting plenty of signs of life and could unleash a flare directed at Earth. Writes Spaceweather.com:
Sunspot AR1726 has developed a ‘delta class’ magnetic field that
harbors energy for strong eruptions. This has prompted NOAA
forecasters to up the odds of M-class flares to 40% and X-class flares
to 15% within the next 24 hours. Because of the sunspot’s almost-central
location on the solar disk, any eruptions today would likely be
Earth-directed.
We’ll keep you posted on any solar flares, and whether they might
have any effect on our planet (e.g. on satellite/radio communication,
auroras, etc.)."
Image credit above: NASA/GSFC/SDO)
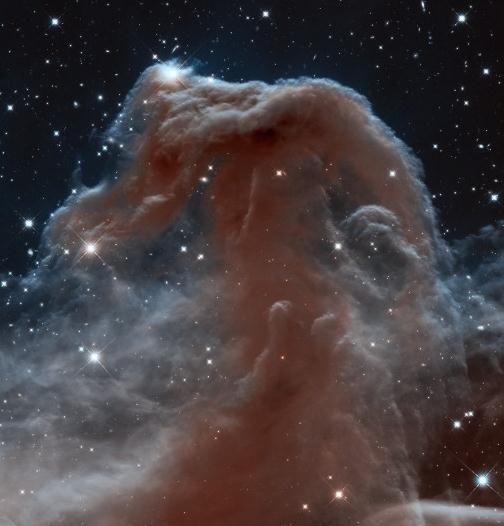
Hubble And Hershel Show The Horsehead Nebula In A Spectacular New Light. Here's an excerpt of a story that should interest astronomy buffs from
gizmag.com: "
New near-infrared and far-infrared views captured by NASA's Hubble Space Telescope and the European Space Agency's (ESA) Herschel space telescope
have provided a spectacular new look at the famous Horsehead Nebula.
The Horsehead Nebula lies some 1500 light-years away in the
constellation of Orion, just south of Alnitak, the most easterly star in
the famous belt. The nebula, also known as Barnard 33, spans
approximately five light-years and is a popular viewing target for both
amateur and professional astronomers..."
Image credit: "
Hubble's stunning near-infrared image of the Horsehead Nebula." (Image: NASA)
Flexible Electronics Could Transform The Way We Make And Use Electronic Devices. Here's an excerpt of an interesting story from
Penn State: "
Flexible
electronics open the door to foldaway smartphone displays, solar cells
on a roll of plastic and advanced medical devices -- if we can figure
out how to make them. Nearly everyone knows what the inside of a
computer or a mobile phone looks like: A stiff circuit board, usually
green, crammed with chips, resistors, capacitors and sockets,
interconnected by a suburban sprawl of printed wiring. But what if our
printed circuit board was not stiff, but flexible enough to bend or even
fold? It may sound like an interesting laboratory curiosity, but not to
Enrique Gomez,
an assistant professor of chemical engineering at Penn State. "It
could transform the way we make and use electronic devices," he says..."
Photo credit above: "
Example of a flexible-circuit film
displayed by a member of Professor Tom Jackson's Electronics Research
Group on Penn State's University Park campus." Image: Patrick Mansell
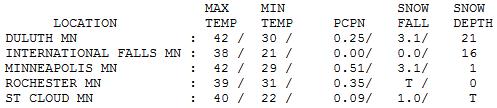
Tuesday Numbers. Another typical day, for late
February or early March. Duluth still reported a whopping 21" of snow on
the ground, 16" at International Falls. Highs ranged from 34 at
Alexandria to 40 St. Cloud, 42 Twin Cities and 46 up at Grand Marais.
TODAY: Partly sunny, late-day shower. Winds: SW 15+ High: 46
WEDNESDAY NIGHT: Gradual clearing. Low: 30
THURSDAY: Plenty of sun, a bt milder. High: 49
FRIDAY: Isolated shower, then PM sun - feels like spring! Wake-up: 38. High: 66
SATURDAY: Plenty of sun, greening lawns. Wake-up: 46. High: near 70
SUNDAY: Partly sunny and lukewarm - spring fever becomes an epidemic. Wake-up: 50. High: 73
MONDAY: Early thunder? Mild and humid. Wake-up: 52. High: 74
TUESDAY: Warm sun, touch of June. Finally. Wake-up: 55. High: 78
Climate Stories....
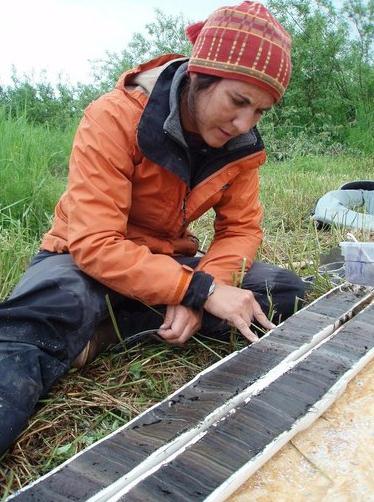
New Method Proves - Again - Climate Change Is Real. Scientific American has the story; here's an excerpt: "...
The locations of weather
stations, changes in instruments, the siting of weather stations in
warmer urban areas, changes in land cover and other issues have all been
cited as issues affecting the temperature trends often used to show
that our planet is in fact warming. Compo's method uses none of these.
Instead, the researcher and his colleagues use historic measurements of
air pressure and ocean temperatures, put into a model, to calibrate
surface temperatures over the 20th century. That project, called the 20th Century Reanalysis, gets those pressure data from historic data sources like ship logs and Army bases, which are compiled by volunteers at oldweather.org and ACRE,
two efforts that catalog old weather data and make them available to
researchers. Those many, many pieces of air pressure data help Compo and
his team piece together a snapshot of what was happening in the
weather at a given point in time; every six hours since the 1870s, in
fact..."
Image credit above: "
Compo's
method uses historic measurements of air pressure and ocean
temperatures, put into a model, to calibrate surface temperatures over
the 20th century."
Image: Flickr/Jeff Kubina
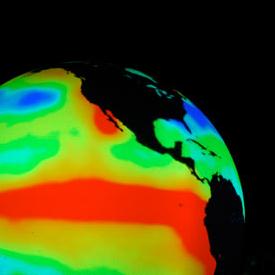
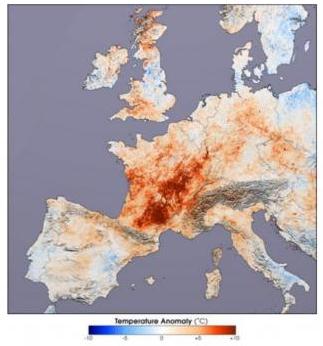
Earth Said To Be The Warmest In The Last 1,400 Years. Here's an excerpt from an article at
UPI.com: "
Earth's
temperatures increased more between 1971 and 2000 than during any
other three-decade interval in the last 1,400 years, U.S. researchers
say. Scientists at the Earth Institute at Columbia University said new
regional temperature reconstructions covering all seven continents show
the current ongoing period of man-made global warming reversed a
natural cooling trend that lasted several hundred years. The
reconstructed the temperature history of Earth's continents by
analyzing climate data from tree rings, pollen, cave formations, ice
cores, lake and ocean sediments, and historical records from around the
world, a Columbia release said Monday..."
Graphic credit above: "
During Europe's 2003 heat wave, July temperatures in France were as much as 18 degrees F hotter than in 2001." Credit: NASA
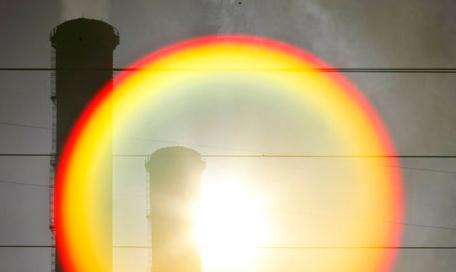
Climate Change's Human Connection Explained. Friend and colleague, Dr. Michael Mann at Penn State, explains in this story at
Huffington Post; here's an excerpt: "...
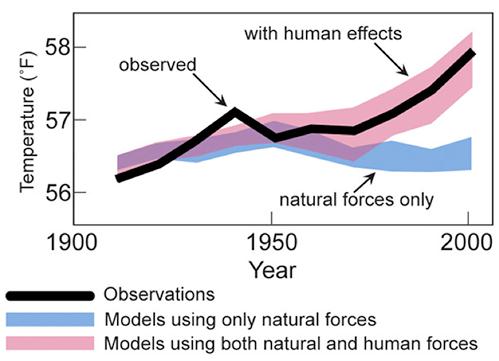
Finally,
perhaps most significant of all, only when human factors were included
could the models reproduce the observed warming—both its overall
magnitude and, equally important, its geographical pattern over Earth's
surface and its vertical pattern in the atmosphere. The primary such
human factor was increasing greenhouse gas concentrations due to fossil
fuel burning and other human activities. A secondary human factor,
sulfate aerosols emitted from industrial smokestacks, also played a
role, however. Like volcanic sulfate aerosols, these industrial
aerosols have a cooling effect. Unlike volcanic aerosols, which reach
the lower stratosphere, allowing them to spread out into a layer
covering the globe, industrial aerosols remain confined to the lower
atmosphere, leading to localized patterns of cooling that off set
global warming in some regions. The pattern of warming predicted by the
models from the combination of these two human effects on the climate
provide a unique "fingerprint" of what the human influence on climate
should look like if the models were correct, and the fingerprint
matched. The surface and lower atmosphere showed an irregular pattern
of warming, while the atmosphere aloft was cooling, just as the models
indicated it should. The fingerprint predicted for natural factors
alone—for example, from fluctuations in solar output—on the other hand,
failed to match the observations..."
Graphic credit above: "
Observed
Global Temperatures (black curve) compared with the spread among model
simulations that include only natural factors (blue band) and that
include both natural and human factors (red bad). Only the model
simulations that include human factors are able to reproduce the
observed warming [from Second Assessment of the U.S. Global Change Research Program, 2009]."
A Republican Senator On Climate Change: "It's Real, We Need To Fight It." Here's an excerpt from a story at Fortune and
CNN Money: "...
Unlike
many of her Republican colleagues in the Senate, Murkowski believes
that climate change is real. She adds: "It doesn't make sense to argue
about how much global warming is caused by man—whether it's 5% or 50%.
The best approach is to have a no regrets policy." To combat climate
change, she argues that the nation needs to pursue all forms of energy
but to move more towards cleaner and cleaner fuels as time progresses.
"We owe it to ourselves to keep healthy this marvelous world we've been
given..."
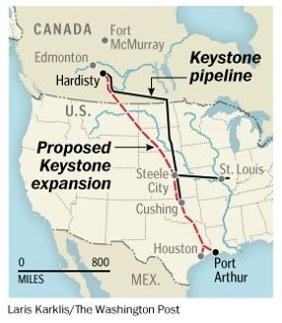
State Department Criticized By EPA On Pipeline Report. Here's an excerpt from
The New York Times: "
The Environmental Protection Agency sharply criticized the State Department’s impact statement for the proposed Keystone XL oil pipeline, saying the report failed to adequately consider the climate change
impacts of building the pipeline or to realistically assess alternative
pipeline routes or modes of transport. In a relatively unusual public
squabble between agencies, a top E.P.A. official said in a letter
to State Department officials that the department’s latest
environmental statement for the 1,700-mile pipeline provided
“insufficient information” to adequately judge the project, and that the
E.P.A. could not sign off on the pipeline unless more complete studies
were performed..."
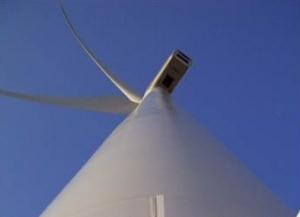
The $25 Billion Impact Of The Wind Industry. Here's a clip of an interesting story at
greentechmedia.com: "
In
a record-setting year, the U.S. wind industry’s 28 percent growth
boosted its job count back to 80,000 and had a discernible impact on the
U.S. gross domestic product (GDP) by putting $25 billion in private
investment to work, according to the industry’s newly released Annual Market Report.
When the U.S. Department of Commerce revised its estimate of Q4 2012
GDP growth up from 0.1 percent to 0.4 percent, it noted as significant
the increase in its estimate for nonresidential structures growth to
16.7 percent, up from 5.8 percent, according to IHS Global Insight
(NYSE:IHS) economists and verified by the Commerce Department’s Bureau of Economic Analysis (BEA)..."
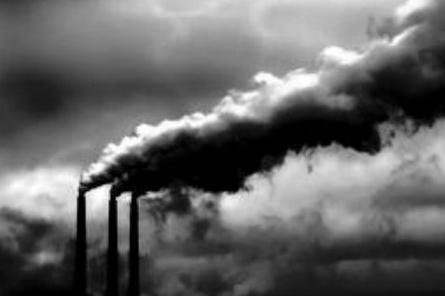
Supreme Court Asked To Hear EPA Greenhouse Gas Challenge. Here's the intro to a story from
Thomson Reuters: "
Top industry groups and a dozen states have asked the Supreme Court
to review a lower court decision upholding the Obama administration's
plan to limit greenhouse gas emissions generated by power plants and
vehicles. The parties, which had until Friday to submit petitions to the
high court, are challenging a 2012 decision by the D.C. Circuit Court
of Appeals that upheld rules issued by the Environmental Protection Agency
(EPA). The petitioners attacked the rules on various grounds, but all
argued that the agency should not use the Clean Air Act to regulate
carbon emissions. "EPA's ill-founded regulations represent a sweeping
expansion of its regulatory power under the Clean Air Act and would
impose new requirements on potentially millions of stationary sources
across the country," the American Chemistry Council (ACC) said on
Thursday..."
Global Warming Study Suggests Human Causes Dating Back To 1800s.
NBC News has the story; here's an excerpt: "
A
long-term global cooling trend ended in the late 19th century, a
reversal in temperature that cannot be explained by natural variability
alone, according to a new study. The finding stems from
2,000-year-long continental-scale temperature records inferred from tree
rings, ice cores, lake sediments and other so-called proxies from
around the world. The records show variations in temperature caused by
changes in Earth's orbit, output of solar energy, and volcanic
eruptions, noted Nicholas McKay, a climate scientist at Northern Arizona University and study co-author..."
Photo credit above: Darrell S. Kaufman / Northern Arizona University. "
Kristi
Wallace of the Alaska Volcano Observatory examines a lake sediment
core from southern Alaska that shows intricate layering indicating
environmental and climatic changes over centuries."
This Faith In The Markets Is Misplaced: Only Governments Can Save Our Living Planet.
I understand why many conservatives and big businesses are nervous
about the implications of climate change. Their knee-jerk reaction: this
will lead to expansion of government, more regulation...socialism! Once
government sets a price on carbon (as it would for any other pollutant)
the markets can react, and invest with greater confidence. Innovation
will be critical for the new technologies necessary to power our
economies (without a heavy reliance on fossil fuels). But until we have
that price signal in the markets, it's like shooting in the dark.
Companies are loathe to invest, not knowing if they're just pouring
money down a dark hole. Some (smart) combination of government guidance
and market innovation will be required. Here's an excerpt of an Op-Ed at
The Guardian: "
In
other ages, states sought to seize as much power as they could. Today,
the self-hating state renounces its powers. Governments anathematise
governance. They declare their role redundant and illegitimate. They
launch furious assaults on their own branches, seeking wherever
possible to lop them off. This self-mutilation is a response to the
fact that power has shifted. States now operate at the behest of
others. Deregulation, privatisation, the shrinking of the scope, scale
and spending of the state: these are now seen as the only legitimate
policies. The corporations and billionaires to whom governments defer
will have it no other way..."
Photo credit above: "‘
Why were too many permits issued?
Because of the lobbying power of big business. Why did MEPs refuse to
withdraw them? Because of the lobbying power of big business.' Photograph: Mick Tsikas/Reuters.


Hi there, awesome site. I thought the topics you posted on were very interesting. I tried to add your
ReplyDeleteRSS to my feed reader and it a few. take a look at it, hopefully I can add you and follow...
Pressure Calibration