74 F. high in the Twin Cities Wednesday.
71 F. average high on September 19.
61 F. high on September 18, 2012.
.14" rain fell at MSP International Airport yesterday.
Slight severe storm risk thru early afternoon - better chance of hail, high winds over Wisconsin.
Half as much water in the air by Friday evening.
 A "Chopped-Up" Summer
Live
long enough and you'll see just about everything. Even a summer like
2013. Going from half an inch of snow on May 3 to 98F on May 14 should
have been a tip-off that we were in for a wild ride.
A June 21
"solstice storm" that surprised meteorologists with its straight-line
wind ferocity, downing thousands of trees. A mid-summer cool snap (frost
in Embarrass in early August?), then a record-setting late summer heat
wave.
Meteorological summer was 1.6F warmer than average, compared
to 3.5F last summer. 19 days above 90F; the 15th stickiest summer since
1945 - most of those muggy days coming around Labor Day. Odd. After a
wet June rainfall went over a cliff - again. Much of the state is
running a 2 to 5 inch rainfall deficit, with a growing stain of
moderate/severe drought.
One benefit of the drought and 4 week
mid-summer chill? Only 10 tornadoes in Minnesota this year, all weak.
See, there is a silver lining.
A passing T-storm (a few isolated
cells may be severe) today marks the approach of the next cool surge.
Saturday highs hold in the 60s under a sunny sky, 40s at night chilly
enough for the furnace to kick in. Lukewarm 70s return next week.
We're
watching the Gulf. Tropical Storm Jerry may form soon, but the risk to
the Gulf Coast has dropped overnight. Details below.
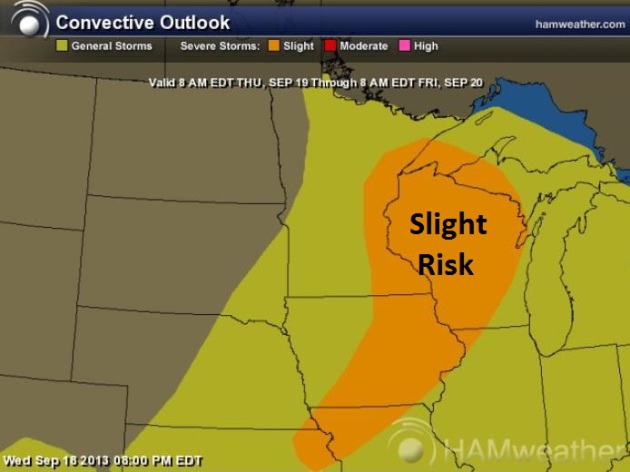
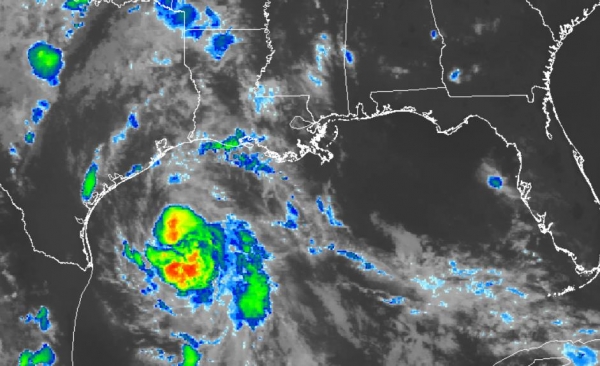
Slight Severe Storm Threat.
The best chance of a few strong to severe storms will be over Wisconsin
today, but a squall line of intensifying storms may blossom close to
the MSP metro area by afternoon, strengthening as it passes east of the
St. Croix. Watches and warnings may be issued later today. Map: NOAA SPC
and
Ham Weather.
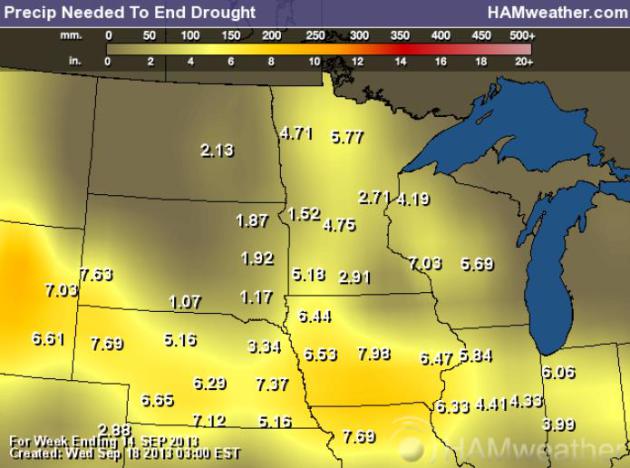
Rainfall Needed To End Drought. According to NOAA and USDA anywhere from 2.5" to 5" of rain is needed to ease the ongoing rainfall deficit. Map: Ham Weather.
Mild Spin.
After peaking near 70F today, dew points drop into the 40s by late
Friday and Saturday, meaning less than half as much water in the air.
After a flurry of light jackets and sweatshirts over the weekend highs
surge into the 70s next week, maybe 80F a week from tomorrow. Graphic:
Weatherspark.
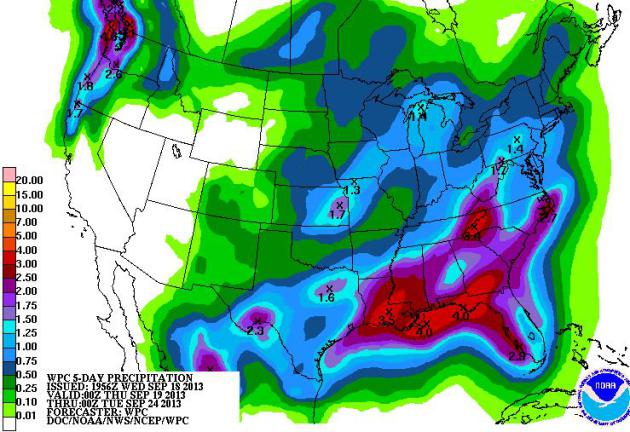
Gulf Coast Soaking.
Regardless of whether "Jerry" moves toward the Gulf Coast moisture
streaming north will spark very heavy rains and possible flash flooding
with 3-5" rains possible from New Orleans to Pensacola and Knoxville.
QPF 5 day rainfall map: NOAA.
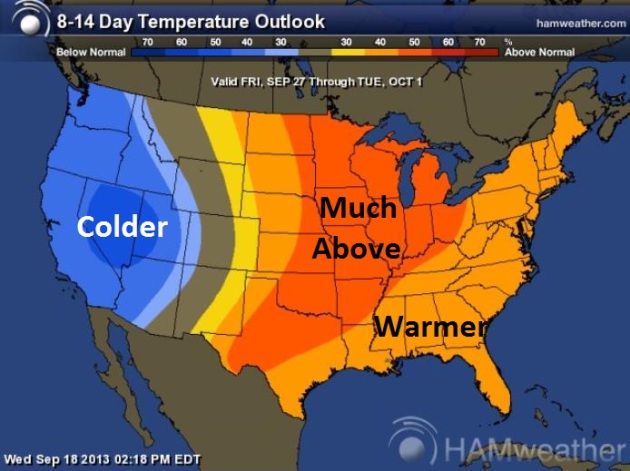
Warm Bias.
Long-range models keep temperatures well above average into the end of
September; no 90s in sight, but more 70s, even a few 80s. The warmest
temperatures in late September are forecast over the Plains, Midwest and
Great Lakes, a swing to much colder weather for the far west. Map: NOAA
CPC and Ham Weather.
A Few More Warm Fronts.
Winter is not lurking around the corner, at least not yet. GFS guidance
shows more 70s and a few days in late September and early October above
80F. With any luck we'll see a few more healthy soakings - best chance
the first few days of October.
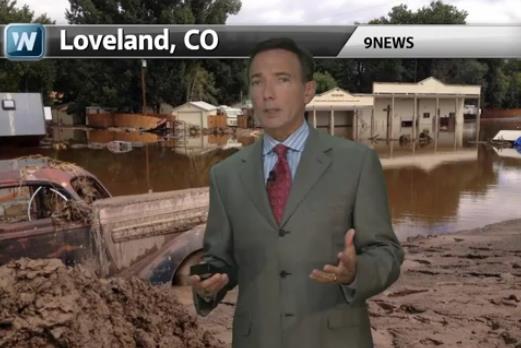
1 In 1,000 Year Flood For Colorado - Tropical Storm Potential Gulf Coast - 4th Warmest August On Record. That's way too much to pack into one 2:30
Climate Matters segment, but I gave it a shot anyway: "
WNTV
Chief Meteorologist Paul Douglas looks at some of the incredible damage
strewn across Colorado due to the historic flooding in the region.
Also, will hurricane Jerry form in the Gulf of Mexico? Climate change
was more than likely a factor, especially when the world experienced its
342nd month above the 20th century average."
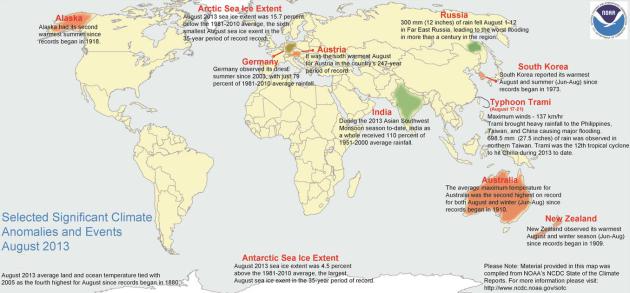
4th Warmest August On Record Worldwide.
That's factoring land and ocean temperatures across the planet, tying
2005 for the 4th warmest August since 1880. More details from
NOAA NCDC:
- The
combined average temperature over global land and ocean surfaces for
August 2013 tied with 2005 as the fourth highest in the 1880–2013
record, at 0.62°C (1.12°F) above the 20th century average of 15.6°C (60.1°F).
- The global land surface temperature was 0.77°C (1.39°F) above the 20th century average of 13.8°C (56.9°F), the 11th warmest August on record. For the global oceans, the August average sea surface temperature was 0.57°C (1.03°F) above the 20th century average of 16.4°C (61.4°F), tying with 1998, 2003, 2005, and 2009 as the record highest for August.
- The combined global land and ocean average surface temperature for the June–August period was 0.62°C (1.12°F) above the 20th century average of 15.6°C (60.1°F), tying with 2009 as the fifth warmest such period on record.
Alerts Broadcaster Briefing: Issued early Thursday morning, September 19, 2013.
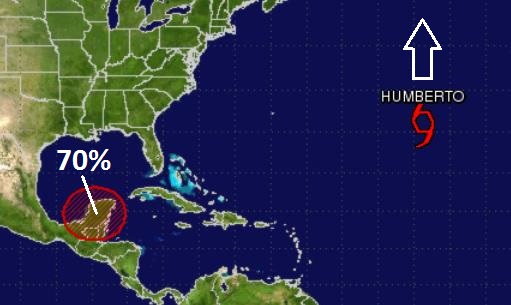
* 70% chance of tropical storm formation in the Gulf of Mexico next 48 hours.
*
Models pull back on possible Florida Panhandle late in the weekend or
early next week - "Jerry" should still strengthen into a tropical storm,
but probably stall in the southwestern Gulf of Mexico into the weekend.
Some risk to the Gulf Coast remains,
but the potential for a significant hurricane over the next 3-5 days impacting the USA has dropped overnight.
*
Major Category 3-4 Hurricane (typhoon) formation likely in the western
Pacific, posing some risk to the Philippines, Taiwan and mainland China.
Ripe For Tropical Storm Development.
Tropical Depression "Invest 95" is still expected to become Tropical
Storm Jerry, but the storm has weakened considerably crossing Mexico's
Yucatan Peninsula overnight. Strengthening is likely over the warm
waters of the Bay of Campeche, but the risk of hurricane formation into
the weekend has dropped off in the last 6-12 hours.
NHC Probabilities.
The National Hurricane Center has kept the potential for Gulf of Mexico
tropical storm formation in the next 48 hours to 70%. Humberto is
forecast by all models to sweep into the North Atlantic - no risk to the
USA.
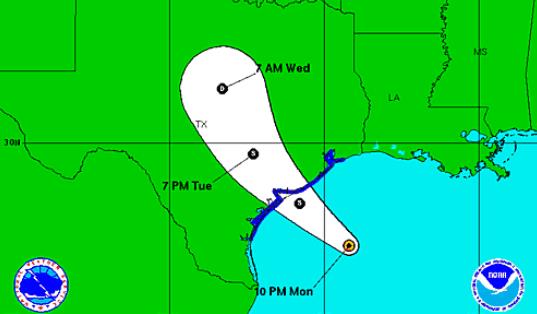 Major Shift In "Jerry" Outlook
.
Earlier runs brought a potential hurricane into the northeastern Gulf
of Mexico. The latest runs suggest that "Jerry" will form in the
southwestern Gulf of Mexico, and reach tropical storm status, but NOT a
hurricane, meandering off the coast of Mexico for 3-4 days. A strike on
the USA Gulf Coast is still possible next week but the probability of a
strike early next week has fallen substantially.
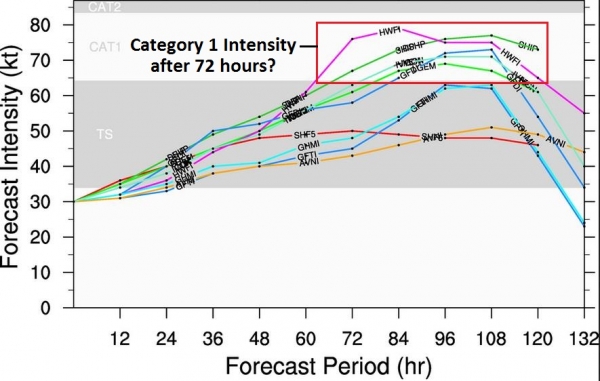 Tropical Storm Jerry
.
A majority of models strengthen "Invest 95", the tropical depression
near Mexico's Yucatan Peninsula, into a tropical storm within 36 hours,
but the latest runs suggest hurricane force is unlikely looking out at
least 4-5 days.
Confidence levels are still low.
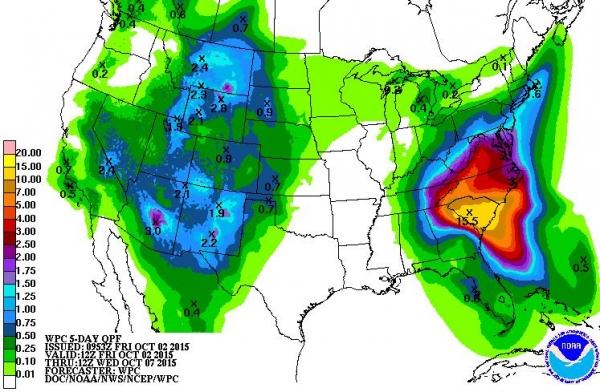 Flash Flood Potential
.
Although the center of "Jerry" may remain over the western or
southwestern Gulf of Mexico into the weekend, moisture form this
tropical system will flow north, fueling an eastbound frontal system,
squeezing out 2-5" rains from Texas into much of the Mid South and Gulf
Coast. The greatest potential for flash flooding into the weekend will
come from Houston and New Orleans to Mobile, Pensacola and Macon,
Georgia.
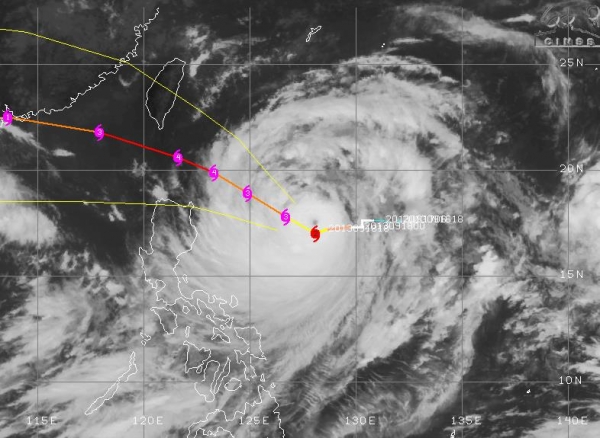
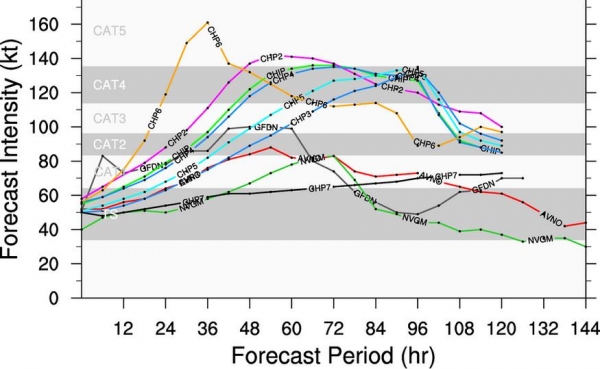
Significant Typhoon Potential Western Pacific.
Models are hinting at rapid intensification for a storm spinning up
east of the Philippines, expected to grow into at least a Category 3-4
hurricane, passing midway between the Philippine island of Luzon and
Taiwan. On the predicted path portions of Taiwan may receive a damaging
storm surge and extreme rains capable of flash flooding and mudslides by
Saturday (U.S. time).
Super-Typhoon Potential.
Some of the models grow this typhoon (same thing as a hurricane) to
Category 4 strength within 60-72 hours, followed by rapid weakening as
the storm pushes into coastal China in 3-4 days.
Summary:
On Wednesday morning we told you that the confidence level with "Jerry"
was low, and for good reason. Latest models are showing a much
different solution, with Jerry only reaching tropical storm force,
stalling and possibly weakening over the southwestern Gulf of Mexico.
Some risk remains to coastal Texas and the entire Gulf of Mexico - Jerry
could still be swept northeastward next week,
but the overall threat to the USA has dropped fairly significantly overnight.
That said, it pays to be perpetually paranoid; we still need to
carefully monitor this storm - it's too early to let our guard down.
In
addition, a much stronger Category 3-4 hurricane/typhoon is forecast to
push across the western Pacific over the next 3 days, posing some risk
to the Philippines and Taiwan, although right now computer models
suggest there will not be a direct strike on either Manila or Taipei
with this potential Super Typhoon passing between the Philippines and
Taiwan. Another update late Thursday morning.
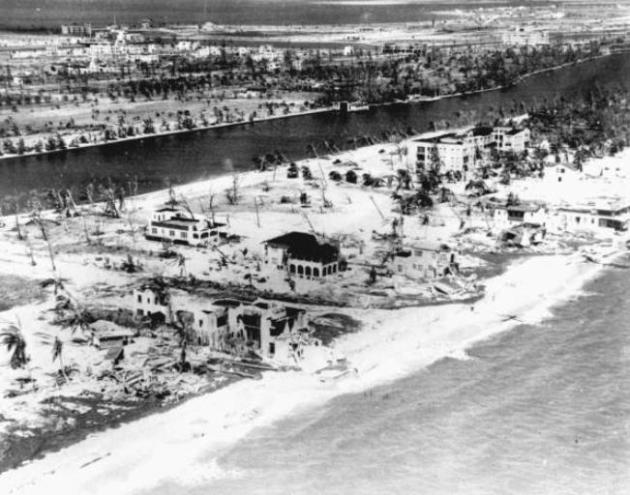
The Great Miami Hurricane Of 1926. NOAA has an
amazing accounting of the historic storm that passed right over Miami on September 17, 1926; here's an excerpt: "...
The
eye of the hurricane, with its period of relative calm, passed over
downtown Miami and parts of Cocoanut Grove and South Miami around 630 AM
on September 18. Residents of the city, unfamiliar with hurricanes,
thought the storm was over and emerged from their places of refuge out
into the city streets. People even began returning to the mainland from
Miami Beach. The lull lasted only about 35 minutes, according to Gray,
during which the streets became "crowded with people". The worst part
of the hurricane, with onshore southeasterly winds bringing a 10 foot
storm surge onto Miami Beach and the barrier islands, began around 7 AM
and continued the rest of the morning. At
the height of the storm surge, the water from the Atlantic extended all
the way across Miami Beach and Biscayne Bay into the City of Miami for
several city blocks. On October 9, well after the hurricane, the
Red Cross reported that 372 persons had died in the storm and over 6,000
persons were injured. Damages in 1926 dollars were estimated at $105
million, which would be more than $100 billion in today's dollars..."
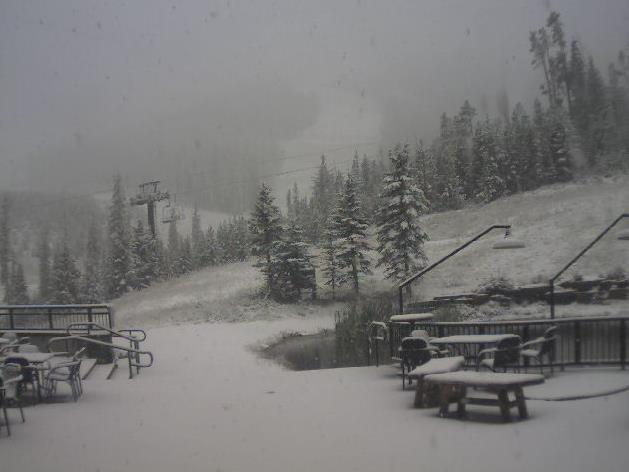
And So It Begins.
Check out the accumulating snow falling on the Moonlit Basin webcam at
The Big Sky Ski Resort, courtesy of the Great Falls, Montana National
Weather Service. Let the games begin!
Highest Paid Public Employees. Here is one of a long list of fascinating maps that attempt to describe the world, courtesy of
slightlywarped.com. Rated PG for mild profanity.
An RV For The Apocalypse.
If the standard Winnebago just won't get the job done, and you want the
ultimate rig when you flee the city for the hills (and the anarchy to
come), consider this uber-machine, courtesy of
Gizmag: "
The
2013 Dusseldorf Caravan Salon was stuffed hall to hall, wall to wall
with RVs, camping trailers, pop-ups and mobile living equipment of all
kinds. Perhaps it's the timelessly romantic appeal of conquering
anything the Earth puts in your way to enjoy its bounty, but we were
particularly impressed with some of the rugged, off-road-capable
campers. We've put together a tour of every off-road model we found,
designs that range from tented gear haulers to full-blown tactical 8x8s..."
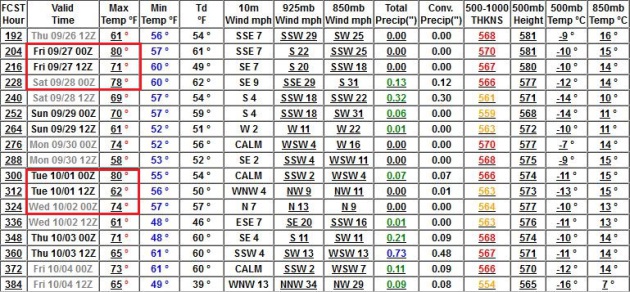
TODAY: Unsettled, Passing T-storms, some strong morning and midday. Dew point: 67. Winds: W/SW 10-15. High: 82
THURSDAY NIGHT: Evening shower, then partial clearing, windy - turning cooler. Low: 57
FRIDAY: More clouds than sun. Cool and brisk. Winds: NW 15+. High: 67
SATURDAY: Cool sun, less wind. Dew point: 40. Winds: NE 3-8. Wake-up: 46. High: 66
SUNDAY: Blue sky, a bit milder. Winds: SE 10-15. Wake-up: 45. High: 72
MONDAY: Fading sun, late thunder chance. Wake-up: 52. High: 75
TUESDAY: More sun, warmer than average. Wake-up: 54. High: 74
WEDNESDAY: Warm sun, touch of late August. Wake-up: 56. High: 78
* harvest moon photo above courtesy of mnheadhunter and
Instagram.
Climate Stories....
Did Climate Change Worsen The Colorado Floods? Here's an excerpt of an explanation from Chris Mooney at
Mother Jones: "...
Furthermore, the rainfall on the Front Range was exacerbated by a so-called atmospheric "blocking pattern,"
which produced a situation of stuck weather, in which one pattern
(unending rain) persisted for a long period of time. "We had this giant
cutoff low sitting over Salt Lake City, dredging up a continuous stream
of tropical moisture," explains Minnesota meteorologist Paul Douglas, who is founder of the Media Logic Group and has been frequently outspoken about the reality of climate change from a Republican political perspective.
And here's the first possible climate linkage: The idea that the jet
stream has been altered as a result of climate change, leading to more
stuck weather and more blocking patterns, is a serious one, and one that
has also been brought up in relation to the odd behavior of Superstorm
Sandy. "I've noticed since last September, since the record ice loss in
the Arctic, that the jet stream has been misbehaving, more blocking
patterns in general over the northern hemisphere," says Douglas. He's
not the only one: Jennifer Francis of Rutgers University has led the
scientific charge when it comes to the connection between Arctic sea ice
loss and mid-latitude weather extremes (for further explanation, see here)...."
Image credit above: "
Satellite imagery showing tropical moisture being pulled from the coast of Mexico up to Colorado."
Cooperative Institute for Meteorological Satellite Studies, University of Wisconsin-Madison.
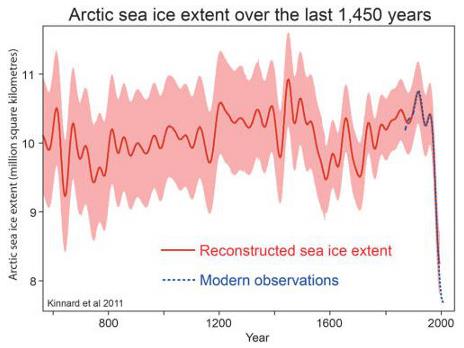
Arctic Sea Ice "Recovers" To It's 6th Lowest Extent In Millenia.
A significant "recovery" in Arctic Sea ice this summer? Not so much,
not in a historical time-frame, according to the authors of a story at
The Guardian; here's a clip: "...
A study published in 2010 by 18 leading Arctic experts examined Arctic records throughout geologic history and concluded,
"The
current reduction in Arctic ice cover started in the late 19th century,
consistent with the rapidly warming climate, and became very pronounced
over the last three decades. This ice loss appears to be unmatched over
at least the last few thousand years and unexplainable by any of the
known natural variabilities."
Thus the scientific
data and literature indicate that this year's minimum Arctic sea ice
extent is not just the 6th-lowest in the past 34 years, but most likely
the 6th-lowest in at least the past few thousand years.The current
Arctic sea ice decline is remarkably rapid, and often referred to as a
"death spiral." As Dr. Julienne Stroeve from the National Snow and Ice
Data Center (NSIDC) told The Guardian,
"Overall,
the Arctic has lost about 40% of its sea ice cover since 1980. Most
scientists believe the Arctic could be entirely ice-free in the summers
by the middle of the century – if not sooner."
Graphic credit above: "
Reconstructed Arctic sea ice extent over the past 1,450 years, from Kinnard et al. (2011)."
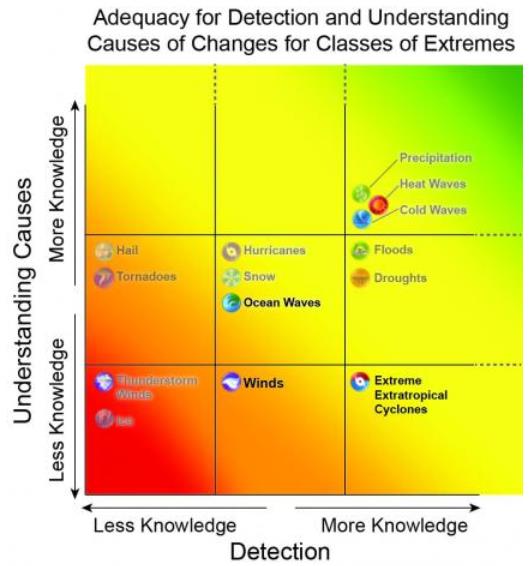
Monitoring And Understanding Changes In Extremes: Extratropical Storms, Winds & Waves.
Climate science is a moving target, with varying degrees of confidence
when it comes to attributing specific extreme weather events to a warmer
(in many cases wetter) atmosphere. Confidence levels are fairly high
that extreme floods, droughts and extratropical cyclones (similar to
Sandy) are being impacted by climate change, but the linkage is more
tenuous when it comes to hail, ice and tornadoes. Here's the latest
release from
NOAA NCDC that caught my eye: "
Extreme
weather can cause injuries, causalities, and billions of dollars in
damages. Since 1980, the United States alone has sustained well over 100
weather and climate disasters where damage exceeded one billion U.S. dollars.
Monitoring and understanding changes in these extreme events allows
governments, industries, and individuals to better anticipate future
natural disasters and decide how to make preparations and alert their
constituents and families. In an effort to further understanding of
three types of these extremes, scientists examined changes in extreme
extratropical storms, winds, and waves in a new scientific assessment—Monitoring and Understanding Changes in Extremes: Extratropical Storms, Winds, and Waves—that will be published in the Bulletin of the American Meteorological Society..."
Graphic credit above: "
Authors’
assessment of the state of knowledge regarding 600 changes in various
climate extremes. The horizontal axis depicts how useful the data
actually are for assessing historical changes. The vertical axis depicts
how well the mechanisms driving changes are understood. For each axis,
phenomena are assigned to one of three categories of knowledge, and the
dashed lines toward the upper right imply that knowledge about the
phenomena is not complete. Extremes discussed in previous assessments
appear in grey text."


Please comment
ReplyDeletehttp://www.dailymail.co.uk/news/article-2420783/Worlds-climate-scientists-confess-Global-warming-just-QUARTER-thought--computers-got-effects-greenhouse-gases-wrong.html