77 F. high on Tuesday in the Twin Cities.
65 F. average high on October 1.
72 F. high on October 1, 2012.
Cold rain for Minnesota Friday into Saturday, possibly mixing with wet snow near the Dakota border.
Plowable snow for the central/eastern Dakotas?
Cold, Wet Slap
You
may be running on Sunday - just to stay warm. The first significant
"Canadian Intrusion" of the winter season arrives this weekend, preceded
by heavy rain - followed by an almost November-like breeze by Sunday.
Any sun early Sunday will give way to low, lumpy stratocumulus clouds;
temperatures stuck in the 40s with a whiff of wind chill for runners
(and spectators) participating in this year's Medtronic Twin Cities
Marathon. It will be a chilly race; any instability showers and
sprinkles probably holding off until afternoon (when I will triumphantly
cross the finish line on my Segway Scooter).
Enjoy 70s with fading sun today; a few T-storms may get your attention tonight.
The
biggest storm in 5 months will spin up, pushing two surges of rain
across Minnesota. The first wave of rain arrives Thursday, a second
soaking possible Friday afternoon into midday Saturday. Some 1-2 inch
amounts are possible, especially north & west of MSP. Cold exhaust
follows the storm, temperatures aloft ALMOST cold enough for a few stray
flurries close to home Sunday evening.
Gulp.
Payback for a September 5.2F warmer than average? Perhaps. Don't despair, more 60s are brewing by mid-October.
1.29" rain predicted for the Twin Cities by Saturday morning (NAM model).
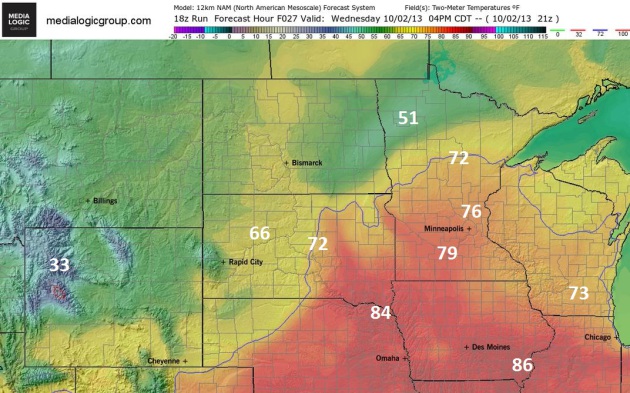
Last Lukewarm Day.
NAM model data shows another day with highs well up into the 70s over
much of central and southern Minnesota, while holding in the 50s over
the Red River Valley. A 30-degree temperature extreme will help to spin
up a major storm by Thursday. Map above valid 4 PM courtesy of Ham
Weather.
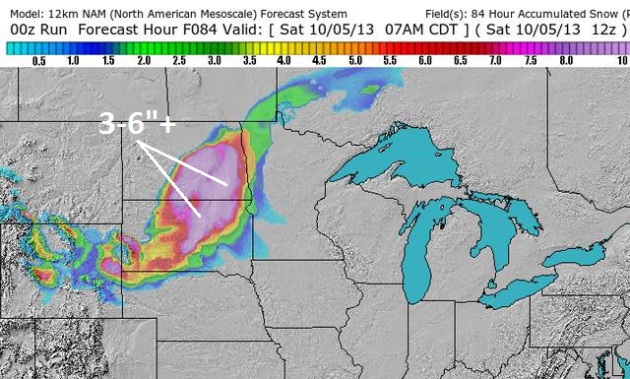
Serious Reality Check.
It's still early; my trust in the models is lower than usual, but the
12km NAM is suggesting a p-p-plowable snowfall for portions of the
central and eastern Dakotas Friday and Saturday with winds topping 40
mph. Near-blizzard conditions can't be ruled out late in the week.
Lovely! Model map: Ham Weather.
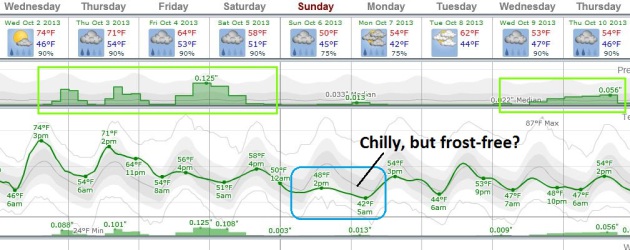
Sliding Into A Wetter Pattern.
A few T-storms are possible by tonight, steadier, heavier stratiform
rain Thursday, a second wave of rain late Friday into Saturday. A few
instability showers and sprinkles are possible Sunday afternoon, but
skies should be dry (and mostly cloudy) for the Twin Cities Marathon
Sunday morning. Graph: Weatherspark.
Tug-Of-War.
A fresh surge of chilly, Canadian air will cause the jet stream winds
aloft to buckle, pulling moisture from the Gulf of Mexico north, a sharp
gradient in temperature whipping up an intense storm capable of
significant rain from the Dakotas to the Great Lakes tonight into
Friday. NAM model data courtesy of NOAA and Ham Weather.
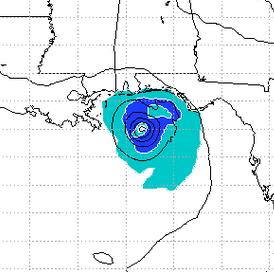
Strongest Midwestern Storm In 5 Months?
Ingredients are converging for a significant rain event, possibly
enough moisture to put a sizable dent in our drought. GFS model
animation above shows predicted 10 meter wind speeds and pressure. Note
the appearance of a storm in the Gulf of Mexico, a depression that may
strengthen into Tropical Storm Karen in the days ahead. Animation:
Ham Weather.
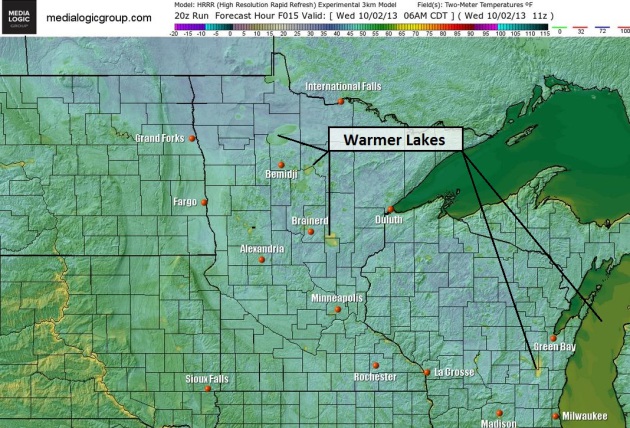
High-Res Model Data.
3 km. HRRR model data shows amazing detail, including warmer lake
temperatures at 6 AM this morning. Lakes take longer to warm up and cool
down than land, a phenomenon that will result in lake effect snow
squalls in about 30-60 days, mainly downwind of the Great Lakes. Map:
Ham Weather.
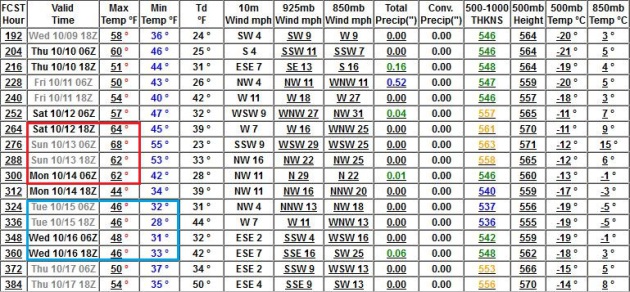
Another Mild Front, And First Frost?
GFS data shows a potential for 60-degree highs the weekend after next
(October 12-13), followed by a cold front that may lead to the first
metro frost of the season, coming about 2 weeks from today. Circle your
calendar.
Tropical Storm Karen?
Many of the models we study are strengthening a tropical disturbance
(“Invest 97”) east of Mexico’s Yucatan Peninsula, and I believe there’s a
40-50% chance it will become Tropical Storm Karen within 2-3 days. I
don’t expect a full-blown hurricane right now,
but a tropical storm could pose a risk of moderate storm surge flooding and very heavy inland river/urban flooding.
The risk appears to be highest between New Orleans and Pensacola,
centered on Mobile, but that will almost certainly change in the days
ahead. The flood risk would extend from Mobile and the Florida Panhandle
into Georgia, possibly the higher terrain of the Appalachians as the
storm accelerates northeast. I see no evidence that it will stall right
now, which would prolong/height the inland flooding risk.
* but
the European (ECMWF) model isn't picking up on this system strengthening
in the Gulf, at least not yet, so I'm discounting this solution a bit
(for now).
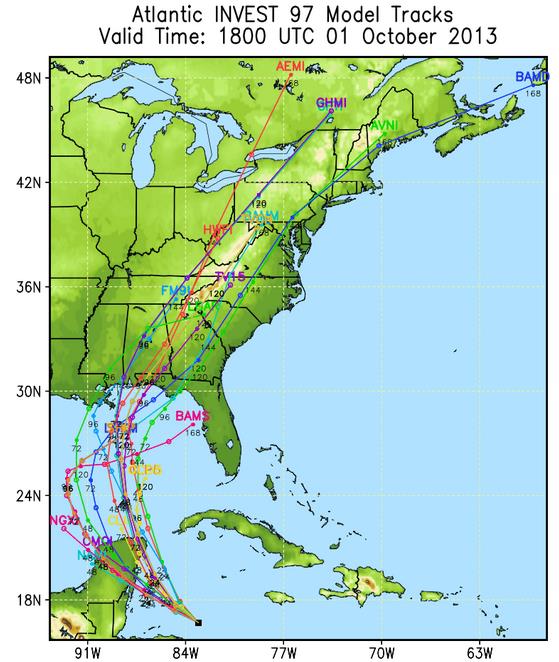
Early Track Predictions.
The models are in fairly good alignment, but we’ve been burned before
this season. Too early to press the panic button, but mild paranoia is
called for.
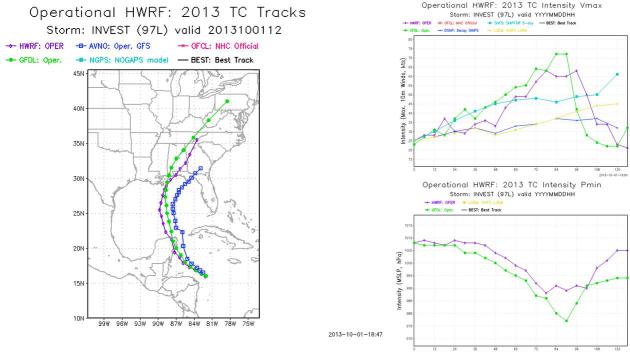
HWRF Solution.
Parts of NOAA are shut down as part of the government closure, thank
GOD the models are still working. NOAA’s most reliable/powerful model
brings “Karen?” to near Mobile or Pensacola in 4-5 days, with a possible
landfall Sunday or early Monday. It’s still too early to get more
specific than that.
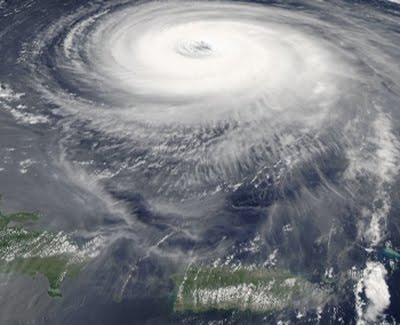
As Peak Storm Season Fades, Gulf Becomes Target.
I don't see any short-term tropical threats, and October will
(probably) mirror the entire hurricane season, trending much lower than
average in the Atlantic and Caribbean. But the threat isn't zero, not
yet, especially over the Gulf Coast and Florida. Here's an excerpt from
HeraldTribune.com: "...
A
variety of factors have contributed to the dry atmosphere, he said,
including a drought in Brazil, “super dry” air blowing off Africa from
the Saharan dessert, and a global weather pattern that is currently
generating downdrafts of dry, sinking air over the tropical Atlantic.
“Tropical storms like to have updrafts to sustain them and if you have
downdrafts you're squashing tropical storm activity,” Masters said,
adding that “the odds are less than usual that we'll see tropical storm
activity” in October..." (Image above: NASA).
Why Scientists Were Wrong About This Year's Hurricane Season. Here's a segment of a very good explanation of why the Atlantic has been eerily quiet in recent months, courtesy of
National Geographic: "
An
infusion of very dry air over the Atlantic Ocean has kept the 2013
hurricane season from being the stormy summer that forecasters expected
it to be in June. "A lot of people are scratching their heads right
now," said Keith Blackwell,
professor of meteorology at the University of South Alabama in Mobile.
"Everybody was wrong in their long-range predictions." A high-pressure
system known as the Azores-Bermuda High
that often parks over the Atlantic Ocean during the summer is the
reason so much dry air has moved over the Atlantic, scientists say. The
Azores-Bermuda High often has a significant influence on the direction
tropical storms take as they move northward..."
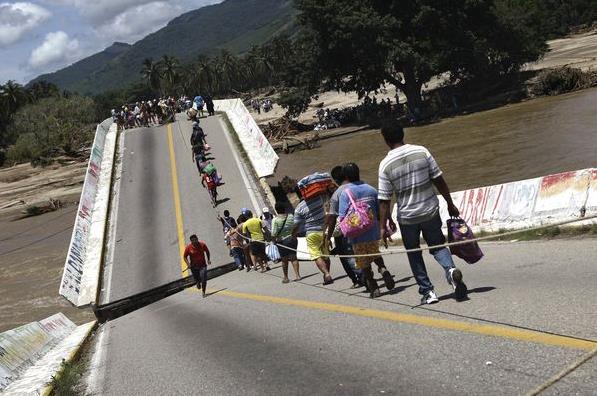
Photo credit above: "Villagers
cross a collapsed bridge near Acapulco which was the hardest hit
following the heavy rains unleashed by Hurricane Manuel last week." Photograph by Henry Romero, Reuters
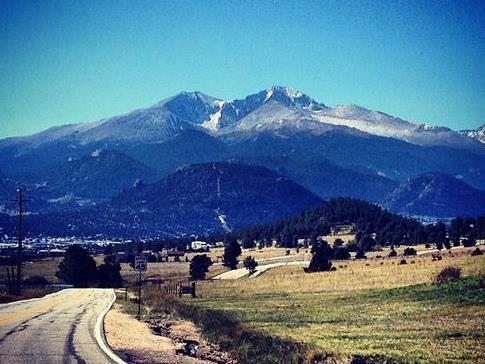
Reporter's Notebook: Witnessing Colorado Flood Damage.
Video and photos can't do an historic flood (or any other natural
disaster) justice. The magnitude doesn't sink in until you're physically
on the scene. This article at
Cincinnati.com does a good job of capturing the scope of the recent Colorado floods; here's an excerpt: "
Let's
go to Glen Haven," the police car's loudspeaker barked, and the
Colorado state trooper whipped a U-turn and headed down into the flood
zone. He would be my escort Tuesday into the tiny flood-ravaged town
deep in the Larimer County mountains, where the only road in, down
Devil's Gulch, was already collapsing into the river. That metallic
command was the final step in a process that started Monday with
negotiations with public officials about the importance of an
independent witness seeing firsthand the destruction caused by
devastating floods that rolled downstream on a wave of historic
rainfall. Across the state, the floods killed at least eight people and
damaged or destroyed as many as 2,000 homes. It also washed out hundreds
of miles of roads and left many small mountain towns completely cut off
-- the towns I was headed to see..."
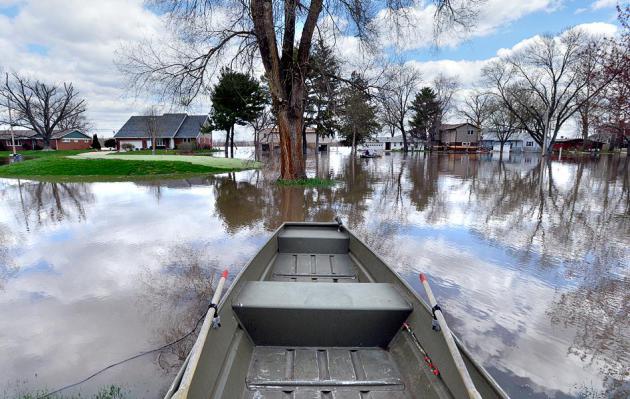
Photo credit above: "
Reporter Trevor Hughes too this photo from Estes Park, Colo., on Sept. 24. "Beauty amidst devastation in Colorado," he wrote." / Trevor Hughes.
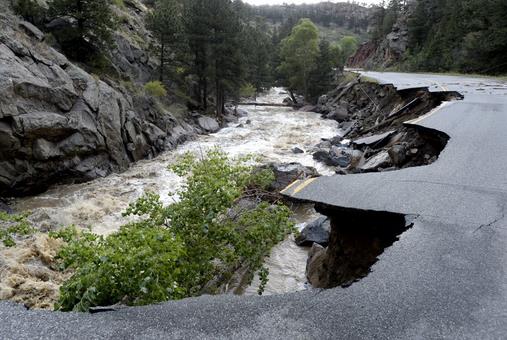
Boulder Storm Summit: Questions Linger Among Experts.
It's still early, but whether it was a 1-in-100 year or 1-in-1,000 year
flood becomes academic if your home was swept away by floodwaters.
Here's an excerpt from
The Boulder Daily Camera: "...
Russ
Schumacher, an associate professor in atmospheric science at Colorado
State University, analyzed the 2013 storm through the lens of the
National Oceanic and Atmospheric Administration's Atlas 14 precipitation
frequency estimates. He concluded that Boulder's rainfall -- distinct
from the flooding -- was actually a one-in-1,000-year event. But
Klaus Wolter, a CIRES research scientist who works in NOAA's Earth
System Research Laboratory -- and lives just three miles above
Jamestown, which was devastated by the flood -- took issue with that. "I think a thousand-year event is pushing the envelope too far," Wolter said..."
File photo credit above: "In
this Sept. 14, 2013, file photo, a portion of Lefthand Canyon Road near
the intersection of Olde Stage Road in Boulder, Colo., is destroyed by
floodwaters. Colorado transportation officials are scrambling to replace
key mountain highways with at least gravel before the first winter
storms hit as early as October, but rebuilding every flood-damaged road
and bridge in the mountains and plains will have to wait until 2014 or
beyond." (AP Photo/Daily Camera, Jeremy Papasso, File).
After Floods, Should Colorado Rebuild Or "Redo"? Salon
takes a look at an important question: in high risk areas, even areas
that are (newly) high risk, does it pay to keep rebuilding? Here's a
clip: "
The floodwaters have largely receded, and the lists of
unaccounted for people have dwindled. In their wake, they’ve left
hundreds of miles of destroyed highway, dozens of washed-away bridges,
and thousands of demolished and damaged homes. The rebuilding process
that Colorado faces now is a daunting, hugely expensive task that will
ultimately take years. It is also, say many disaster experts, an
opportunity – a chance to rebuild some things better than they were
before, with an eye toward withstanding future flooding. “The silver
lining with events like this is you do have the opportunity to redo
things differently – the layout of roads, the layout of towns,” says
Michael Gooseff, a professor of hydroecologic science and engineering at
Colorado State University in Fort Collins. “Mother Nature has reset the
playing field for us...”
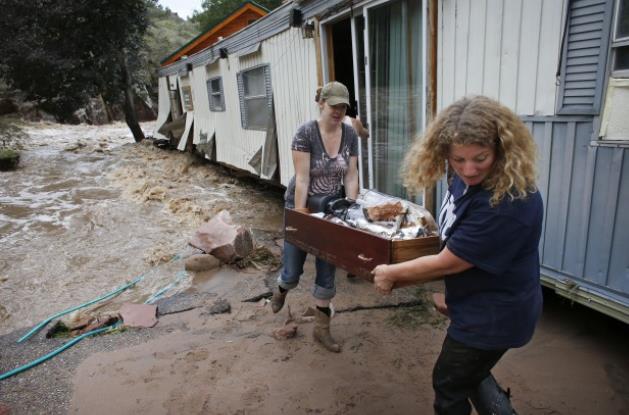
File photo above: "
In
this Sept. 13, 2013 file photo, water rushes through her destroyed home
as resident Holly Robb, left, and her neighbor Pam Bowers salvage
belongings after storms that raged through the Rocky Mountain foothills
in this photo made in Lyons, Colo. Two low-lying trailer parks in the
small town, 20 minutes to the north of Boulder, bore the brunt of the
recent flooding. “I don’t think we’ll ever be able to go back,” said
Robb." (AP Photo/Brennan Linsley, File)(Credit: AP).
Sandy Changed Attitudes - For Better And Worse.
NBC Philadelphia
gauges the physical, long-term impacts of Sandy on the Jersey Shore,
and changes in psychology related to the aftermath of Sandy; here's a
clip: "...
In other post-Sandy research, a Rutgers psychologist's
studies seem to show that Sandy may have made some younger voters more
likely to vote for a politician running on a "green" platform -- even if
it could mean tax increases. Further, the research showed that one
positive effect of Sandy may have been in convincing formerly skeptical
people that climate change is a man-made phenomenon. Laurie Rudman's
research, published in the journal Psychological Science, is based on
two rounds of surveys she did among Rutgers undergraduate students, in
2010 and just after Hurrican Sandy last fall..."
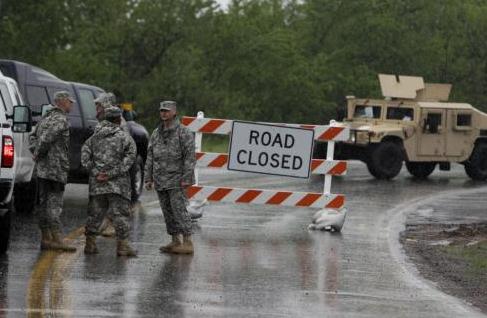
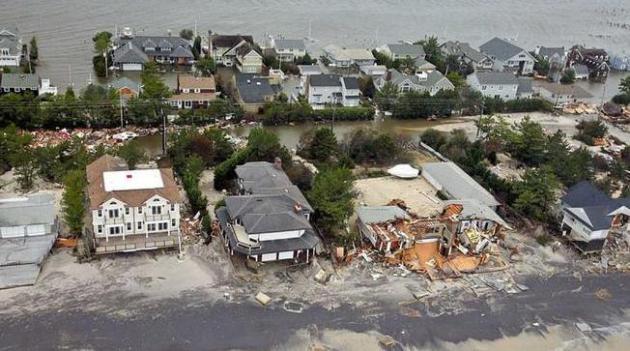
Photo credit above: "
NJ
National Guard, via Rutgers. "Sandy devastated Mantaloking, shown in
this file photo, and has changed some attitudes about the Shore."
The Problem With Death Tolls.
Slate
has an interesting story on how using deaths resulting from natural
disasters, however tragic, can miss the bigger picture and implications.
Here's a clip: "...
The quake is a grim reminder that while
reporting on disasters like these is often dominated by death tolls,
which are used as a kind of shorthand to diagnose the severity of an
event. Putting aside the inherent problems involved with calculating death tolls and the geographical biases
involved in disaster coverage, the number of dead can be a misleading
way to think about the scale of a disaster like this one, particularly
when it comes to decisions about funding for relief efforts. In a
crowded international news environment, we may decide which disasters to
pay attention to based on how many people were killed, but that's not
the best way to decide how much help is needed..."
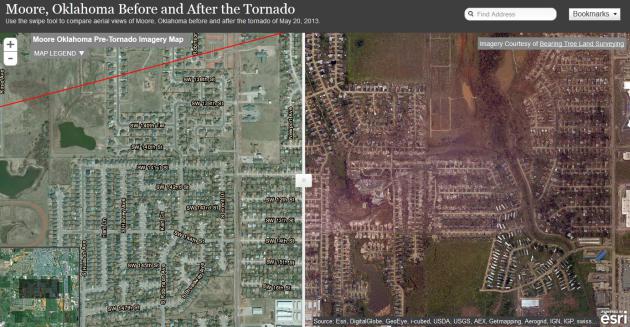
Image credit: May, 2013 Moore, Oklahoma tornado aerial image, before and after. Courtesy: ESRI.
Low-Cost Blooming Bamboo Home Built To Withstand Floods.
This will become a trend in the USA in the coming years - homes and
office buildings that are more resilient and wind/flood resistant.
Here's an excerpt from
Gizmag: "
Vietnamese
architectural firm H&P Architects has produced a new prototype
dwelling constructed from bamboo. Dubbed Blooming Bamboo, the house is
built to withstand heavy flooding, and is eventually intended to be
mass-produced and sold as an affordable and attractive home..."
Image credit above: "
The Blooming Bamboo home, by Vietnamese architectural firm H&P Architects." (Photo: Doan Thanh Ha).
Covering Tragedy Taking A Toll On Journalists.
No, I have yet to meet a no-emotion, Spock-like reporter who doesn't
feel the full impact of what they're covering. Here's a clip from
TVNewsCheck: "
The issues journalists confront in covering traumatic
events — whether they are epic events like 9/11 and the recent rash of
mass shootings, or the “slow drip” that crime reporters experience —are a
growing problem. The increase is due to both changes in the news
business and because there are simply so many more of them. In response,
organizations like Columbia University's Dart Center for Journalism
& Trauma have programs to help..."
Photo credit: Ron Johnson, Journal Star.
One In Eight People Around The World Go Hungry, Says U.N. Report.
The New York Times has the sobering details - here's an excerpt: "
One
in eight people around the world is chronically undernourished, the
United Nations' food agencies said on Tuesday, warning world leaders
that some regions would fail in halving the number of hungry by 2015. In
their latest report on food insecurity, the U.N. agencies estimated
that 842 million people were suffering chronic hunger in 2011-13, or 12
percent of the world's population, down 17 percent from 1990-92..."
Fast Food Drive-Thrus Are Getting Slower. Forget about the government shut-down, this is SERIOUS news!
USA Today has the story; here's a clip: "
As
if the fast-food industry doesn't have enough headaches, now it's got a
new one: It's getting too slow. Never mind that its first name is
"fast." The amount of time that consumers are spending waiting in lines
at fast-food drive-thru windows is getting longer, not shorter, mostly
due to the growing complexity of new products that the major fast-food
chains are selling. This, according to 2013 Drive-Thru Performance Study
conducted for QSR Magazine, a fast-food industry trade publication. The
study, to be released today, also says that industry giant McDonald's
posted its slowest-ever drive-thru time in the 15-year history of the
drive-thru study — requiring an average 189.5 seconds for the typical
drive-thru customer to go from order to pickup. That's roughly nine
seconds longer than the industry average, reports the study conducted
this summer by Insula Research..."
"Breaking Bad": Vince Gilligan Shares 5 Alternative Endings. The Wrap has the story - thanks to my Navy son (Brett) and Netflix for sucking me into the Walter White Vortex. Here's a clip: "
No. 1: Walter White goes Rambo
The writers of “Breaking Bad” gave Walter White his M60 before they knew who it would kill. Vince Gilligan says in the final “Breaking Bad Insider” podcast
that he and his team had no idea, when they gave Walt the machine gun
at the start of the final season, that he would eventually motorize it
mow down Neo Nazis. They didn’t even know the show would have Neo Nazis..."
8 Gnarly Photos From Surf City's Surf Dog Competition. The government is shut down, but we still have cool dog-surfing photos! This could only happen in California - kudo to
theweek.com and Lucy Nicholson at Reuters for making us all smile.
TODAY: Fading sun, last lukewarm day. Winds: SE 10. High: 77
WEDNESDAY NIGHT: Mostly cloudy with a few T-storms. Low: 57
THURSDAY: Periods of rain likely, heavy at times. High: 68
FRIDAY: More rain, heaviest PM hours. Wake-up: 56. High: 63
SATURDAY: Rain lingers, windy & colder. Wake-up: 54. High: 56
SUNDAY: Windy and chilly. AM sun, PM clouds, shower. Wake-up: 41. High: near 50
MONDAY: Gray start, slow PM clearing. Wake-up: 39. High: 55
TUESDAY: Partly sunny, still cool. Wake-up: 38. High: near 60
Climate Stories....
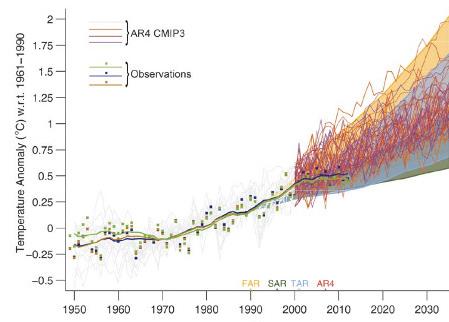
IPCC Model Global Warming Projections Have Done Much Better Than You Think.
The Guardian
has the article; here's a snippet: "...Since 1990, global surface
temperatures have warmed at a rate of about 0.15°C per decade, within
the range of model projections of about 0.10 to 0.35°C per decade. As
the IPCC notes,
"global climate models generally
simulate global temperatures that compare well with observations over
climate timescales ... The 1990–2012 data have been shown to be
consistent with the [1990 IPCC report] projections, and not consistent
with zero trend from 1990 ... the trend in globally-averaged surface
temperatures falls within the range of the previous IPCC projections."
Graphic credit above: "
IPCC
AR5 Figure 1.4. Solid lines and squares represent measured average
global surface temperature changes by NASA (blue), NOAA (yellow), and
the UK Hadley Centre (green). The colored shading shows the projected
range of surface warming in the IPCC First Assessment Report (FAR;
yellow), Second (SAR; green), Third (TAR; blue), and Fourth (AR4; red)."
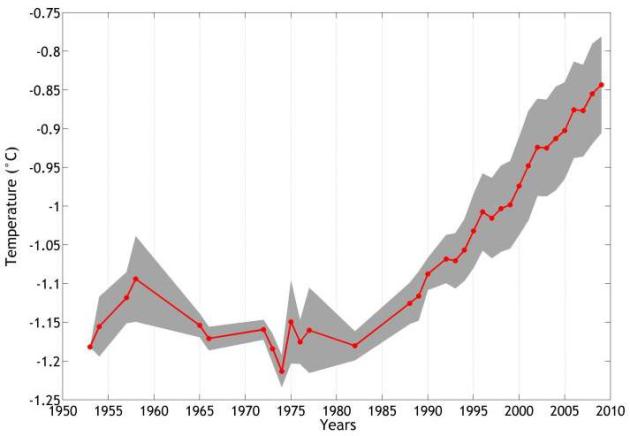
The Deep Greenland Sea Is Warming Faster Than The World Ocean. Science Daily has the story; here's the introduction: "Recent
warming of the Greenland Sea Deep Water is about ten times higher than
warming rates estimated for the global ocean. Scientists from the Alfred
Wegener Institute, Helmholtz Centre for Polar and Marine Research
recently published these findings in the journal Geophysical Research
Letters. For their study, they analysed temperature data from 1950 to
2010 in the abyssal Greenland Sea, which is an ocean area located just
to the south of the Arctic Ocean..."
Graphic credit above: "
Increase
of water temperature in the deep Greenland Sea. Mean temperature (°C)
from 2000 m to the bottom in the central Greenland Sea (74-76°N, 0-6°W)
from 1950 to 2009 (red line). The shading shows the range of temperature
from 2000 m (warmer limit) to the bottom (colder limit). (Credit:
Alfred-Wegener-Institut)."
 NOAA Scientists Looking At Link Between Climate Change And Flooding
.
CBS Denver has the story and video - here's an excerpt: "
A
United Nation’s panel on climate change says the changes can be blamed
on human activity. Top scientists from around the world say people are
mostly to blame for rising temperatures since 1951. Some of the best
weather and climate scientists in the world are based at the National
Oceanic and Atmospheric Administration in Boulder. It’s ironic and
convenient they are located in Boulder where the flood did some of its
worst damage. They are analyzing all the data to determine whether this
is truly the 100-year flood or brought on by climate change..."
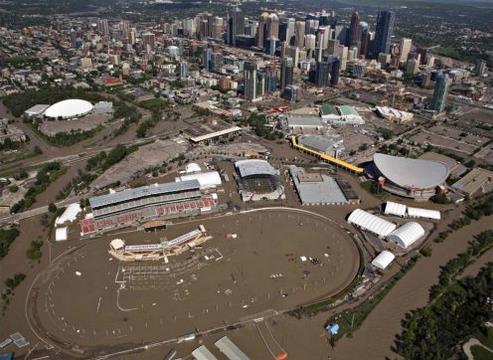
IPCC Report: Canada At Greater Risk Of From Climate Change.
The impacts are already greater at northern latitudes, from Alaska and
Canada to Scandanavia and Siberia. Canada is warming at twice the global
average. Here's an excerpt of a comprehensive story from
The Toronto Star: "
Stronger
storms forecast for Atlantic Canada and Ontario, while Great Lakes
warming could be 50-per-cent higher than global predictions. Canada will
continue to see more warming than the global average and extreme
weather events will be more frequent and more intense, says a full report
by a group of the world’s top climate scientists. There will be
stronger hurricanes, longer heat waves and, in some parts of the
country, more snow and more hail, says the Intergovernmental Panel on
Climate Change, which released a 2,216-page assessment on global
warming’s regional impact..."
Photo credit above: ANDY CLARK / REUTERS FILE PHOTO. "There
is debate over whether this year's devastating floods in Calgary,
above, and Ontario were due to climate change, but one expert says “we
will see more of those kind of events" as Canada experiences more
precipitation and a faster spring melt."
World's Carbon Budget To Be Spent In 3 Decades.
WRI Insights has the story - here's the introduction: "
The
Intergovernmental Panel on Climate Change's (IPCC) Fifth Assessment
Report (AR5) has delivered an overwhelming consensus that climate change
impacts are accelerating, fueld by human-caused emissions. We may have
just about 30 years left until the world's carbon budget is spent if we
want a likely chance of limiting warming to 2 degrees C. Breaching this
limit would put the world at increased risk of forest fires, coral
bleaching, higher sea level rise, and other dangerous impacts..."
Climate Economists Deftly Tackle Their Second-Hardest Question.
Bloomberg has the story - here's a clip: "Among economists, "
What's
the future worth?" has been one of the most chewed over questions since
the U.K. released a major assessment of the costs of climate change in
2006. There are plenty of answers that the question brings up in
ordinary life, from the emotional ("Every bit as much as the present!")
to the practical ("How will answering this question help my re-election
to the U.S. House of Representatives?") In the world of climate change,
though, it's a hard numbers question: how much should we spend now to
head off climate disaster in the future? It depends on how much you
think the value of money will change over large spans of time.
Economists talk about the value of the future in terms of a "discount
rate": how much we value a dollar's worth of goods or resources X years
in the future compared to today..." (Image: Shutterstock).


No comments:
Post a Comment