78 F. high in the Twin Cities Thursday.
76 F. average high on June 5.
60 F. high on June 5, 2013.
03" rain fell at KMSP yesterday.
June 5, 1864: Light frost reported in St. Paul as chilly air mass moved over the state.
Manila (with lakes)
The
Great Atmospheric Spigot in the Sky is either ON or OFF. Not much
in-between lately. Either we're tracking drought, brush fires and water
shortages, or we're in a perpetual flood, reporting on swamped fields
and overflowing lakes and rivers.
According to Minnesota's Climate
Office the first 5 months of 2014 was the second wettest in 144 years
of record-keeping. 2012 and 2013 also ranked among the five wettest of
all-time for that 5 month period. A fluke or a trend?
Great question. I wish I had a great answer.
Then
again June is our wettest month of the year in Minnesota, the worst
month to plan outdoor weddings and grad parties. That statistic will
become increasingly evident in the coming weeks.
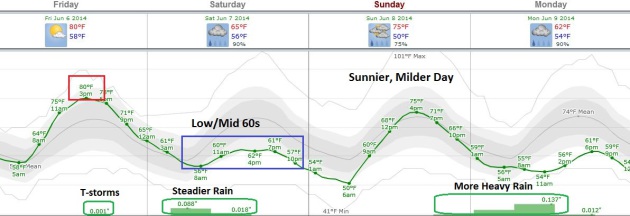
More T-storms fire up
later today ahead of an advancing cool front; showery rains spill over
into much of Saturday as we cool into the 60s. We salvage a fine Sunday,
the nicer day of the weekend for the Edina Art Fair. More rain is
likely Monday, again Wednesday as temperatures mellow.
Wedging in your outdoor plans will take patience, planning and luck.
ECMWF guidance hints at 90F by the end of next week with drippy dew points. And more T-storms.
Turn off the sprinkler until further notice.
.92" of additional rain in the Twin Cities by Monday morning (NAM model).
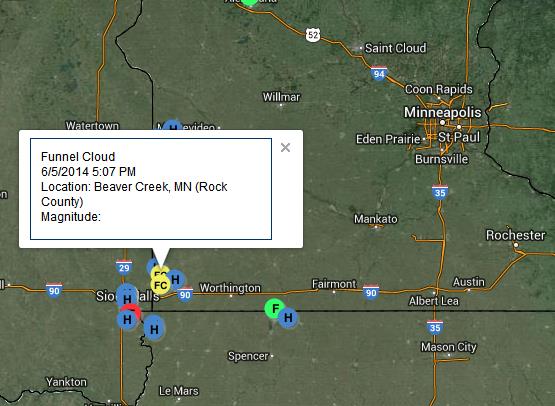
Thursday Severe Weather Reports.
Although there were no confirmed tornado touchdowns in Minnesota, a few
funnel clouds were spotted over far southwestern counties. The Twin
Cities National Weather Service has a list of
severe weather reports.
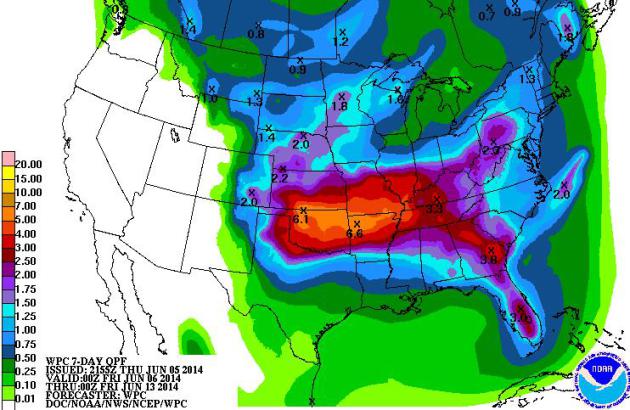
A Sloppy Holding Pattern.
Soaking rains and T-storms linger over the central and southern Plains
into Monday, as a series of weak cool frontal passages spark waves of
storms over the northern USA. For Minnesota the best chance of rain
comes later today and Saturday (T-storm risk by late afternoon today;
showery rains on Saturday with temperatures stuck in the 60s). After a
brief, fleeting break with sunshine Sunday more rain and storms return
by Monday.
Stuck.
I've said it before (ad nauseum) and I'll say it again. Weather systems
- increasingly - are falling into extended holding patterns where
frontal systems and storms stall for days, even weeks at a time.
Historic drought continues to build across California and much of the
western USA, while flooding rains are possible from Oklahoma into the
Ohio Valley over the next 7 days; some 4-7" amounts are possible. Much
of Minnesota picks up 1" of rain by Monday afternoon, maybe 2" or more
over western and southwestern counties. 7-day rainfall outlook: NOAA.
 Weekend Details
.
ECMWF guidance shows a T-storm risk by late this afternoon and evening,
but as the atmosphere cools and stabilizes I expect just rain showers
Saturday (probably no lightning). Sunday still looks like the nicer day
of the weekend for outdoor plans, more rain - possibly heavy - Sunday
night into Monday. Our soggy rut spills over into next week. Graph:
Weatherspark.
Lake Minnetonka Water Level Reaches All-Time High on Tuesday. At the rate we're going Lake Minnetonka water levels may not return to "normal" until late July. Here's an excerpt from the
Minnehaha Creek Watershed District: "
Water
levels remain at historic highs across the Minnehaha Creek Watershed
District after record-setting rains this spring. After reaching a new
record high of 930.66 feet above sea level on Tuesday, June 3, Lake
Minnetonka’s water level has ebbed slightly to the current reading of
930.65 on Thursday, June 5. The District continues to discharge
water at a rate of 300 cubic feet per second (cfs) at the Gray’s Bay
Dam, according to the DNR-approved operating plan, and additional water
is flowing over the spillway north of the dam at a rate of 269 cfs. For
more on 2014 dam operations, see below. The
Lake Minnetonka Conservation District has approved an emergency high
water ordinance for Lake Minnetonka, which imposes minimum restrictions
across the entire lake effective immediately. For more information,
visit www.lmcd.org..."
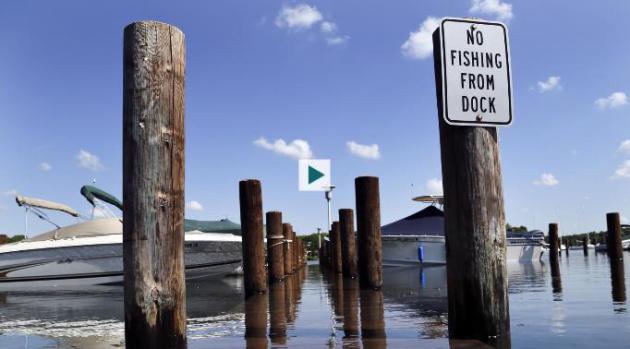
High-Water Drama: Rains Swell Lakes, Especially Minnetonka. Here's a clip from a story and video at
The Star Tribune: "...
The high-water drama is especially noticeable on Lake Minnetonka,
the metro area’s biggest and busiest recreational lake, where a
floating bog that looks like an island had to be lassoed and anchored
back into place Wednesday after it drifted away on high water and
blocked a channel. Although the sprawling lake’s water level dropped a
fraction of an inch Wednesday from the record it had attained Tuesday,
officials continued to warn of a continuing risk of floating obstacles —
trees, parts of docks that have been pulled apart, pieces of firewood
and other yard items the rising water has abducted..."
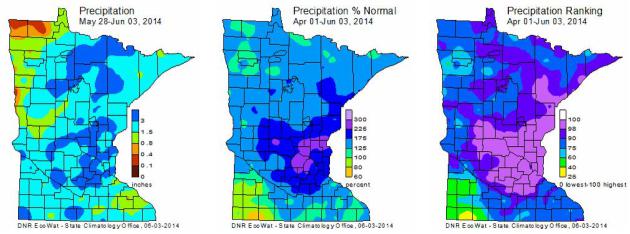
A Leaky Sky: First 5 Months Second Wettest in 144 Years for Twin Cities.
Yes, it's wet out there, and I see a continuation of our wetter than
average pattern looking out 1-2 weeks, which is about as far out as we
can gaze with any skill at all. Until the core of the jet stream lifts
north of the U.S. border (consistently) our sloppy pattern will
continue. Here's an excerpt from the
Minnesota Climatology Working Group: "...
Precipitation totals since April 1
are far above historical averages. For large portions of Minnesota,
season-to-date precipitation totals rank above the 90th percentile when
compared with the historical database during the April-plus-May time
period. It was Minnesota's third consecutive meteorological spring
(March - May) of exceptionally high precipitation totals. In the Twin
Cities, 2014 continued a rather remarkable streak of wet starts to the
calendar year. The January 1-through-June 1 precipitation total (16.84
inches) in the Twin Cities was the second highest of the 144-year
record. 2012 and 2013 also ranked among the five wettest all-time for
that five-month period..."
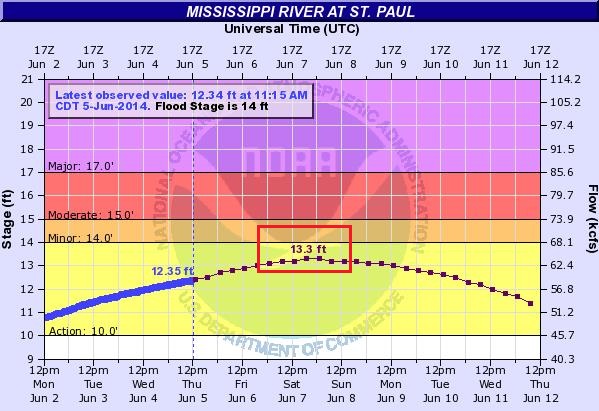
Higher Crest in St. Paul. Latest guidance from NOAA's
Advanced Hydrological Prediction Service
shows a weekend crest of 13.3 feet on the Mississippi River in St.
Paul. That's roughly a foot higher than models were predicting 2 days
ago. Minor flooding is possible at 14 feet, so some inundation and
overflow is likely.
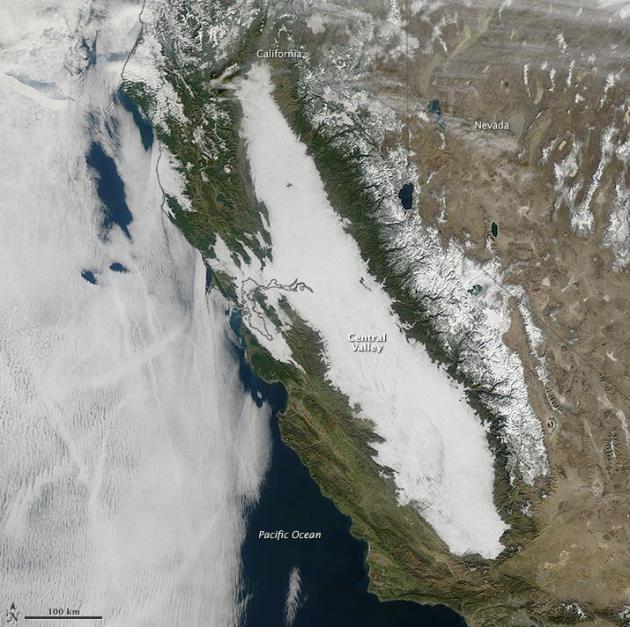
Winter Fog Becoming Rare in California.
The perpetual drought has created fewer foggy mornings in California's
Central Valley, and that has additional implications, according to
NASA's Earth Observatory; here's an excerpt: "
From
time to time, in the wake of winter rain, dense fog fills the wide
valley between California’s Sierra Nevada and Coastal Range. Called Tule fog,
the phenomenon is as much a part of winter in the Central Valley as
snow is in the mountain. In recent years, however, the fog has come less
often. In fact, since 1981 the number of fog days between November and
February has decreased by 46 percent, according to a recent study. The decrease is bad news for California’s fruit and nut farmers..."
NASA imagery acquired January 17, 2011.
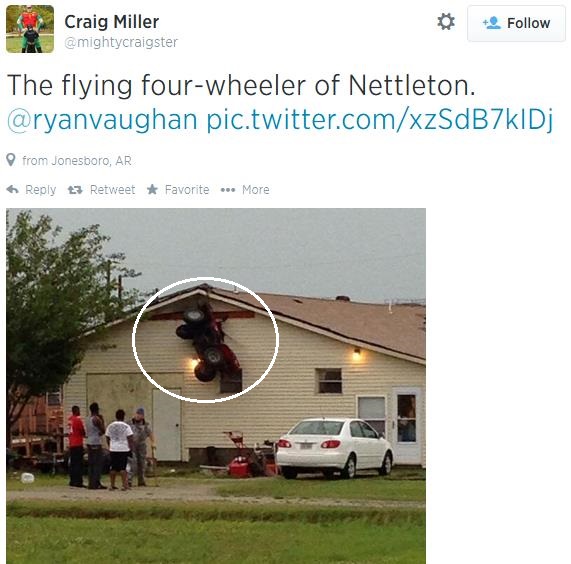
The Flying Four-Wheeler of Nettleton.
I'm assuming straight-line winds did this. Or massive amounts of
alcohol. Thanks to Ryan Vaughan and Craig Miller for passing this one
along via
Twitter.
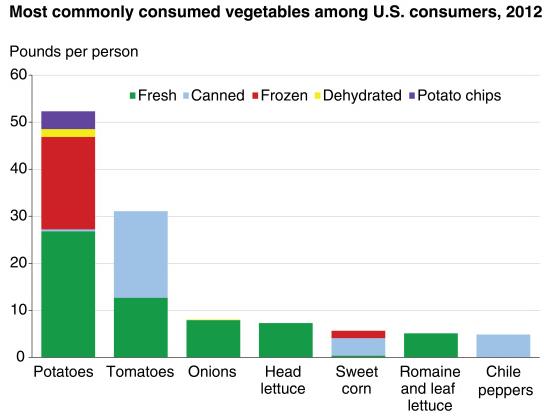
These Are The Most Popular Foods in America.
Yes, we love our cheese, and mozzarella still triumphs over cheddar.
There's some news you can use. Here's a clip from a story at
Time Magazine that left me awfully hungry: "
New data
from the USDA’s Economic Research Service (ERS) lets you peek into the
kitchens of Americans and find out how they’re eating—based on what
they’re buying. The ERS’s Food Availability data measures yearly
supplies of several food commodities in the U.S., and this year, some of
the most interesting results are that sweet foods like ice cream appear
to dropping, though we tend to mostly like our fruit in juice form and
pizza and tomatoes round out our favorite veggies..."
Graphic credit: USDA.
How The NSA Could Bug Your Powered-Off iPhone, and How to Stop Them.
Yes, when you power down your smart phone it's only playing dead. With
all the privacy concerns I'm going back to fax machines and CB radio.
Who's with me? Here's an excerpt from
Wired: "
Just because you turned off your phone doesn’t mean the NSA isn’t using it to spy on you.
Edward Snowden’s latest revelation about the NSA’s snooping inspired an
extra dose of shock and disbelief when he said the agency’s hackers can
use a mobile phone as a bug even after it’s been turned off. The
whistleblower made that eye-opening claim when Brian Williams of NBC
Nightly News, holding his iPhone aloft during last Wednesday’s interview,
asked, “What can the NSA do with this device if they want to get into
my life? Can anyone turn it on remotely if it’s off? Can they turn on
apps?..."
Photo credit above:
Josh Valcarcel/WIRED.
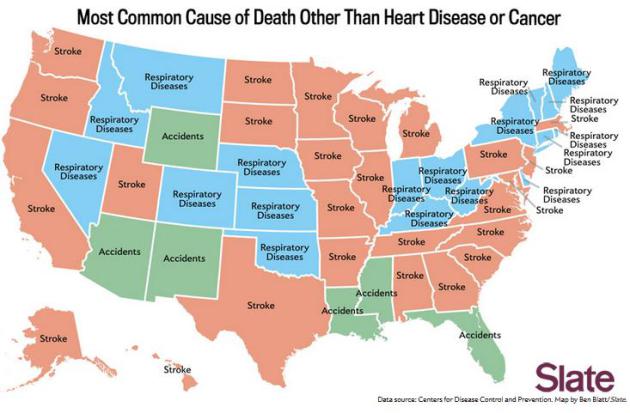
Death Map: The Most Common Causes of Death in Each State. Here's a little Friday pick-me-up. Can excessive blogging be fatal? Here's a clip from the story at
Slate that caught my eye, making me even happier to call myself a Minnesotan: "...
By
contrast, the age-adjusted death rates for the top 10 causes of death
are all lower in Minnesota than they are nationally. It makes sense,
then, that the most recent estimates by the CDC have the life expectancy in Minnesota as nearly five years longer than in Alabama..."
Map data source: Centers for Disease Control and Prevention. Map by Ben Blatt/
Slate.
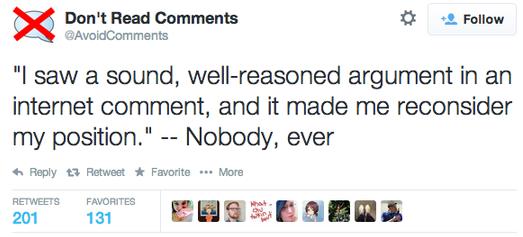
How Comments Shape Perceptions of Site's Quality - And Affect Traffic.
Did you ever read an online comment that made you change your mind?
It's a rare, diary-worthy moment. So much noise, so little wisdom.
Here's an excerpt from
The Atlantic: "
There’s
a game I like to play sometimes. It’s called “How many Internet
comments do I have to read until I lose faith in humanity?” All too
often, the answer is: one comment. From The Atlantic to Yahoo to
YouTube, online comments are often ignorant, racist, sexist,
threatening, or otherwise worthless. But you knew that already. There’s
plenty of anti-comment sentiment on the web—some humorous, some more scholarly—and despite the hopes of media democratizers, there’s now widespread agreement that Internet comments are terrible..."
"Hey Joe": A Caffeinated Cry for Help? Come to think of it, I need one of these gadgets (productivity tools). Here's an excerpt from
Gizmag: "
With portable espresso machines, French press mugs
and other brewing gadgets percolating up all over the place and coffee
shops on every second street corner, you'd be forgiven for wondering,
does procuring a cup need to be any more convenient? For a pair of
Atlanta-based entrepreneurs, the answer is, yes, which is why they
developed the Hey Joe mug that can prepare a brew on demand, meaning a
fresh cup of coffee is only ever a push of a button away..."
TODAY: Warm sun, warmer than average. Dew point: 62 Winds: SW 8. High: 83
FRIDAY NIGHT: Showers and T-storms likely. Low: 59
SATURDAY: Fairly foul. Cool with showery rain. Winds: NE 10-15. High: 65
SUNDAY: The nicer day of the weekend. Partly sunny. Winds: SE 8. Wake-up: 53. High: 75
MONDAY: Periods of rain, possible thunder. Wake-up: 56. High: 72
TUESDAY: Sun returns, not bad at all. Wake-up: 55. High: 79
WEDNESDAY: Early sun, PM T-storms. Wake-up: 60. High: 81
THURSDAY: Hot & sticky. Feels like summer. Wake-up: 63. High: 86
* 90F isn't out of the question by the end of next week.
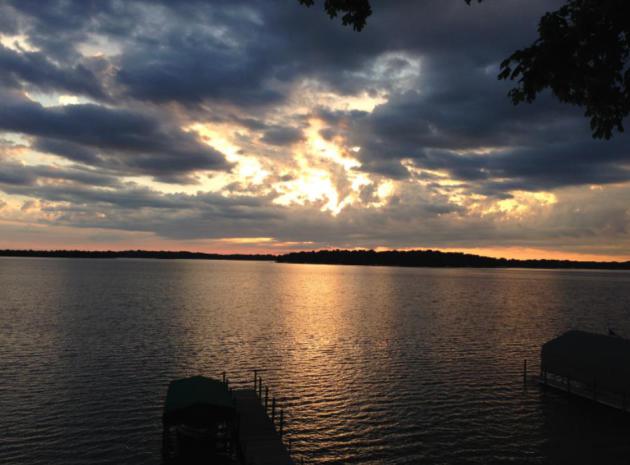
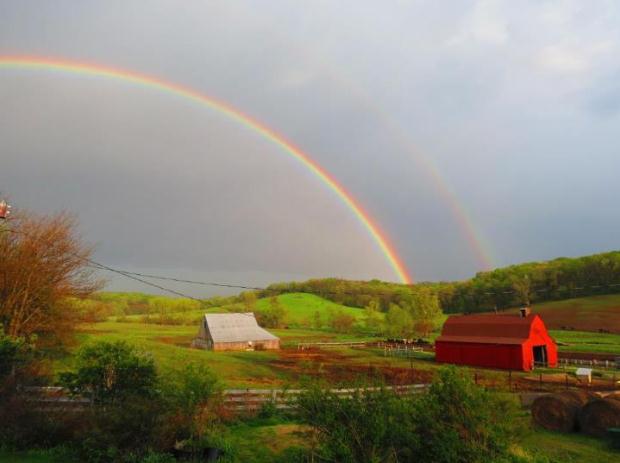
** Rainbow photo courtesy of Marlo Lundy.
Climate Stories....
Climate Change Isn't Just About Climate Anymore. The
military implications of a rapidly changing climate are just as
important as the economic costs; here's a clip from a story at
Voice of the Valley in Washington State: "...
We
can’t separate this out and say climate change is an energy problem and
not a national security problem,” said Representative Adam Smith,
(D-Wash.). Research indicates that changing rainfall patterns can
undermine agricultural productivity and food security, leading to
conflict. More droughts can force migrations, which increase stress on
weak governments. Melting sea ice will open new shipping lanes through
the Arctic, which will affect military operations and international
trade. All of these changes have implications for the Pacific Northwest
and the nation as a whole..."
Taking Climate Change Seriously. Jim Wallis has a thoughtful essay at
Huffington Post, talking about the moral and spiritual imperatives of dealing with the reality of climate change; here's an excerpt: "...
On
climate change, the narratives of science will not be enough. Neither
will extreme weather events like Hurricane Sandy, which capture our
attention momentarily but offer a glimpse of the storms that are
projected to grow worse and more frequent.I believe the most compelling
narratives for dealing with climate change must be moral ones,
theological ones, and biblical ones, especially if we are to reach and
engage the faith community -- which every successful social movement
must do. God's instructions in Genesis to be good stewards of the world
God has created are central now. And generational ethics are central to
that..."
Neil deGrasse Tyson Explains How Republicans Blew It On Climate Change. Chris Mooney has the interview at
Mother Jones; here's an excerpt: "...
Tyson is know for being fairly non-confrontational; for not wanting to directly argue with or debate
those who deny science in various areas. He prefers to just tell it
like it is, to educate. But when we talked he was, perhaps, a little
more blunt than usual. "At some point, I don't know how much energy they
have to keep fighting it," he said of those who don't accept the
science of climate change. "It's an emergent scientific truth." Tyson
added that in the political sphere, denying the science is just a bad
strategy. "The Republican Party, so many of its members are resistant to
embracing the facts of climate change that the legislation that they
should be eager to influence, they're left outside the door," said
Tyson. "Because they think the debate is whether or not it's happening,
rather than what policy and legislation can serve their interests going
forward..."
Image credit above: "
Neil deGrasse Tyson in this Sunday's final episode of Cosmos." Fox/National Geographic.
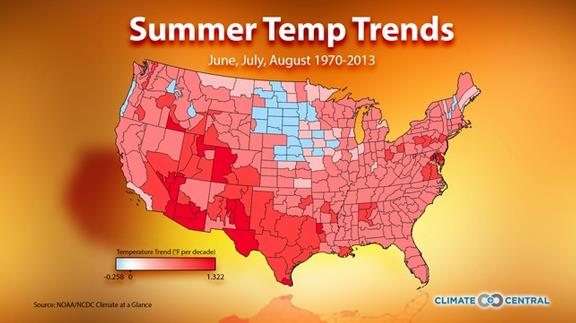
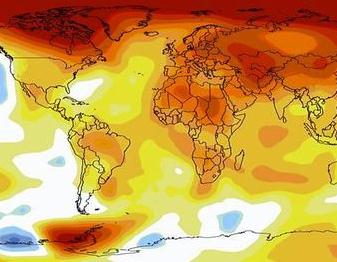
Here's How Much U.S. Summers Have Warmed Since 1970.
Climate Central has the article; here's an excerpt: "...
The
notable blue spot in a sea of red is the Upper Midwest, where
substantial parts of Iowa and the Dakotas have seen a slight cooling
trend since 1970. Interestingly, that region is actually home to some of
the fastest-warming states when you look at the change in annual
average temperatures. Winters in particular have warmed dramatically
there over the past 40 years. Of the 344 climate divisions, which are set by the National Climatic Data Center and divide the country into climatically-similar zones, less than 10 percent have seen a summer cooling trend..."
Graphic credit:
"A map showing summer temperature trends in the U.S. since 1970."
States Most Impacted by Global Warming since 1984? Maine, Vermont, New Mexico & Texas. Here's a clip from
The Star Tribune: "...
All
but one of the lower 48 states have warmed since 1984. North Dakota is
the lone outlier, and cooled slightly. Ten states — Maine, Vermont, New
Jersey, Massachusetts, New Hampshire, Rhode Island, Delaware, New
Mexico, Connecticut and New York — have gotten at least 2 degrees warmer
in the past 30 years. Since 1984, 92 percent of the more than 500
cities and smaller regions within states have warmed and nearly
two-thirds of them have warmed by at least a degree..."
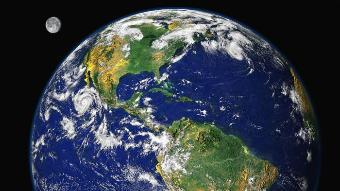
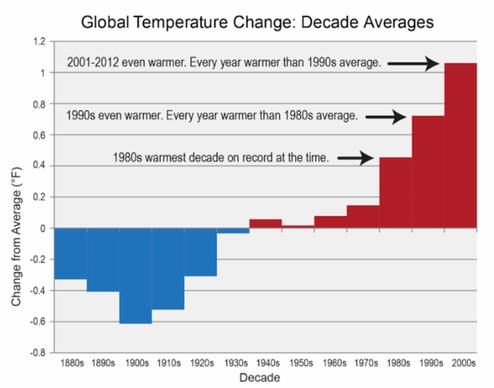
If You Think The Climate Hasn't Warmed Since 1998, Think Again. Here's a graph in the latest National Climate Assessment, courtesy of a post from
Dr. Jonathan Koomey:
"One of the most common Internet memes about climate is the idea that
the earth hasn’t warmed since 1998. This erroneous claim is based on
cherry picking data and ignoring the increase in the heat content of the
oceans, which is where most of the historical warming has been stored.
This issue is explored fully in
this section of the website
Skeptical Science, as well as
another page that explores the right and wrong ways to understand trends, but I recently saw a nice graph that boils it all down..."
Graphic credit: "
The
last five decades have seen a progressive rise in Earth’s average
surface temperature. Bars show the difference between each decade’s
average temperature and the overall average for 1901 to 2000. The far
right bar includes data for 2001-2012." (Figure source: NOAA NCDC). National Climate Assessment, p.796, Figure 7 in Appendix 4."


No comments:
Post a Comment