81 F. high in the Twin Cities Tuesday.
80 F. average high on August 19.
88 F. high on August 19, 2013.
August 19, 1904:
Both downtown Minneapolis and St. Paul were hit by tornadoes. This was
the highest official wind ever recorded in Minnesota over one minute
(110 mph in St. Paul).
Mission Impossible
It's
a logical, reasonable question. "Paul, will it rain on my yard this
evening?" We respond with probabilities and words like "isolated" and
"scattered" thundershowers.
"You have Turbo-Doppler! Why can't you tell me if the storms will hit MY HOUSE?"
Welcome
to the world of random weather. We can tell when conditions are ripe
for storms, but will your neighborhood be the 10 to 20 percent of the
state that sees rain?
In spite of 3 KM resolution models that
update every hour the state of the art still can't answer that question
with a high degree of confidence. A line of storms? That's
straightforward. But hit-or-miss, "popcorn" instability showers? Good
luck. Radar on a phone is probably your best tool for pinpointing rain
chances for your GPS location. Anything else is an exercise in
hand-waving.
Today looks quiet: no pulsating red blobs on Doppler.
Storms rumble in Thursday with high humidity. Friday will be the better
day to graze the healthy food choices at the State Fair, with highs
near 90F. I'll be at the Star Tribune booth around midday to hang out
with Vineeta Sawkar and babble about the dew point.
Near 90F Sunday, then a breath of fresh, September air next week.
* 3 KM HRRR model from Tuesday courtesy of NOAA and HAMweather.
Future Radar.
Here is 60-hour NOAA NAM guidance showing the next wave of warm frontal
thunderstorms pushing across southern and central Minnesota late
tonight into Thursday morning. A counterclockwise swirl of showers
pushes across the Great Lakes, with a possible severe storm outbreak
pushing thru the Ohio Valley into the Mid Atlantic states.
Monsoon-related T-storms flare up over the Rockies, but no colorful
blobs appear over California, where the drought continues to deepen.
Loop: HAMweather.
Accumulated Rainfall Potential.
NOAA high-res models print out as much as 2-3" rain for the Twin Cities
metro by Thursday night as a (hot) front surges north. If skies clear
fast enough behind these storms the mercury may hit 90F on Thursday with
dew points sweltering close to 70F. The maps look more like late June
than late August into Sunday, but much cooler air knocks the mercury
into the 60s and 70s much of next week with half as much water vapor in
the air by Monday. If you're looking for comfortable weather for the
Minnesota State Fair you may want to wait until next week. Guidance:
HAMweather.com
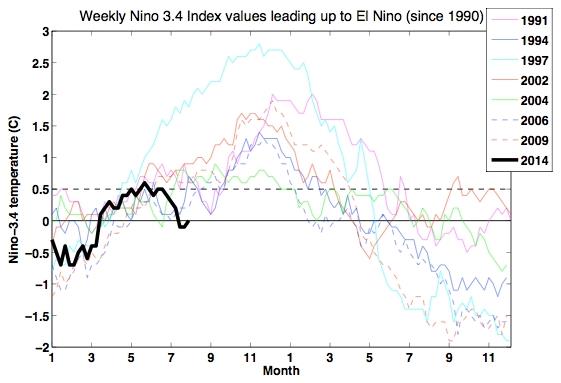
El Nino: Fizzle or Sizzle? What happened to the much-anticipated, much-hyped El Nino event of 2014? It's still coming, according to
NOAA's climate.gov. Here's an excerpt of a good post and update: "...
In
summary, we continue to favor the emergence of El Niño in the coming
months, with the peak chance of emergence around 65% (i.e. there is a
35% chance of El Niño not occurring). ENSO forecasters do not expect a
strong El Niño (we can’t eliminate the chance of one either), but we are
not expecting El Niño to “fizzle.” In fact, just in the last week, we have started to see westerly wind anomalies pick up near the Date Line. Literally and figuratively, we may be witnessing the start of ENSO’s second wind."
Graphic credit above: "
Two
consecutive years of Niño-3.4 index values for El Niño episodes that
peaked during the Northern Hemisphere winter. The thick black line shows
the values of Niño-3.4 for the current year (2014) up to present. The
dashed (solid) horizontal line shows where the Niño-3.4 index is equal
to 0.5°C (0°C). Data based on weekly OISSTv2." Figure by Michelle L’Heureux, Climate Prediction Center.
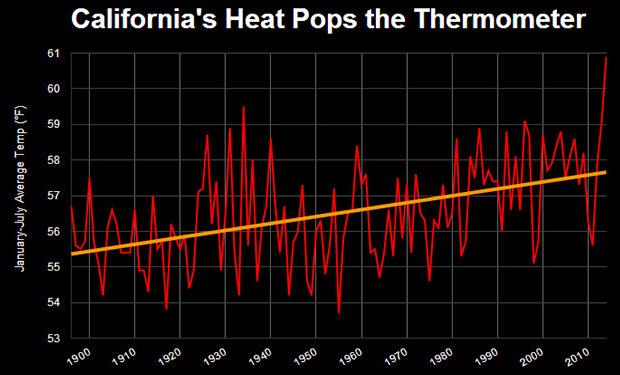
California's Record Heat Is Unlike Nothing You've Ever Seen....Yet. Here's an excerpt of a story that puts California's heat into perspective, courtesy of Bloomberg: "If
hot thermometers actually exploded like they do in cartoons, there
would be a lot of mercury to clean up in California right now. The
California heat this year is like nothing ever seen, with records that
go back to 1895. The chart below shows average year-to-date temperatures
in the state from January through July for each year. The orange line
shows the trend rising 0.2 degrees Fahrenheit per decade. The sharp
spike on the far right of the chart is the unbearable heat of 2014.
That’s not just a new record; it’s a chart-busting 1.4 degrees higher
than the previous record. It’s an exclamation point at the end of a long
declarative sentence..."
Graphic credit above: National Climatic Data Center.
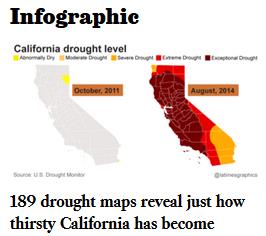
"Severe" Drought Covers Nearly 99.8% of California, Report Says. Here's an excerpt of a
Los Angeles Times story, which includes an amazing infographic that shows the evolution of California's drought: "
Drought
conditions may have leveled off across California, but nearly 100% of
the state remains in the third-harshest category for dryness, according
to the latest measurements. For the past two weeks, California's drought
picture has remained the same, halting a steady march toward worse. But
the breather has allowed the state to recover only ever so slightly..."
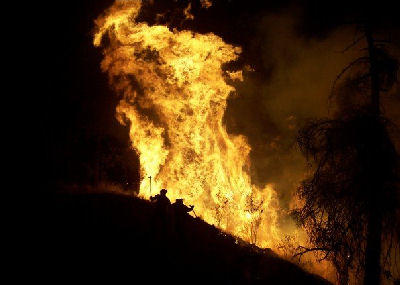
British Columbia Has Spent More Than 3 Times Its Wildfire Fighting Budget.
News1130 in Vancouver has the story; here's the intro: "
The
province is paying a pretty penny when it comes to fighting forest
fires this summer. Around $200 million has been spent in the last few
months, blowing past the original budget of around $60 million. And
since the season is not over yet, that number is expected to grow. Kevin
Skrepnek with the Wildfire Management Branch says when it comes to the
size and severity of fires, this year has been the worst we have seen
since 2010..."
Photo credit:
Wildfire Management Branch.
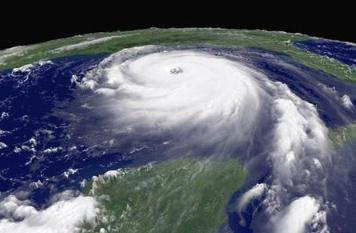
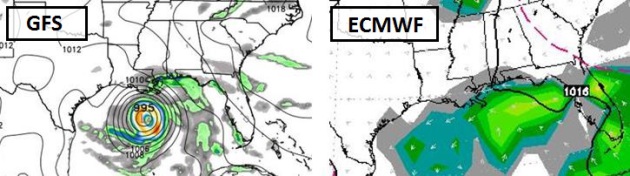
Cheap Hurricane Hype?
Is it just noise - or a signal for something we need to keep an eye on?
A tropical wave east of the Lesser Antilles has a 50% probability of
strengthening into a tropical system within 5 days, according to NOAA
NHC. The forecast for midday Wednesday, August 27, one week from today,
shows a tropical storm or hurricane in the Gulf of Mexico on the GFS,
but the ECMWF (European) model isn't buying it, not yet. If you live
along the Gulf Coast you might want to keep an eye on this. I tend to
favor the ECMWF, especially with tropical development, but it would be
unwise to ignore the GFS altogether. GFS model: Weather Bell; ECMWF
guidance: WSI.

Summer of Research to Improve Hurricane Forecasting.
In addition to flying into hurricanes (the USA is still the only nation
on Earth that does this on a routine basis) NOAA is using two Global
Hawk drones to go where no aircraft can go, providing additional data
streams that may help forecasters, especially with intensity. Here's an
excerpt from NOAA: "...Such
targeted observations help significantly improve forecast models for
predicting hurricanes, especially when the data can be gathered on a
nearly continuous basis for an extended period in areas not now being
observed. This fall, NOAA will join with NASA to launch two 115-foot
wingspan Global Hawks. These unmanned aircraft will take off from
Wallops Island, Va., on several data-collecting missions during five
weeks at the height of Atlantic hurricane season. “With the Global Hawk we can fly farther out over the ocean and get to storms that manned aircraft cannot reach..."
Photo credit: "
Releasing
dropsonde. The Global Hawk can deploy multiple dropsondes at altitudes
up to 65,000 feet to collect measurements of temperature, pressure,
relative humidity and wind speed and direction." (NOAA).
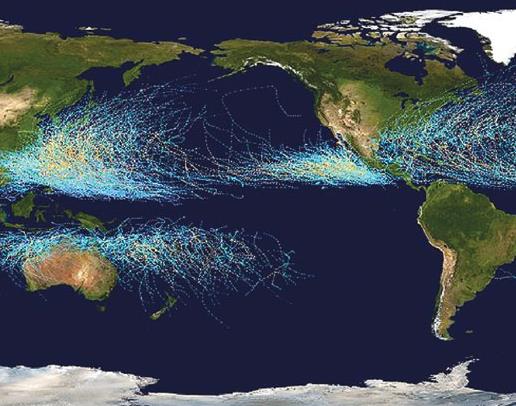
Danger: Shifting Tracks.
Data shows that hurricanes are reaching peak intensity consistently
farther north, another symptom of a warming atmosphere and shifting
weather patterns. Here's a clip from
MIT Technology Review: "
Powerful,
destructive tropical cyclones are reaching their peak intensity farther
from the equator and closer to the poles, according to a study
coauthored by an MIT scientist. The study, published in Nature, shows
that over the last 30 years, tropical cyclones—also known as hurricanes
or typhoons—have been moving poleward at a rate of about 33 miles per
decade in the Northern Hemisphere and 38 miles per decade in the
Southern Hemisphere..."
Map credit above: "
Tropical
storm tracks from 1985 to 2005 reflect the poleward migration of
cyclones over the last three decades. Such storms now tend to peak
farther away from the equator."
 Airborne Phased Array Radar Could Spur a "Quantum Leap" in Hurricane Forecasts
.
Meteorologists do a good job with track, but predicting intensity
changes is more problematic. Will a next-generation doppler system help?
Here's an excerpt of a story at
The Capital Weather Gang: "
Forecasts for the tracks of hurricanes have made huge strides over the past 15 years, improving by over 50 percent.
But forecasts for the intensity of hurricanes have lagged, with only
modest gains in accuracy seen very recently. A new technology under
development at the National Center for Atmospheric Research (NCAR),
known as Airborne Phased Array Radar (APAR), could be a game-changer for
improving forecasts for hurricane intensity and other types of severe
weather, according to those familiar with the project..." (3-D visualization of Hurricane Katrina: NASA).
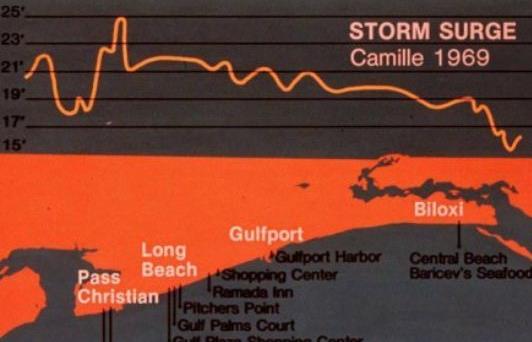
Hurricane Camille: What If It Struck New Jersey?
As waters continue to warm could more intense hurricanes systematically
find their way farther north, threatening larger population center of
the Northeast? The idea isn't as far-fetched as it sounds. Here are a
few excerpts from an article at
Asbury Park Press: "...
Camille's
surge was about 25 feet high while Sandy's storm tide (storm surge and
astronomical tide) was roughly 14 feet at Sandy Hook, according to NOAA.
Moreover, Camille's estimated peak winds were more than twice as strong
as Sandy's....Experts have told me over the years that a Category 4
storm is the strongest hurricane that could threaten New Jersey because
ocean waters aren't as warm off our coast as they are down south. Still,
the storm surge from a Category 4 storm would move up to several miles
inland in parts of Monmouth and Ocean Counties, according to maps on the New Jersey Office of Emergency Management website..."
Map credit above: "
Hurricane Camille's storm surge was 24.6 feet high along part of the Mississippi coast." (Photo: NOAA Satellite and Information Service).
Tornado-Proof Shelter for Holdrege Students.
Here's an elementary school in Nebraska that is taking the lead in
protecting students and staff, an excerpt of an interesting story at
KHGI-TV: "...
Safety
is what parents want and demand when leaving their kids in the hands of
teachers. Now those in Holdrege can breathe a sigh of relief as a new
storm shelter can withstand 250 mile per hour winds is being built. Todd
Hilyard, the superintendent for Holdrege Public Schools looked over the
latest plans for the new elementary school. "All of this, both the
exterior walls as well as the interior, are masonry block walls with
rebar and concrete fill as well as a concrete roof on top of the storm
shelter," he said. "I think every superintendent's heart is in the right
place and unfortunately these are expensive areas to build..."
Secrets of Iceberg That Sank The Titanic Revealed In New Study.
It turns out 1912 may not have been much of an above-average year for
big icebergs. Then again, all it takes is one. Here's an excerpt from a
story at
Huffington Post: "...
Aside from reshaping long-held theories about the Titanic tragedy, the new findings -- described in a paper published online in July 2014 edition of the journal Significance
-- may hold an important warning for seagoing vessels today. “As use of
the Arctic, in particular, increases in the future, with declining
summer sea ice the ice hazard will increase in waters not previously
used for shipping," the researchers conclude in the paper. "As polar ice
sheets are increasingly losing mass as well, iceberg discharge is
increasing... and increasing global warming will likely cause this trend
to continue."
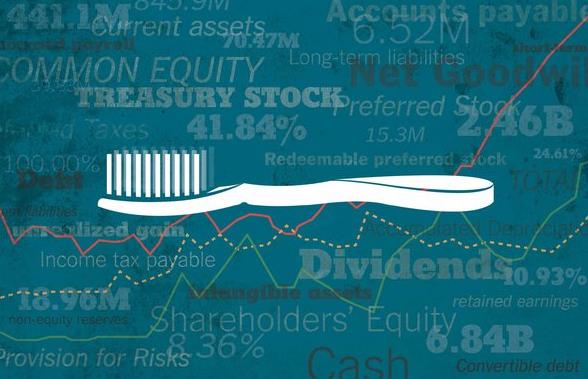
In Silicon Valley, Mergers Must Meet The Toothbrush Test. I like the sound of this - pay for things you use every day. Here's an excerpt of an interesting article at
The New York Times: "
When deciding whether Google should spend millions or even billions of dollars in acquiring a new company, its chief executive, Larry Page,
asks whether the acquisition passes the toothbrush test: Is it
something you will use once or twice a day, and does it make your life
better? The esoteric criterion shuns traditional measures of valuing a
company like earnings, discounted cash flow or even sales. Instead, Mr.
Page is looking for usefulness above profitability, and long-term
potential over near-term financial gain..."
Graphic credit above: Liz Grauman/The New York Times.
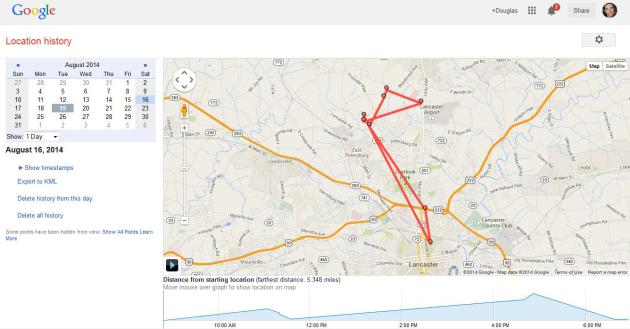
The NSA Has Nothing on Google.
Do you want to see exactly where you were, on any day in the recent
past, courtesy of Google Maps? If you are logged into Google, use Google
Maps and (obviously) have location services turned on, this should work
for you as well. Click on
location history
at google.com and you can take a virtual walk down memory lane as see
every place you've been going back months (years?). The very definition
of TMI...
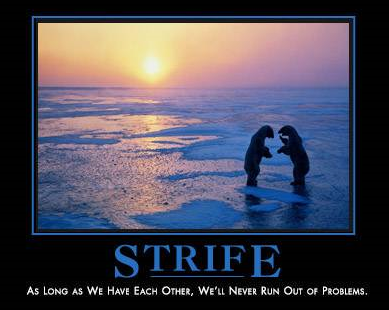
Robin Williams, Connectedness and The Need to End The Stigma Around Mental Illness.
Arianna Huffington takes a look at what all of us can learn, and how we
can help those struggling with depression, in this article at
Huffington Post; here's a clip: "...
So
while of course each instance of suicide is different, and while the
reasons that people choose to take their own life are complex and
individual, as we ask "why" about Robin Williams, we should also broaden
the question. Why tens of thousands of people? What is happening that
so many people make this irrevocable choice? What are we missing in our
culture? How can we open up the conversation on this issue to make other
choices seem more realistic and appealing?..."

Taku-Tanku Portable Tiny House Can Be Towed With a Bike.
This is looking better and better all the time. Can I jam in a
big-screen TV and flush toilet? Two words: low maintenance. Here's a
clip from a story at
Gizmag: "...
The
Taku-Tanku is aimed at being compact and affordable. Its interior can
accommodate two to three people and has a compartment to store some
luggage or belongings. It is also equipped with solar-powered LED
lights. There are no frills inside, however. The house is simply said to
be easy to build with off-the-shelf and re-purposed materials, and able
to provide shelter in a variety of landscapes..."
So Bad It's Good. The worst TV commercial ever made? I've actually seen worse, but in a way this campy, off-tune, train-wreck of a :30 spot for a Missouri shopping mall is
pure genius. It may be awful, but 1.3 million people have checked it out on
YouTube. Who do you think is getting the last laugh?
TODAY: Warm sunshine, still pleasant. Winds: SE 10. High: 84
WEDNESDAY NIGHT: Clouds, a few T-storms likely. Low: 70
THURSDAY: Muggy and hot, few T-storms with locally heavy rain. Some PM sun. Dew point: 70. High: near 90
FRIDAY: Drier, still steamy with more sun. Dew point: 67. Wake-up: 69. High: 89
SATURDAY: Sticky sun, PM T-storms. Dew point: 69. Wake-up: 70. High: 87
SUNDAY: Partly sunny. Stinking hot. Wake-up: 68. High: near 90
MONDAY: Blue sky, breathing much easier. Dew point: 53. Wake-up: 63. High: 73
TUESDAY: Sunny start, late showers. Dew point: 49. Wake-up: 57. High: 72
Climate Stories...
How The World's Biggest PR Firm Helps Promote Climate Change Denial. Here's the intro to an eye-opening story at
Motherboard. What a shock, it's all about the money: "
When a recent Guardian survey
asked top public relations firms if they would refuse to represent
organizations that denied climate change, the response was encouraging:
ten of the largest said they would. Decidedly less inspiring was the
response of the world's single biggest PR company, Edelman, which said
it would not rule out helping corporations spread messages of climate
change denial. This shouldn't be too surprising, seeing as how it's
already doing precisely that. A lot. Edelman helps polluting companies
use TV ads, astroturf groups, and slick websites to promote climate
change denial around the globe..."
Photo credit above: "
CEO Richard Edelman speaking at Davos in 2011." Image:
Robert Scoble/Flickr
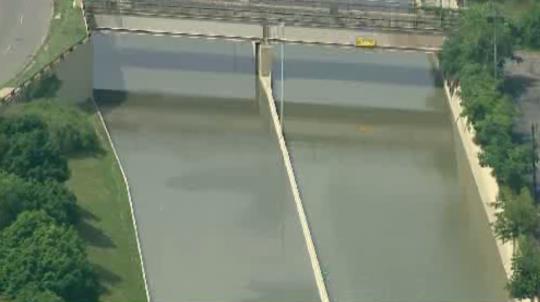
Did Global Warming Cause "The Great Flood of 2014?" Detroit meteorologist (and friend) Paul Gross provides a thoughtful, scientifically accurate answer to that question at
clickondetroit.com; here's an excerpt: "
People have been asking me if last week’s historic flood
was caused by global warming. The short answer is NO, but read on
because this answer requires an explanation. Weather systems develop
all the time, and have been doing so for as long as we’ve had weather on
this planet. The weather system that developed and dumped a once-every-500-year rain event
on metro Detroit last week may have developed anyway. HOWEVER, our
warming climate might have made that weather system a heavier
rain-producer than it might have been..."
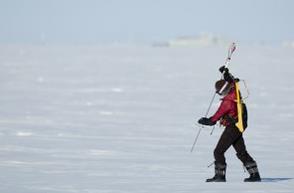
Snow Has Thinned on Arctic Sea Ice. Here are some of the latest findings from
The American Geophysical Union: "
Scientists
have been tracking snow depth on Arctic sea ice for almost a century,
using research stations on drifting ice floes and today’s radar-equipped
aircraft. Now that people are more concerned than ever about what is
happening at the poles, a new study confirms that snow has thinned
significantly in the Arctic, particularly on sea ice in western waters
near Alaska. The new assessment,
accepted for publication in the Journal of Geophysical Research:
Oceans, a publication of the American Geophysical Union, combines data
collected by ice buoys and NASA aircraft with historic data from ice
floes staffed by Soviet scientists from the late 1950s through the early
1990s to track changes over decades..."
Photo credit above: "
Researcher
Melinda Webster uses a probe to measure snow depth and verify airborne
data. She is walking on sea ice near Barrow, Alaska in March 2012. Her
backpack holds electronics that power the probe and record the data." Chris Linder / Univ. of Washington.
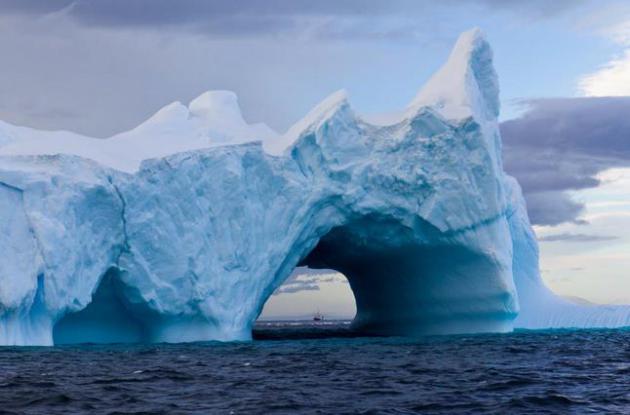
Antarctica Could Raise Sea Level Faster Than Previously Thought. Here's a clip from a story at
redorbit.com that caught my eye: "
Ice discharge from Antarctica could contribute up to 37 centimeters to the global sea level rise
within this century, a new study shows. For the first time, an
international team of scientists provide a comprehensive estimate on the
full range of Antarctica’s potential contribution to global sea level
rise based on physical computer simulations. Led by the Potsdam
Institute for Climate Impact Research, the study combines a whole set of
state-of-the-art climate models and observational data with various ice
models. The results reproduce Antarctica’s recent contribution to sea
level rise as observed by satellites in the last two decades and show
that the ice continent could become the largest contributor to sea level
rise much sooner than previously thought..."
File photo credit: Eric Mohl/Special to the Star Tribune. "
Stunning views like this one compel people to brave the seas to get to Antarctica."
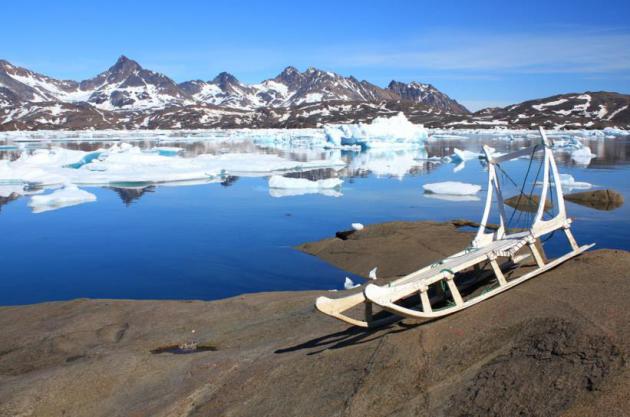
Meet The Companies That Are Trying To Profit From Global Warming.
As I've said (ad nauseum) climate change and climate/water volatility
represents a threat, and an opportunity. Many, even most of the
solutions will come from the private sector. Here's an excerpt of a
story at
Vox: "...
Greenland has taken advantage of the warming Arctic — which is melting the ice and opening new mining opportunities — to push for independence from Denmark. The government is already anticipating millions of dollars in new tax revenue as oil and gas rush north. Alcoa even has plans for a massive aluminum smelter there — powered by Greenland's rivers of melting ice. Dutch engineers are selling their storied flood-management expertise to countries threatened by sea-level rise. One company, Dutch Docklands, is pitching visions of floating cities to regions that could eventually find themselves underwater..."
Photo credit above: "
Tasiilaq, Greenland — one country that could stand to benefit from a warmer climate." Christine Zenino/Flickr
A Global Warming "Speed Bump"?
Here's an excerpt of a good explanation of what's really happening,
increasing trade winds pulling some of the excess heating of recent
years into the oceans. Almost like the planet is trying to compensate
for our stupidity. Here's a clip from The Union of Concerned Scientists: "...Even
as a car slows down to go over a “speed bump,” there is no question the
car is still advancing down the road. Similarly, the global average
surface temperature trend of late is like a “speed bump” and we would
expect the rate of temperature increase to speed up again just as most
drivers do after clearing the speed bump. We keep getting questions
about this air temperature trend that has more to do with where the excess heat is primarily going —
the ocean — and the rate at which heat transfers to the deep ocean, as
well as other factors that can temporarily offset the influence of
heat-trapping gases..."
What I Learned From Debating Science With Trolls. Here's an excerpt of a post at
The Conversation, one of many tactics used by denialists; this one focused on perverting Galileo's legacy: "...
The Galileo Gambit
is a debating technique that perverts this history to defend nonsense.
Criticisms by the vast majority of scientists are equated with the
opinions of 17th century clergy, while a minority promoting
pseudoscience are equated with Galileo. Ironically, the Galileo Gambit
is often employed by those who have no scientific expertise and strong
ideological reasons for attacking science. And its use isn’t restricted
to online debates..."
Graphic credit above: "
Galileo Galilei understood the power of observations." Wikimedia


What's the difference between a high "near 90" and a high of 89?
ReplyDelete