72 F. high in the Twin Cities Friday.
79 F. average high on August 26.
75 F. high on August 26, 2015.
August 27, 1992: A chilly night in Embarrass, where the temperature dips to 28 degrees.
 Weather Maps Looks Summery Into Early September
Welcome armchair meteorologists. We've been expecting you! Technology has unleashed the democratization of meteorology.
20
years ago you watched TV or listened to the radio, hoping to get some
idea how the weather would affect your plans. Legacy media isn't going
away anytime soon but with web sites, social media and smartphone apps
you can dial up the forecast on your schedule, interpret the latest
Doppler radar screen centered on your GPS location, see tornado videos
posted on Twitter and Facebook to gauge the level of risk. It's a brave
new world out there.
Weather models continue to improve (slowly)
but there's a maddening level of uncertainty around the storm pushing
into the Bahamas. ECMWF (Euro) solutions brush the southeast coast as a
minor storm, but NOAA models print out a big hurricane in the Gulf of
Mexico next week.
Showers today are most likely up north; a few hours of rain (on-a-stick) may temporarily dampen spirits. 80s return
Sunday and much of next week; 90F possible by next weekend.
Meteorological Autumn begins
on Thursday. Tell that to the atmosphere.
 Aeris Weather Briefings
:
Issued Friday morning,
August 26, 2016.
*
Invest-99 tropical depression still disorganized - not forming as
rapidly as predicted - future track/intensity is an even bigger mystery
than usual.
* High level of confidence that Invest-99 will impact Florida as a weak tropical storm by
Sunday-
Monday, with flash flooding and winds in the 30-50 mph range.
*
From there confidence levels drop off. Latest ECMWF (European) model
takes a tropical depression or weak Tropical Storm (Hermine) up the east
coast of Florida, brushing the Carolinas with heavy rain, but no major
intensification.
* NOAA models keep trying to strengthen Hermine
into a potentially major hurricane over the Gulf of Mexico, where water
temperatures are the rough equivalent of bathwater and wind shear is
less - meaning more favorable conditions for strengthening early next
week.
* Prepare Florida facilities for heavy rain, strong surf and
sporadic power outages and keep an eye on latest briefings for a
possible second (stronger) landfall next week along the Gulf Coast.
*
We don't know what we don't know. For now any future Tropical Storm or
Hurricane Hermine is an enigma wrapped in a riddle. We should pay
attention to model trends, not panic, but also not let our collective
guard down anytime soon.
Disorganized Mess.
The latest satellite image shows a cluster of T-storms north of Haiti.
Circulation is still sloppy and unimpressive - conditions may become
slightly more favorable for strenthening as Invest-99 approaches the
Bahamas. NOAA NHC now says a 20% risk of reaching tropical storm
strength
within 48 hours, but a
60% chance within 5 days. Map: Aeris AMP.
Spaghetti Plot.
The ECMWF (European) solution taking a weak tropical depression or
storm up the east coast of Florida into the Carolinas is an outlier,
but based on past history and performance of ECMWF it would be unwise to
discount it altogether. NOAA models bring Invest-99 over the Florida
Keys into the Gulf of Mexico early next week, where additional
strengthening is possible. Map: TropicalTidbits.com.
European Solution: Monday Morning. The latest ECMWF brings a tropical wave or (weak) tropical storm near Miami by
Monday
mornings, hinting a flash flooding for the Atlantic coastline of
Florida into the coastal Carolinas early next week. This is considerably
different from NOAA's solutions. Map: WSI.
NOAA HWRF: Sunday Evening. NOAA's high-resolution hurricane model suggests sustained winds over 39 mph for the Florida Keys and Naples area by
Sunday
evening, when Invest-99 may mature into "Hermine". Heavy, windswept
rains are likely across south Florida and the Keys, including the Miami
area and Naples/Sarasota. Map: WeatherBell.
NOAA HWRF: Wednesday Morning.
This is why we can't let our guard down just yet. NOAA's most accurate
hurricane model (consistently) strengthens Hermine into a major
hurricane over the warm waters of the Gulf of Mexico early next week.
I'm not buying (or believing) this solution just yet, but we can't
ignore the possibility that, however disorganized the tropical wave is
today, rapid strengthening may occur next week. Map: WeatherBell.
High Confidence Level: Heavy Rains for Florida.
Models print out 5-7" rains for south Florida and the Panhandle.
Precise amounts will depend on the final track, but facilities that
often flood in Florida will probably experience problems from
Invest-99/Hermine in a
Sunday-
Tuesday time frame.
Summary:
The hurricane forecast is rarely black or white, but ususally some
nebulous shade of gray. Such is the case this morning. We all want to
err on the side of caution and safety and not over-hype (any) storm, but
there's still a significant risk of a hurricane forming in the Gulf of
Mexico next week; in my opinion a 50-50 probability. Either way Florida
will experience flooding rains by early next week.
Another update
Saturday morning. With any luck the situation will crystalize a bit.
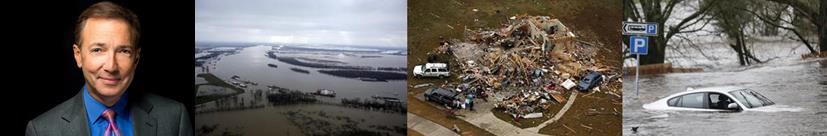
Paul Douglas, Senior Meteorologist, AerisWeather
Hurricanes Are Worse, But Experience, Gender, and Politics Determine If You Believe It. Here's an excerpt of interesting new research from
Princeton University: "...
The
researchers plumbed data from a survey of Gulf Coast residents and
found that the severity of the most recent storm a person weathered
tended to play the largest role in determining whether they believed
storms were getting worse over time, according to the study
published in the International Journal of Climatology. The survey was
conducted in 2012 before Hurricane Sandy, the second-most expensive
hurricane in history, caused $68 billion in damage. Respondents'
opinions also strongly differed depending on whether they were male or
female, whether they believed in climate change and whether they were a
Democrat or a Republican. For instance, people who believe in climate
change were far more likely to perceive the increasing violence of
storms than those who did not. The researchers noted that because
climate change has become a politically polarizing issue, party
affiliation also was an indicator of belief in strengthening storms..."
Map credit: "
Princeton
University-led research found that people's view of future storm threat
is based on their hurricane experience, gender and political
affiliation, despite ample evidence that Atlantic hurricanes are getting
stronger. This could affect how policymakers and scientists communicate
the increasing deadliness of hurricanes as a result of climate change.
The figure above shows the wind speed of the latest hurricane landfall
(left) on the U.S. Gulf Coast by county up to 2012, with red indicating
the strongest winds. The data on the right show for the same area, by
county, public agreement with the statement that storms have been
strengthening in recent years, which was posed during a 2012 survey.
Blue indicates the strongest agreement, while red equals the least
agreement."
(Image courtesy of Ning Lin, Department of Civil and Environmental Engineering).
Thunder Threat.
NOAA's 4km NAM guidance suggests the heaviest showers and storms will
pass southeast of MSP, and across the Red River Valley and far northern
Minnesota. Most of today should be dry in the metro area with a better
chance of T-storms tonight into Sunday. Future Radar: AerisWeather.
Summer Holding On.
Thursday marks the first day of meteorological autumn. On average the
90 warmest days of the year ends around September 1. Maybe not this
year. ECMWF guidance shows a streak of 80s, maybe 90F by the end of the
week. MSP meteogram: WeatherBell.
 Soggy Days At The Minnesota State Fair
. Expect puddles on Saturday at the fair, but it could be worse, as described by the
Minnesota Climatology Working Group: "...
The
wettest fair was in 1977 with 9.48 inches, and the driest fair was 2003
with only .02 inch of rain... The largest rain event in the State
Fair's history was 4.06 inches on August 30, 1977. At 8:20 pm heavy
rains hit the State Fair. The U of M St. Paul Campus climate observatory
½ mile north of the fairgrounds saw 4.06 inches of rain. This caused
some of the worst street flooding seen at the fairgrounds. The bulk of
the rain fell in a 3 1/2 hour period from 8:15pm to 11:45pm. The
grandstand show was cancelled, and people had great difficulty trying to
leave the fair. The Twin Cities International Airport saw 7.28 inches
from this event, second only to the 1987 'Superstorm." People driving on
I-94 leaving the fair found water "up to their hood ornaments" in low
areas under bridges..." (photo credit: Minnesota Historical Society).
Starbucks Manager's Quick Thinking Saves Customers During Kokomo Tornado.
WTHR-TV in Indianapolis has the story: "
Among
the many impressive stories emerging from Wednesday's storms is Kokomo
Starbucks at the Markland Mall, which collapsed as powerful winds moved
through the area. The damage was caught on video.
Starbucks manager Angel Ramos instructed everyone to get in the
bathrooms. He was not allowed to give an on-camera interview, but he
likely saved some lives by following the plan to seek shelter..."
As Sea Levels Rise, Nearly 1.9 Million U.S. Homes Could Be Underwater By 2100. Here's an excerpt from
The Washington Post: "
The real estate data firm Zillow recently published a research analysis
that estimated rising sea levels could leave nearly 2 million U.S.
homes inundated by 2100, a fate that would displace millions of people
and result in property losses in the hundreds of billions of dollars.
More than 100,000 of those homes would be in Maryland and Virginia,
according to the analysis. Another 140,000 would be submerged in the
Carolinas. And Florida would face the gravest scenario of any state,
with one in eight properties in danger of being underwater. For the
moment, let’s leave aside the larger debate about how much the water
actually will rise..."
The EPA's Chance to Make Air Travel Greener. Here's an excerpt from
Bloomberg View: "
The Environmental Protection Agency's intention to limit greenhouse-gas emissions from airplanes may sound like a small thing. U.S. aircraft are responsible for just 3 percent of U.S. carbon dioxide emissions, and 0.5 percent
of total emissions worldwide. In the U.S., coal-fired power plants
generate almost seven times as much carbon dioxide as planes. But air
travel grows by 5 percent a year, and by 2050, if nothing changes, the
industry will consume more than one-quarter
of the world's remaining "carbon budget" -- the amount of CO2 that can
be emitted without increasing global temperatures more than 1.5 degrees
Celsius above pre-industrial levels..."
 Exxon, The Olympics, and Greenwashing 2.0
. Here's an excerpt from a story at
GreenBiz: "...
How
much better off would all of us (and the planet) be if Exxon, with its
immense political, technical and financial throw-weight, actually was
committed to leading the way to the clean energy future? And how poetic
would it be if Exxon led us to the clean-energy promised land using a
workforce which, in totality, actually resembled the ethnically,
racially and gender-wise perfectly diverse employee group featured in
the commercial? Clean-energy leadership is probably too much to ask of
this hydrocarbon colossus, but there still is a morality play here.
Should Exxon as a leader of the foremost climate-damaging industry be
applauded for pursuing new ventures and new sustainable technologies
that ultimately might transform its business, and the energy sector with
it?..."
Image credit:
GreenBizPhotocollage.
The Falling Costs of Solar Power, In 7 Charts. Dave Roberts has the story at Vox; here's a link and excerpt: "The
fate of the world depends on driving down the cost of solar power. Yes,
that’s a melodramatic way of putting it. But it’s not wrong. Any
scenario that has humanity avoiding the worst ravages of climate change
involves explosive global growth in solar power. That’s why the US
Department of Energy has a program, the SunShot Initiative,
devoted entirely to driving down the cost of electricity generated by
solar panels — the target is solar power with $1 per watt installed
costs by 2020, a 75 percent reduction in costs from 2010. So how’s that
going? Happily, Lawrence Berkeley National Laboratory (LBNL) releases a
set of reports each year devoted to tracking solar prices; they’ve just
released the latest editions. Long story short: Prices are steadily
falling, more or less on schedule..."
Graphic credit: LBNL
.

 TODAY
TODAY: Showers and T-storms possible - patchy clouds. Winds: SE 7-12. High: 75
SATURDAY NIGHT: Few T-storms, potentially heavy. Low: 63
SUNDAY: More sun, warming up nicely. Few scattered T-storms. Winds: S 8-13. High: 84
MONDAY: AM sunshine, few PM T-storms. Winds: S 10-15. Wake-up: 70. High: 85
TUESDAY: Sunnier and drier, still warm. Winds: NE 7-12. Wake-up: 67. High: 82
WEDNESDAY: Lot's of sun, very pleasant. Winds: SE 8-13. Wake-up: 62. High: 83
THURSDAY: Hazy sun, sticky again. Winds: S 10-20. Wake-up: 63. High: 85
FRIDAY: Intervals of sun, almost hot. Winds: S 10-20. Wake-up: 66. High: 88
Climate Stories...
Just 90 Companies Are To Blame for Most Climate Change, This "Carbon Accountant" Says. Here are a couple excerpts from
Science AAAS: "...
Heede
is less well known than his fellow recipients, but his work is no less
threatening to the fossil fuel industry. Heede (pronounced "Heedie") has
compiled a massive database quantifying who has been responsible for
taking carbon out of the ground and putting it into the atmosphere.
Working alone, with uncertain funding, he spent years piecing together
the annual production of every major fossil fuel company since the
Industrial Revolution and converting it to carbon
emissions....Heede's carbon accounting is already opening a new chapter
in climate change litigation and policy, helping equip plaintiffs who
believe they have suffered damages from climate change to claim
compensation. "Rick's work really helps connect the dots," says Marco
Simons, general counsel of EarthRights International, a Washington,
D.C.-based legal group that defends the rights of the poor..."
Graphic credit: J. You/
Science; (Data Source) Richard Heede.
Extreme Weather and Climate Change. Check out 2 experts I have a lot of respect for, Heidi Cullen and Admiral David Titley (retired) at
WHYY's Radio Times podcast: "
Severe
flooding in Louisiana has killed 13 people and damaged or destroyed
over 60,000 homes. In California, a five-year drought and scorching
weather has fueled the Blue Cut fire, among others in the state. And
around the globe, this past July was the hottest month on record. Are
these extreme weather events evidence of climate change? How do
scientists connect the dots and what weird weather should we expect in
the coming decades? This hour we’ll explore the link between intense
weather and the warming planet with HEIDI CULLEN, chief scientist at Climate Central, and DAVID TITLEY,
a professor of meteorology at Pennsylvania State University and the
founding director of their Center for Solutions to Weather and Climate
Risk."
Humans Have Caused Global Warming for Longer Than We Thought. Here's an excerpt from a story at
TIME: "
People
have been contributing to global warming since the mid-nineteenth
century, decades before scientists previously estimated, according to
new research
published in the journal Nature. The study questions the perception of
climate change as primarily a 20th century phenomenon and provides new
evidence of how quickly the Earth’s atmosphere responds to increased
levels of greenhouse gas emissions. Even relatively low levels of
greenhouse gas emissions in the first decades of the Industrial
Revolution contributed to a temperature increase, according to the
research..."
Paper. The research referenced in the TIME article above is available at
nature.com
Climate Change is Thawing Deadly Diseases. Maybe Now We'll Address It? The Guardian reports; here's an excerpt that got my attention: "...
In
2013, the National Academy of Sciences hosted a forum on the influence
of global environmental change on infectious diseases. In his keynote speech,
Dr Jonathan Patz stood in front of a large slide of a mosquito and
warned: “Global warming’s greatest threat may also be the smallest.” The
forum focused on many causes of disease, from fungi, bacteria, viruses
and mold spores, to vectors like bats and mosquitoes. Climate change can
exacerbate the spread of infectious disease by changing the behavior,
lifespans and regions of diseases and their carriers. This can sometimes
be hard to prove directly. It can be challenging, for example, to
isolate the avenues by which climate change drives emerging infections
in warm climates where travel, trade, land use and dense urban living
can all lead to the spread of disease..."
Photo credit: "
In
addition to releasing ancient microbes, melting layers of permafrost
also release methane, a greenhouse gas 30 times more potent than carbon
dioxide, that in turn causes further warming." Photograph: Murdo Macleod for the Guardian.
Global Warming Is Melting the Greenland Ice Sheet, Fast. Here's an excerpt of a
Guardian article written by University of St. Thomas climate scientist John Abraham: "...
The
authors of this study did such an accounting and they discovered that
not only is Greenland losing a lot of ice, but the loss varies a lot
depending on location and year. For example, 2012 was a year of
incredible ice loss compared to other years. Also, the western side of
the ice sheet is losing much more ice than the eastern side. They also
found that a small part of the ice sheet (less than 1% of the sheet) is
responsible for more than 10% of the mass loss. In total, they estimate
approximately 270 gigatons of ice loss per year for 2011–2014. This
result is almost a perfect match to independent measurements made by
other researchers and builds our confidence in their conclusions. To put
this in perspective, the Greenland Ice Sheet is losing approximately
110,000 Olympic size swimming pools worth of water each year..."
Photo credit: "
Pools of melted ice form atop Jakobshavn Glacier, near the edge of the vast Greenland ice sheet." Photograph: Brennan Linsley/AP.


No comments:
Post a Comment