50 F. maximum temperature yesterday in the Twin Cities.
60 F. average high on October 12.
66 F. high on October 12, 2015.
.01" rain fell at KMSP yesterday.
October 13, 1917:
Record low temperatures occur across central Minnesota with
temperatures ranging from the low to mid teens to the upper teens and
lower 20s. St. Cloud records the coldest temperature of 10 degrees,
while Mora records a low of 13.
October 13, 1880:
An early blizzard strikes parts of southwest and west central
Minnesota. Huge drifts exceeding 20 ft in the Canby area would last
until the following spring.
October 13, 1820: A snowstorm at Ft. Snelling dumps 11 inches.
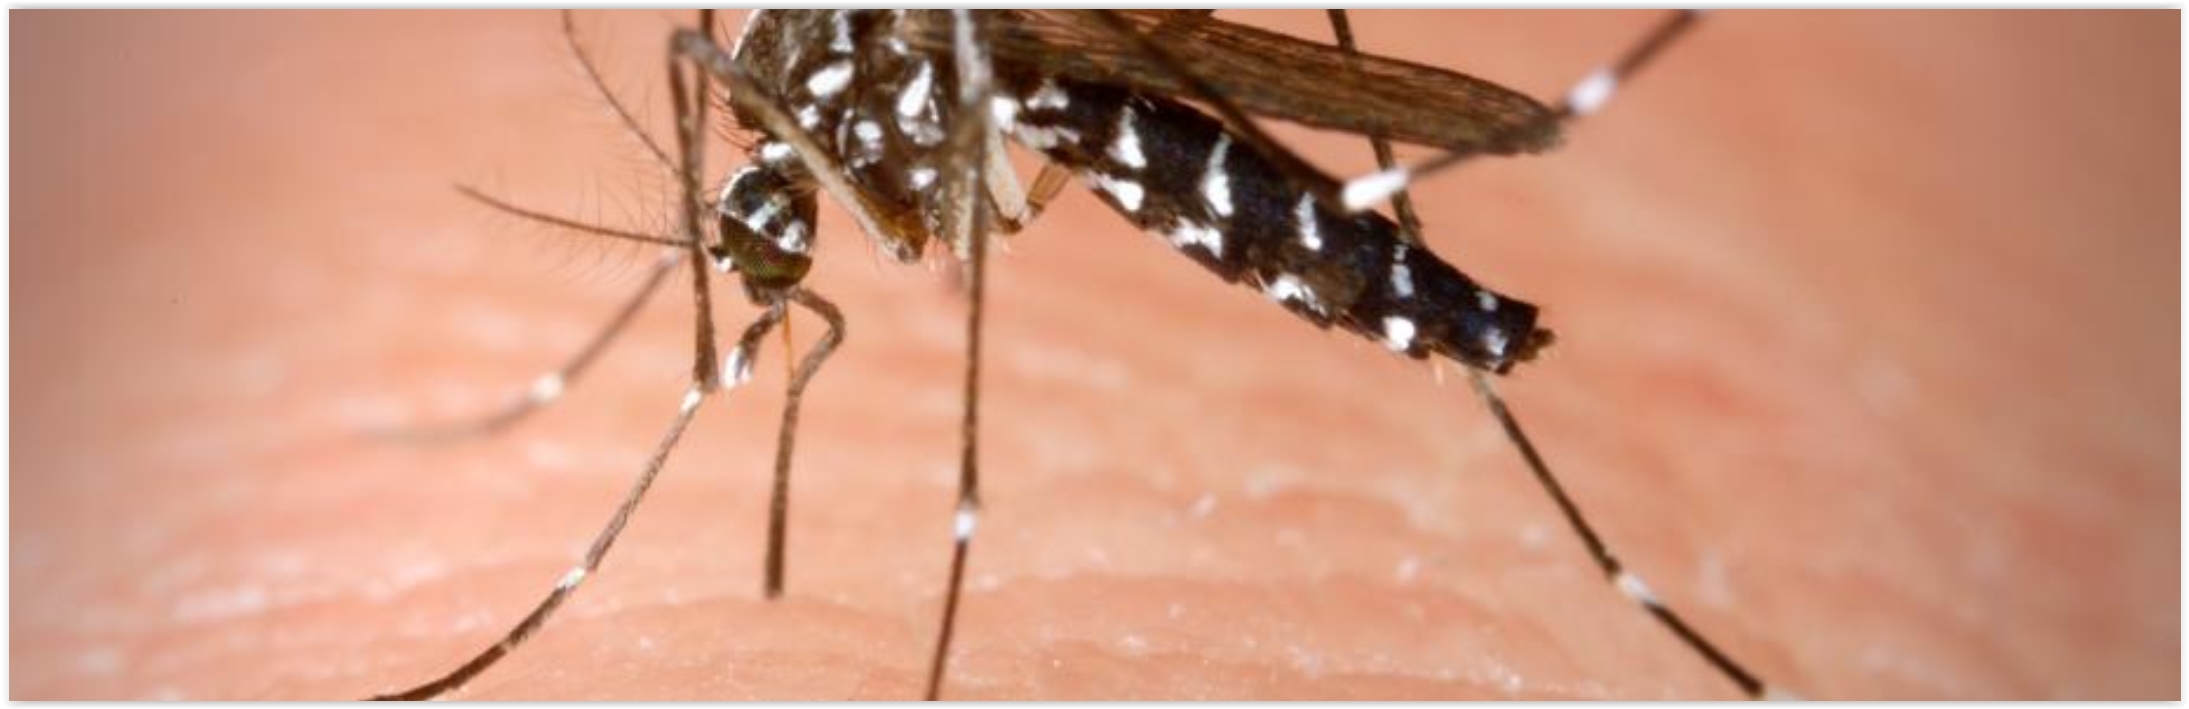
 RIP Mosquitoes: First Frost For Much of the Metro
The
first frost of fall is coming roughly a week later than usual for much
of the Twin Cities metro. The urban heat island (additional warmth
radiating from homes, businesses and a sea of asphalt) may keep the
immediate downtowns and close-in suburbs frost-free, but for the rest of
us the growing season is pretty much over.
The glass is
half-full, this is good news! Fewer mosquitoes, ragweed is toast - with
fewer symptoms for allergy sufferers. Fewer ticks, less weeding, more
raking. The joys of mid-October.
Like so many Minnesotans I miss
the sun more than the warmth; the next couple of months get
progressively cloudier; December the darkest month of the year here at
home. The sun is visible much of today and
Friday. Temperatures approach 70F
Saturday with a fleeting shower, but no widespread rain until late
Sunday and early
Monday.
A
damaging wind storm batters the Pacific Northwest this weekend but
models whisk the biggest, wettest storms south of Minnesota into next
week.
Colors are peaking now close to MSP. This may be THE weekend to check out flaming fall foliage!
7-Day Rainfall Prediction.
Here is the latest forecast from NOAA NCEP and a WPC ensemble showing
.50 to 1" of rain for much of Minnesota between today and next Thursday.
At the rate we're going this could easily wind up being one of the 3
wettest years on record for Minnesota. Map: WeatherBell.
A Rare Dry Spell.
No atmospheric leakage is expected today or Friday, but the chance of
showers increases over the weekend; NOAA models hinting at .5" to 1" of
rain by Tuesday of next week. Model trends: Aeris Enterprise.
From Frost to 70F in 60 Hours.
After waking up to a frost or freeze across much of Minnesota this
morning temperatures slowly moderate into Saturday, when mid-afternoon
temperatures may approach 70F, more than 10 degrees warmer than average.
Looks Like October.
The month of October can bring big temperature swings and strong winds,
the descent into winter leaves the atmosphere volatile and capable of
spinning up significant storms. Temperatures trend well above average
from Friday into the middle of next week, before the next inevitable
cold front arrives. MSP Meteogram with ECMWF data: WeatherBell.
Wild Wind Storm Brewing for Pacific Northwest.
NOAA's 4km NAM model shows winds at 900mb close to hurricane force by
this evening off the coast of Oregon and Washington; an intense,
tightly-wound storm capable of significant wind damage as it pushes
inland.
Category 4 Hurricane Nicole Heading Toward Bermuda Today.
Significant wind and wave damage is possible across Bermuda as a very
powerful Hurricane Nicole pushes north, passing almost directly over
Hamilton, Bermuda.
Hurricane Matthew Was Deceptively Powerful. Here's an excerpt from
NexusMedia
that got my attention: "...
Even a mild-mannered Category 1 or 2
hurricane can prove catastrophic if it produces enough rain. Hurricane
Matthew dumped 18 inches on parts of North Carolina — more rain than
Louisiana and Mississippi saw during Hurricane Katrina. Floods in the Tar Heel State destroyed 7,000 homes.
More than 2,000 people needed to be rescued. Time and again, we see
that water — not wind — wreaks the greatest havoc during severe storms.
Just ask New York. Hurricane Sandy registered as a Category 1 storm, but
it proved the second-costliest
hurricane in U.S. history. Hurricane Matthew followed a similar
pattern, prompting weather experts to criticize the wind-based system of
classification..." (Image credit: NOAA).
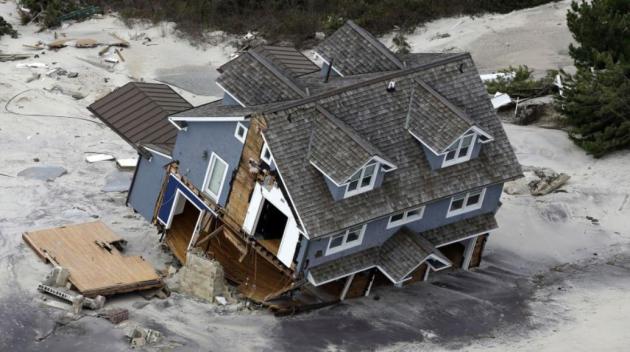
Hurricane Matthew: Before and After.
NOAA's National Ocean Service has the story and interactive graphics: "
From October 7-10, 2016, the National Geodetic Survey (NGS) collected damage assessment imagery for more than 1,200 square miles in the aftermath of Hurricane Matthew. The aerial imagery was collected in specific areas identified by FEMA and the National Weather Service.
Select the round icon with directional arrows using your mouse (or your
finger) and slide back and forth to view a "before and after"
comparison. "Before" images are provided by Mapbox, Digital Globe, and OpenStreeMap; "After" images were captured by NOAA's National Geodetic Survey in the aftermath of Hurricane Matthew..."
Fleeing the Coast Before the Storm, Only To Be Trapped Inland.
Which raises the inevitable question: where DO you put all those people
fleeing the coastal storm surge? Inland flooding may be just as big a
threat, as Matthew reminded meteorologists and emergency managers.
Here's an excerpt from
The New York Times: "...
Some
higher power may know exactly where hurricanes are going, but even with
modern technology, humans have to guess. As countless residents and
public officials learned in the last few days, this makes the question
of evacuations — whether or when to flee, who is in danger and who is
safe — an extraordinarily complicated call, and one particularly
vulnerable to second-guessing...Everybody’s a meteorologist,” said Mr.
Hodges, the former governor. “That’s part of the problem: They have
access to much of the same information and will be trying to make their
own decisions rather than waiting for some sort of specific evacuation
order..."
Twitter photo credit: Lorie Moore.
 Horrific Rains and Ocean Surge: Hurricane Matthew By The Numbers
. Here's a clip from The Washington Post
Capital Weather Gang: "...
In
the United States, record-setting amounts of rain have inflicted the
greatest amount of hardship, with the Tarheel state at ground zero. 15 inches of rain in eastern North Carolina has resulted in catastrophic inundation. Emergency officials have conducted 2,000 rescues of people stranded in high water in North Carolina alone. Nearly half of the state’s 100 counties were in a state of emergency, and 52 shelters housed more than 4,300 displaced people. Lumber River in North Carolina reached a record 24 feet above its usual level, while the Tar River at Rocky Mount crested seven feet above flood stage..."
Hurricane Matthew's Water Footprint. Here's a link to an amazing interactive web site from
USGS: "
Hurricane
Matthew approached the southeastern U.S. coast on October 7, 2016. In
the map above, the hurricane’s impact on precipitation and streamflow
are shown. Normalized discharge (cubic feet per second) at US Geological
Survey gaging stations within ~150 km of the eye of the hurricane is
shown in the right panel. Variation in the shape of the hydrographs
(right panel) is due to stream size, storm-surge, reservoir closures,
and other local conditions, which can impact the effect of precipitation
on flow. Gages shown do not include the US Geological Survey Short-Term
Network gages deployed to capture more detailed effects of the
hurricane."
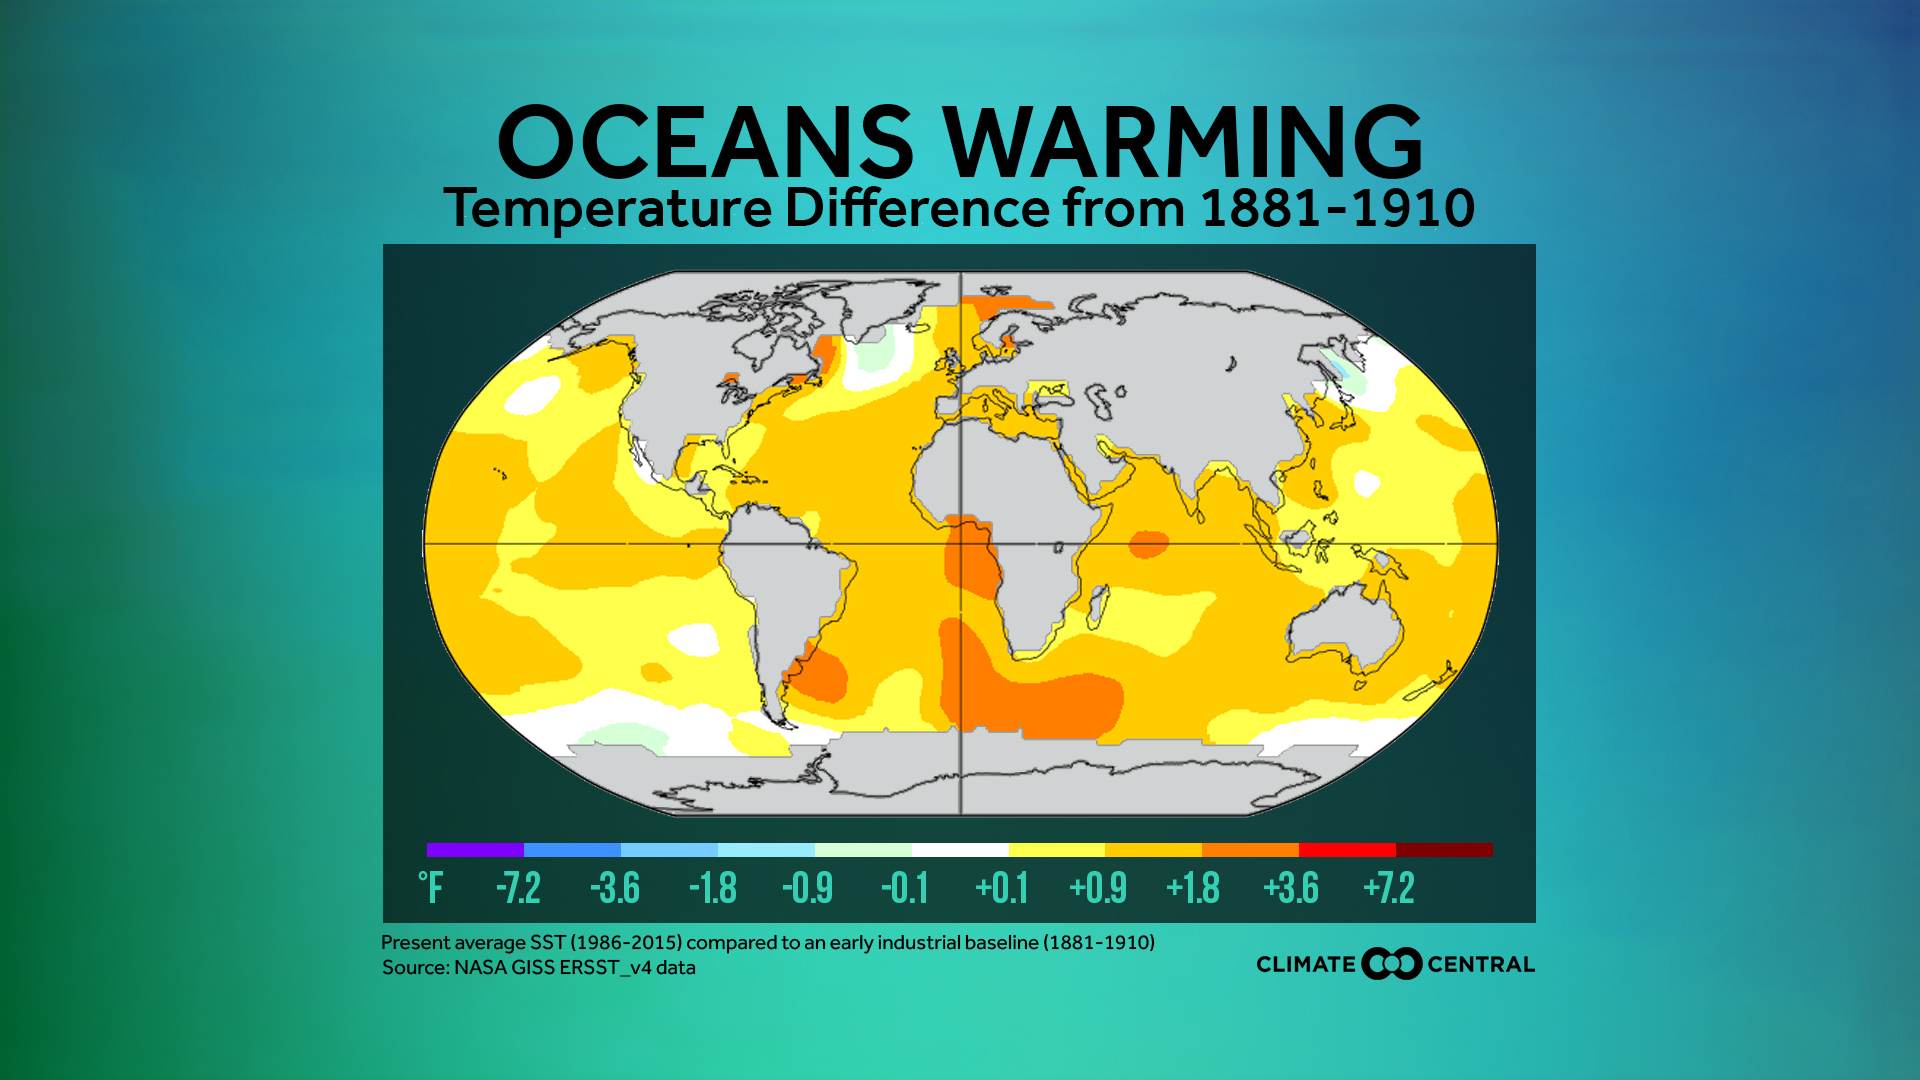
 How Did Hurricane Matthew Become So Threatening So Quickly? NOVA Next
has more perspective: "...Warm water fuels hurricanes, and over the
past week, water temperatures have been about 85° F in the Caribbean
where Matthew first intensified. While that is a little above normal,
the water off the Atlantic coast is even warmer when compared to the
seasonal normal. Average ocean temperatures have risen over the last
century,
with parts of the Atlantic now 1-2°F warmer than a century ago.
While warm water isn’t the only factor that determines how strong a
hurricane can get, it is a key ingredient. There is the expectation that
hurricanes and typhoons across the globe will last longer and produce
more rain by the end of the century, according to the research compiled
in the
2013 IPCC Fifth Assessment Report..."
Image credit: "
This visible image from NOAA's GOES-East satellite shows the location of Hurricane Matthew on October 7 at 2:30 pm EDT."
New York Is Going To Get A Lot More Hurricanes Like Sandy. The incidence of major flooding in New York has tripled since 1800 - the trends are troubling. Here's a clip from a story at Pacific Standard: "...When Hurricane Sandy
reached the Mid-Atlantic four years ago, it brought with it some of the
most severe flooding the region has ever seen. It also took a financial
toll, with damages totaling more than $71 billion—second only to
Hurricane Katrina among damage in the United States. And here comes more
bad news: Researchers report
that New York City is likely to get hit by many more floods on par with
Sandy in the future. “[T]he frequency of Hurricane Sandy-like extreme
flood events has increased significantly over the past two centuries and
is very likely to increase more sharply over the 21st century, due to
the compound effects of sea level rise and storm climatology change,” Ning Lin, an assistant professor of civil and environmental engineering at Princeton University, and her colleagues write today in Proceedings of the National Academy of Sciences..." (File image: Mike Groll, AP).
Do We Need A New Scale to Rate Hurricanes?
The current Saffir Simpson scale (1 to 5) factors winds and pressure to
predict storm surge damage, but says little about the potential for
inland flooding. Here's an excerpt from an analysis at
Climate Denial Crock of the Week: "...
With
North Carolina reeling from more than 17 inches of rain from Hurricane
Matthew, it’s time to face the fact that the way we measure hurricanes
and communicate their likely impacts is seriously flawed. We need a new
hurricane intensity metric that more accurately reflects a storm’s
potential to cause death and destruction well inland, rather than the
Saffir-Simpson Wind Intensity Scale, which focuses on the potential for
coastal damage from high winds and storm surge flooding..."
Driverless Cars, Electric Vehicles and Mass Transit Could Transform Cities.
Mashable has the story.
Photo credit: "
A traffic jam in Beijing, China, during World Car-Free Day, Sept. 22, 2014."
Utilities Squeezed as Corporations Seek Renewable Energy Elsewhere. Here's the intro to a story at
Midwest Energy News: "
As
large corporations increasingly demand 100 percent renewable energy,
many utilities are left in a bind: Add to their already excess capacity,
or they can risk losing new customers to lower-priced third-party
agreements. “We have to figure out how to thread the needle with
utilities,” said Letha Tawney who, as the director for utility
innovation at the World Resources Institute, spends many of her waking
and working hours trying to guide utilities into a new energy paradigm.
Many large power consumers have clearly demonstrated that, with or
without their local utilities, they are moving towards a renewable
future..."
Photo credit: "
More than half of new wind capacity in 2015 was contracted through power purchase agreements, according to AWEA."
 In Minnesota, Coal Still Has Its Defenders - Funded by North Dakota
. Here's the intro to a story at
Midwest Energy News: "
While
Minnesota utilities continue to turn away from coal, the industry still
has its champions in the state – with one group funded largely by North
Dakota taxpayers and coal companies. The Coalition For A Secure Energy Future, an offshoot of the Lignite Energy Council,
has met with legislators and candidates around Minnesota to discuss why
energy policies must feature coal as a future component of generation.
The coalition has a three year, $3.6 million budget, which the blog Bluestem Prairie first disclosed earlier this year..." (File photo: Darla Hueske).
World's Largest Mining Company Exploring Solar Plus Storage Potential. Here's an excerpt of a story at
PV Magazine: "...
One
of the main reasons for this change in outlook is that BHP now expects
renewable energy to reach cost parity with traditional energy sources
within the next 10 years. It highlighted Chile and Morocco as two places
where renewable energy sources can already compete with fossil fuels on
cost. Additionally, it pointed to the unprecedented rise in non-hydro
renewable generating capacity from China, who invested US$100 billion in
the sector in 2015 alone, and the increased interest in electric
vehicles, which is pushing battery development..."
Image credit: "BHP
will now partner with Origin Energy to test how solar and
battery-storage technology can be incorporated into its remote sites."
Air Pollution Is Yet Another Issue that Disproportionately Impacts Minority and Low-Income Communities. Here's a clip from Huffington Post: "...Coal-fired
power plants contribute to dangerous soot and smog, which compromises
air quality for us all, but especially for anyone who lives nearby. In
the U.S., these plants disproportionately harm African-American and
Latino communities. A startling 71 percent of African-Americans live in
counties that violate federal air pollution standards and 68 percent of
African-Americans live within 30 miles of a coal-fired power plant.
Hispanics are also 165 percent more likely to live in counties with
unhealthy levels of power plant pollution than non-Latino whites and
nearly 2 in 5 Latinos live within 30 miles of a coal-fired power plant..." (Image credit: Salon).
 The Next Zika
. 4 more potential reasons not to get out of bed today. Here's an excerpt from
Scientific American: "
Disease
detectives are on the lookout for obscure viruses that can be spread
among people by traveling insects, and quickly become a widespread
problem. Scientific papers are filled with illnesses to watch. Four
particular viruses now stand out to virologists and epidemiologists,
although it is not certain any of the ailments will become the next Zika or West Nile virus. But researchers give several reasons to keep a close eye on this quartet..." (Image credit: Climate Nexus).
Temperature and Precipitation Trends. The Twin Cities office of the National Weather Service has a
running tally of departure from normal for temperature and precipitation. As you can see (at a glance) rainfall has been running consistently above average since late July.
TODAY: Frosty start. Bright sunshine. Winds: SW 8-13. High: 55
THURSDAY NIGHT: Mostly clear and cool. Low: 40
FRIDAY: Partly sunny, milder breeze - a fine fall day. Winds: S 10-20. High: 67
SATURDAY: More clouds, passing shower. Winds: SW 10-15. Wake-up: 58. High: 69
SUNDAY: Peeks of sun, showers return at night. Winds: SE 8-13. Wake-up: 47. High: 64
MONDAY: Showers taper, still damp. Winds: NW 8-13. Wake-up: 53. High: 62
TUESDAY: Mostly cloudy, stray shower. Winds: NW 7-12. Wake-up: 48. High: 64
WEDNESDAY: Intervals of cool sunshine. Winds: W 5-10. Wake-up: 44. High: 59
* Photo credit: Mike Hall.
Climate Stories....
Greenland Is Melting From Above and Below - And Scientists Say They're Connected. Here's an excerpt at
The Washington Post: "...
As
a result, what is coming into focus is that there appears to be a
crucial interaction between ice melting on an ice sheet’s surface,
forming into pools and lakes, and ice falling directly into the ocean
where glaciers, extending out from the ice sheet’s center, terminate in
often extremely deep waters. But precisely how they work together — and
how much they could speed Greenland’s melt — is only beginning to reveal
itself. Two recent studies
in Geophysical Research Letters each home in on different aspects of
this linkage. And they do so by studying two apparently connected
phenomena: The formation of sometimes vast lakes of meltwater on the ice
sheet’s surface, and the release of huge “plumes” of meltwater beneath
outlet glaciers that themselves are mostly submerged in the ocean..."
Photo credit: "
A
crew sets out to retrieve a measurement device in a Greenland fjord and
passes by a small hanging glacier on its side wall that is unleashing a
stream of water into the ocean." (Dustin Carroll)
Why Climate Change Divides Us. The Christian Science Monitor reports: "...
Polls
show that the partisan divide is wider on climate change than any other
issue. In 2001, the gap between Republicans and Democrats on whether
climate change is real and human-caused was 17 percentage points. This
year, the gap stands at 41 points. Just 43 percent of Republicans now
believe climate change is human-caused, compared with 53 percent back
then. What has happened? How has public opinion become more fractured
even as scientists have moved toward consensus? Views of science play a
role, as does the willingness to take an economic hit to affect the
global temperature a degree or two. But Colorado shows how the divide on
climate has become as tribal as politics itself..." (File image: Shutterstock).
 Did Climate Change Turbocharge Hurricane Matthew?
 You could certainly make the case, especially for Haiti and Cuba. here's an excerpt from
Climate Signals: "...
Unusually
warm seas also fueled Matthew's rapid intensification and sustained the
hurricane which broke the record for maintaining Cat 4/5 strength in
October. Matthew first spun up into a hurricane on September 29, surging
from a tropical storm into a Category 5 hurricane in just 36 hours, a
stunning development consistent with the observed trend toward rapidly
intensifying tropical cyclones..." (October 5 file image: NOAA and AerisWeather).
 Climate Studies: New York City Flood Risk Will Triple, Western Wildfires Have Doubled
. Here's the intro to a summary at
Christian Science Monitor: "
Expect
more natural disasters as climate change goes unchecked, say
scientists. Already wildfires across the Western United States have doubled during the past three decades
as a result of human-induced climate change, according to a study
published Monday in the journal Proceedings of the National Academy of
Sciences. And that study coincides with another published in the same
journal predicting more dramatic flooding with rising global
temperatures..."
Photo credit: "
In July and
August, the Roaring Lion fire devoured more than 8,000 acres of forest,
along with over 60 homes and outbuildings in eastern Montana's
Bitterroot Range. Here, the fire burns through dense conifers, July 31,
2016.
" Courtesy of Mike Daniels/Columbia University
Climate Signals: Connecting Science to the Extreme Weather In Your Backyard.
Triple Pundit reports: "
One
of the biggest challenges in in raising awareness about climate change
is visualizing it: More often than not, it is made up of subtle,
hard-to-sense changes. Climate Signals, a new tool from Climate Nexus,
aims to address this with a real-time, Web-based, visual database for
climate-related events and impacts around the world.Though in the beta
phase, the tool is already impressive. It includes historical events –
such as the Great Chicago Heat Wave of 1995 – as well as modern ones,
such as Hurricane Matthew, which is barreling up the East Coast with a
rare force and power..."
Time For a Carbon Tax? A Former Bush Official Says Yes.
USA TODAY reports: "
Putting
a price on carbon emissions remains a divisive topic in the USA, even
as polls indicate considerable public support for actions to address
climate change. Voters in Washington state may show the way Nov. 8 when
they decide on a referendum that would assess a carbon tax on coal, oil
and natural gas, a move aimed at lowering emissions that contribute to
climate change without digging deeply into people’s wallets. Backed by a
campaign called Carbon Washington, the initiative is designed to be
revenue-neutral, gradually increasing the carbon tax while reducing
sales and other state taxes. A similar levy was established by
neighboring British Columbia in 2008..."
Warming Waters Impacting Lobster Distribution. Details from
NOAA's Climate.gov.


No comments:
Post a Comment