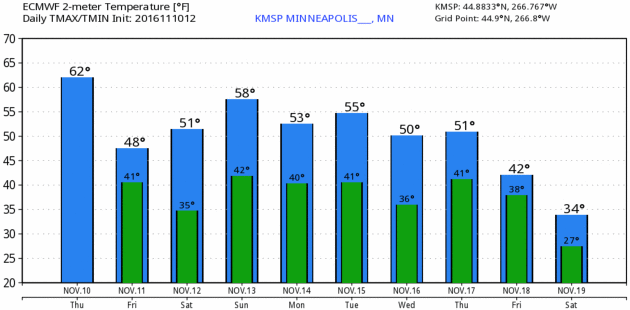
68 F. high yesterday in the Twin Cities. That's the average high on September 24.
45 F. average high on November 10.
61 F. high on November 10, 2015.
November 11, 1940:
The Great Armistice Day Blizzard kills 49 people in Minnesota. Food
dropped by Pilot Max Conrad saved stranded hunters. The barometer fell
to 28.66 inches at Duluth. Some roads were so badly blocked with snow
they weren't opened until Nov. 22.
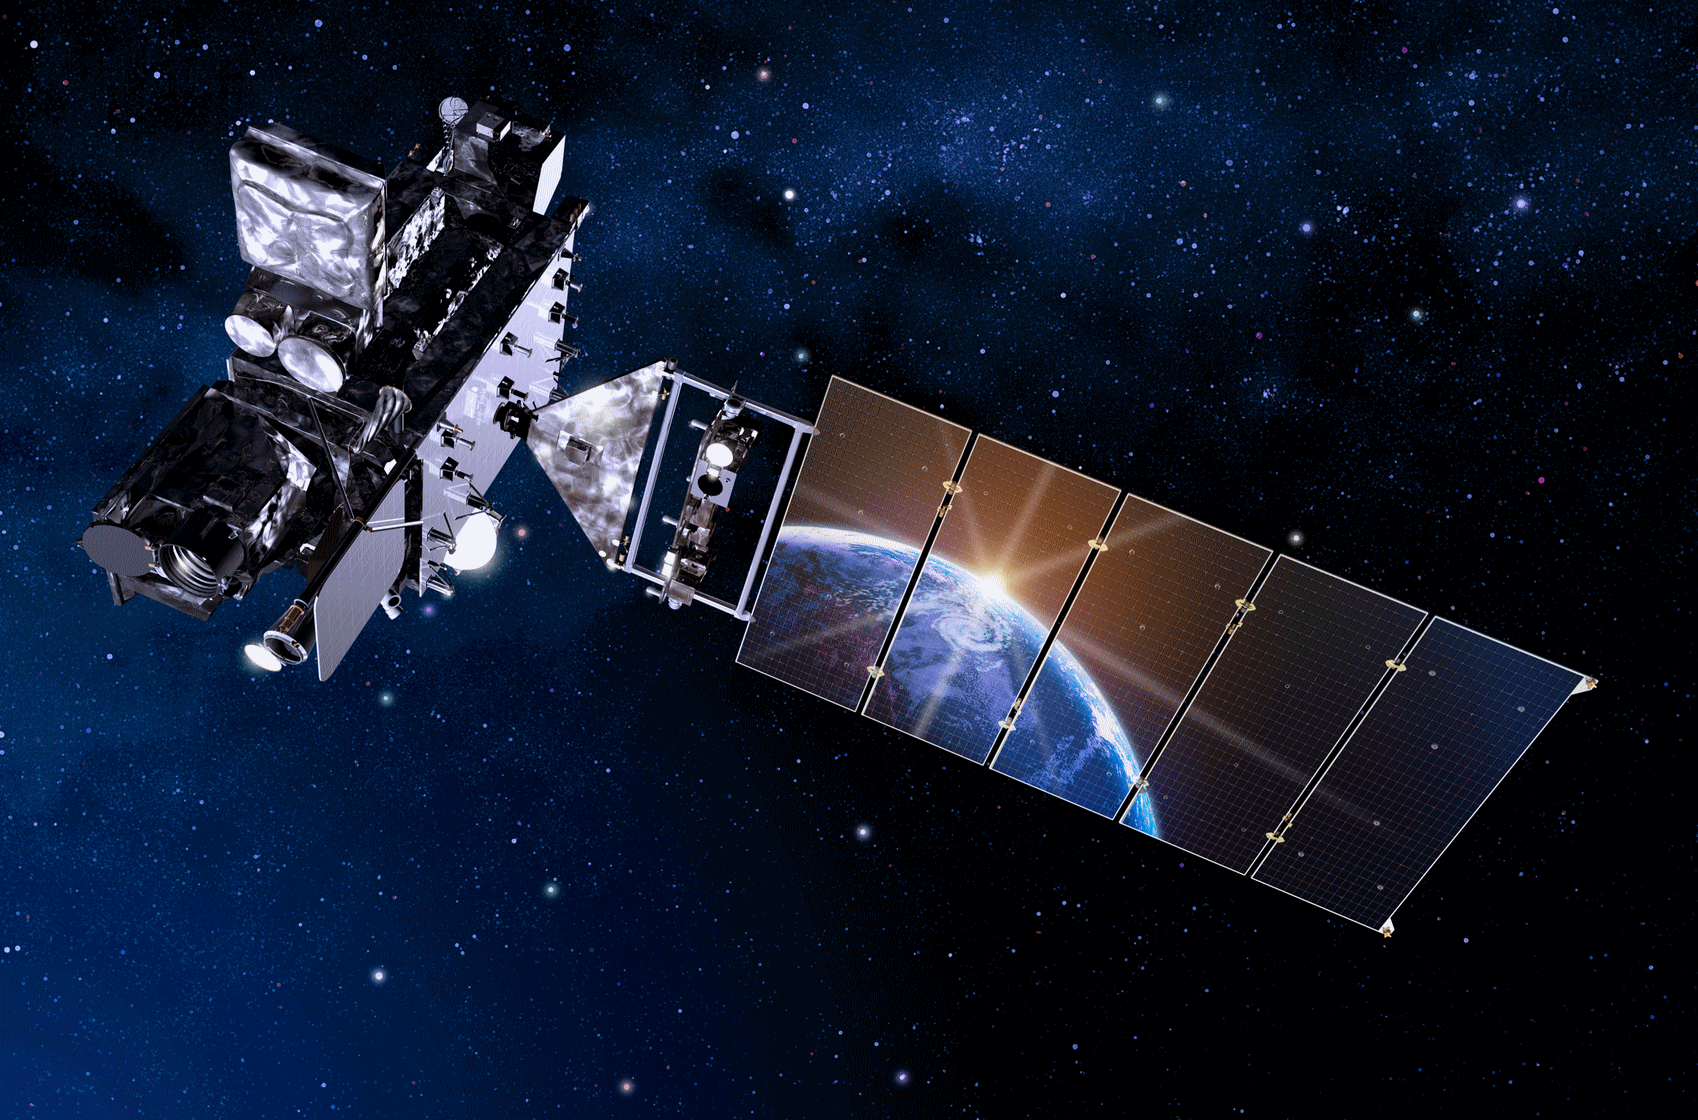 Revolutionary GOES-R Satellite Launches Soon
It's
true that the European (ECMWF) model often performs better than NOAA's
weather simulations, but there's no question America is blessed with the
best weather service in the world today.
122 forecast offices, 13
river forecast centers, 160 high-resolution Doppler radars providing
nearly continuous coverage from coast to coast - and 5,000 employees
keeping us safe.
On
November 16
GOES-R launches, the first of 4 state-of-the-art weather satellites
positioned 22,300 miles above the equator. Imagery can be captured every
30 seconds, an onboard lightning tracker will help meteorologists
pinpoint life-threatening weather.
To predict weather we need an
accurate global snapshot of what's happening right now. 95 percent of
all data that goes into weather models comes from satellites. GOES-R
(soon to be GOES-16) should be a big step forward.
Our November
weather honeymoon continues with a shot at 60F over the weekend. Models
hint at a soaking rain a week from today, maybe ending as the first
flurries of fall.
Amazing but true: MSP still hasn't seen it's first official frost.
Photo credit above: Lockheed Martin. More details on GOES-R from
The San Francisco Chronicle.
GOES-R Mission. Here's a good explainer of what the next generation of U.S. weather satellites will be able to achieve, courtesy of
NOAA NESDIS: "
The
Geostationary Operational Environmental Satellite-R Series (GOES-R) is
NOAA’s next generation of geostationary weather satellites. The first
satellite in the series, GOES-R, is scheduled for launch on November 16,
2016 at approximately 4:42pm Eastern. Once the satellite reaches
geostationary orbit, it will be known as GOES-16. There will be four
satellites in the series: GOES-R, GOES-S, GOES-T and GOES-U. GOES-R will
provide continuous imagery and atmospheric measurements of Earth’s
Western Hemisphere, total lightning data, and space weather monitoring
to provide critical atmospheric, hydrologic, oceanic, climatic, solar
and space data..."
First (official) Frost Saturday Morning?
Many suburbs have already seen the first frost of fall, but not MSP
International, the close-in suburbs and downtowns, where the urban heat
island has prolonged the frost-free season. Models show a wide spread
for temperatures Saturday morning (meaning lower confidence) but it's
possible the mercury will drop to 32F early Saturday at MSP
International Airport.
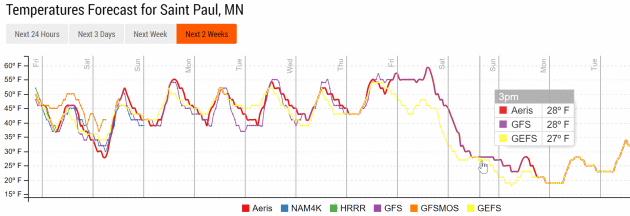
Honeymoon Lingers One More Week.
ECMWF (European) data shows highs mostly in the 50s into late next
week, followed by a potentially major shift in the pattern. Graphic:
WeatherBell.
Pattern Flip In 7-8 Days?
GFS guidance shows the other shoe dropping a week from Saturday, with
nearly 40-45F temperature tumble behind a major storm late next week.
Yes, we are long overdue for a real cold front. Temperature trends:
Aeris Enterprise.
Colder, But Not Nanook.
The forecast for Thanksgiving Day at 500mb continues to suggest a
west-to-east zonal flow, hinting at average or slightly colder than
average temperatures for the northern tier of the USA, with toasty
warmth for much of the southern USA. No prolonged bitter invasions are
brewing just yet.
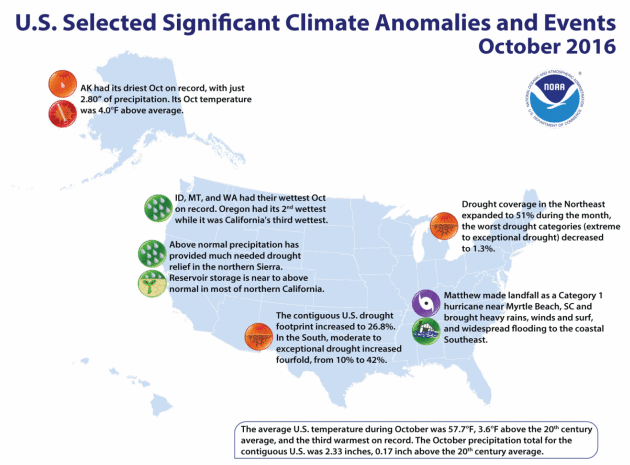
3rd Warmest October for U.S. - On Track For Second Warmest Year To Date. Here are a few highlights from October, courtesy of
NOAA: "...
Other notable climate events in October:
- Drought:
The total area of drought increased from 19.4 percent to 26.8 percent
of the Lower 48, mainly from expansion in the South and Southeast.
- Hurricane Matthew,
a Category 1 hurricane with winds of 75 mph, made landfall in South
Carolina on October 8, causing widespread flooding in the region.
- New Mexico experienced record warmth in October, with an average temperature increase of 5.8 degrees.
- Alaska had its driest October on record.
- Pacific Northwest: Idaho, Montana and Washington each had their wettest October on record, while Oregon experienced its second wettest..."
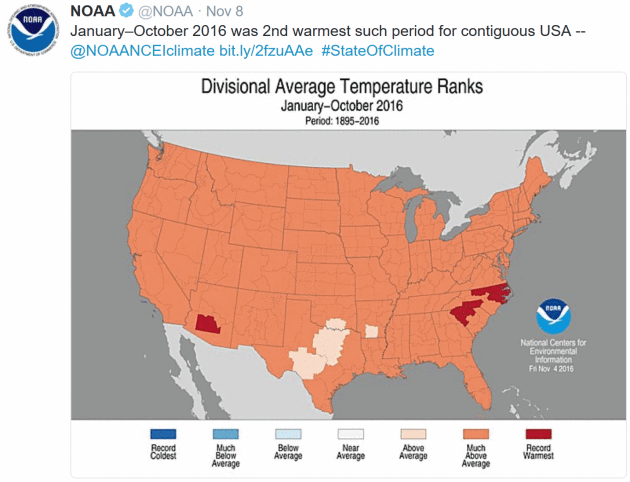
Toasty October Keeps U.S. On Track for 2nd-Hottest Year.
Climate Central reports: "
The
U.S. is still cruising toward its second-hottest year on record going
back more than 120 years, with every state in the Lower 48, as well as
Alaska, recording well above-average temperatures through October. This
October was the third warmest on record, and 37 states had one of their
five warmest January-October periods in the books, the National Oceanic
and Atmospheric Administration announced on Tuesday.
Those elevated temperatures have exacerbated the drought that has taken
hold in several areas, particularly in the Southeast. The near-record
U.S. heat comes amid a year that will easily be the hottest on record
for the planet as a whole, surpassing 2015. The excess heat trapped by
ever-rising levels of greenhouse gases in the atmosphere is tipping the
scales in favor of more record heat..."
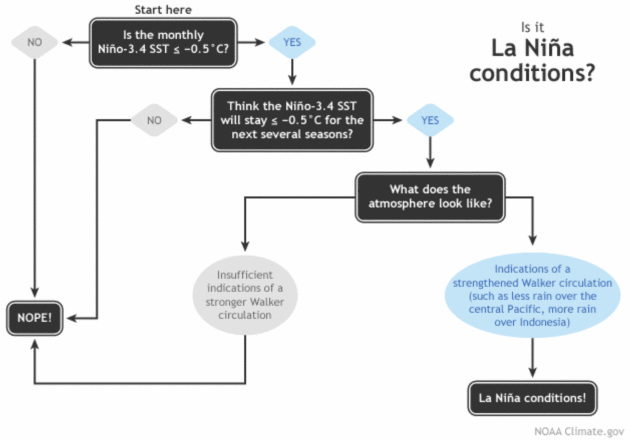
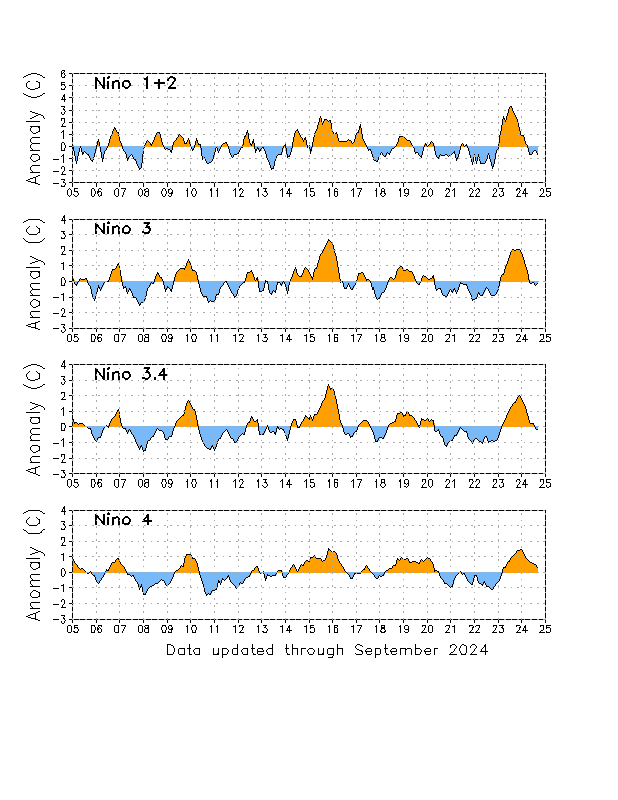
November 2016 La Nina Update: Hello, Lady! Yes, it's official - a (mild) La Nina cooling of equatorial Pacific Ocean water. Here's an excerpt of a post at
NOAA's Climate.gov that explains the conditions that need to be present before it can be (officially) called La Nina: "...
Is the sea surface temperature in the Niño3.4 region more than half a degree cooler than average? Yes!
(It was about -0.7°C below average during October.) Do forecasters
think it will stay cooler than that threshold for several overlapping
three-month periods? Yes!
(But just barely.) Finally, are there signs that the atmospheric
circulation above the tropical Pacific is stronger than average? Yes!
This all means that La Niña has officially arrived..."
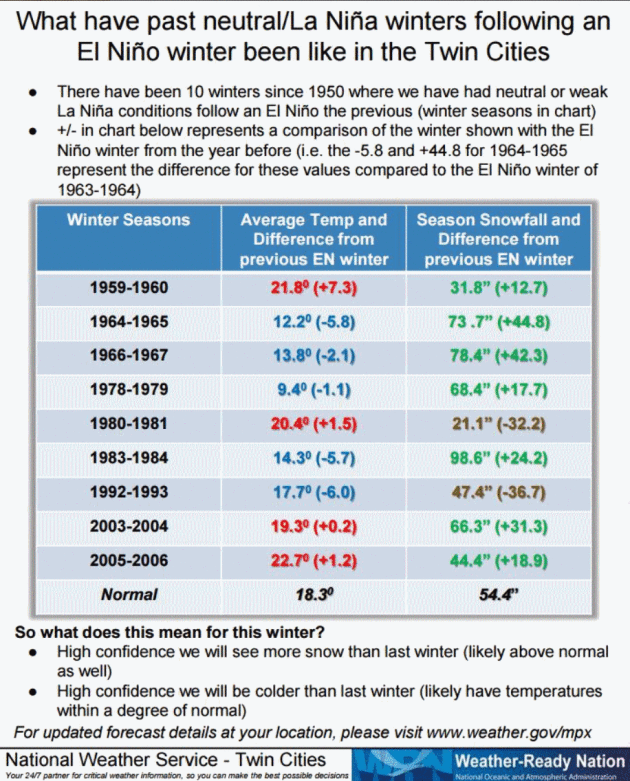
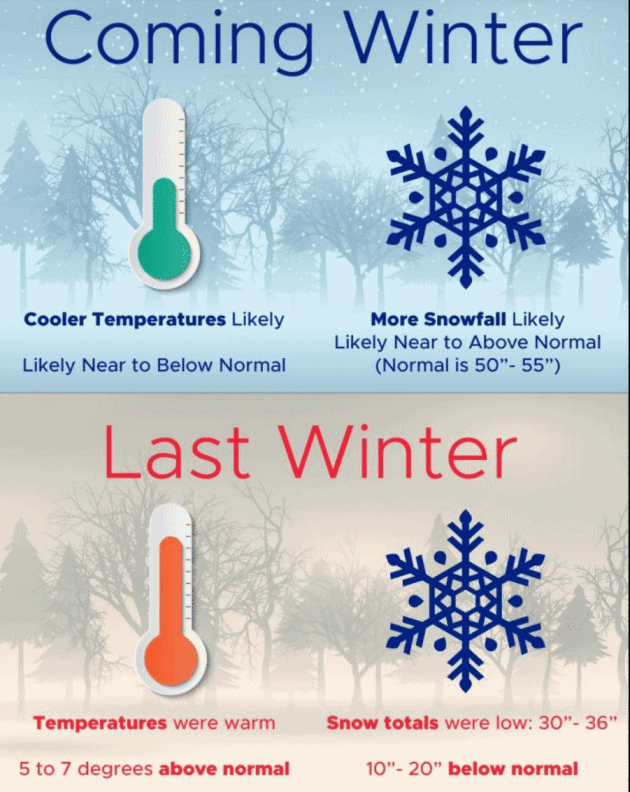
Mild La Nina? Odds Favor Colder and Snowier for Minnesota.
I know, I'll believe it when I see it too. I'm still a bit skeptical
but maybe snow-lovers will be pleasantly surprised this winter.
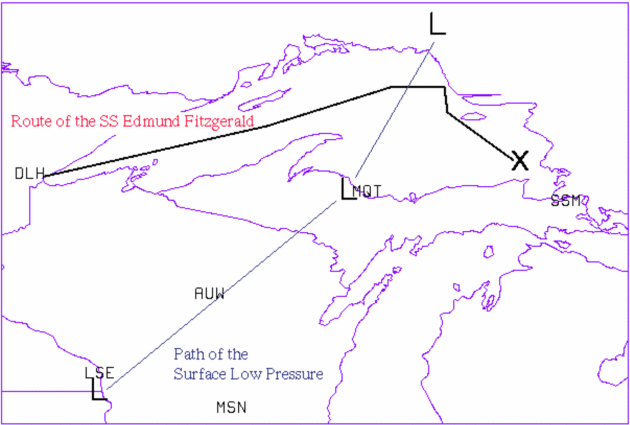
Meteorology Behind the Sinking of the SS Edmund Fitzgerald. The University of Wisconsin
(CIMSS) folks put together a good explainer recapping the weather that
brought down the ship on November 10, 1975; here's an excerpt: "...
What
caused the ship to sink? There are a couple of theories cited in the
"Marine Casualty Report" by the US. Coast Guard Marine Board of
Investigation Report. Since there were no survivors nor witnesses, their
report is based on testimonies and an underwater survey of the wreck.
This report suggests that the Fitzgerald was taking on water due to
earlier damage from the storm and that around 7:15 p.m. it plunged
headfirst into a large wave and sank abruptly. When a ship is filled
with cargo, there is a level at which the ship rests in the water. This
level is referred to as the load line. The height load line is set as a
function of season and determines the weight of the cargo the ship can
transport. Between the time of her launch and its sinking, the SS Edmund
Fitzgerald load line was raised 3 feet 3 1/4 inches, making her sit
lower in the water. This increased the frequency and quantity of water
that could flood the deck during a rough storm..."
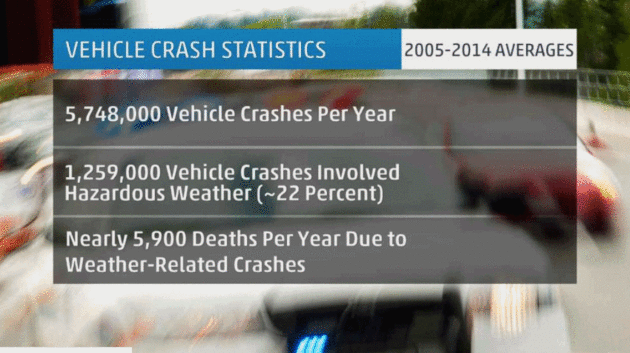
Weather-Related Car Accidents Far More Deadly Than Tornadoes, Hurricanes, Floods. Perspective is important, according to a story at
The Weather Channel: "...
The U.S. Department of Transportation (DOT) says that more than 5,748,000 vehicle crashes occur each year based on statistics from the 10 years spanning 2005-2014.
About 22 percent of those, or close to 1,259,000, involved hazardous
weather. Those U.S. weather-related automobile crashes have killed an
average of nearly 5,900 people annually, accounting for about 16 percent
of all vehicular deaths, the DOT says.
Another 445,000+ were injured each year during that same period of
time. For comparison, the 10-year average combined number of deaths each
year from flooding, lightning, tornadoes, hurricanes, and heat is 375..."
Image credit: "
Annual average vehicle crash statistics." Data from U.S. DOT.
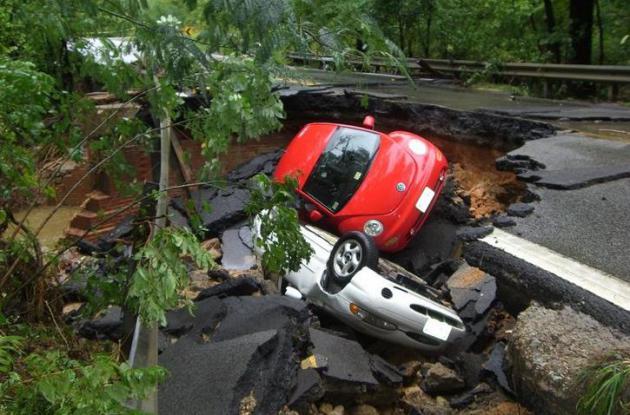
How To Survive Being Caught Up In a Flash Flood.
Most flash flood deaths occur in vehicles, at night, when estimating
water depth is nearly impossible. Here are a few suggestions of what to
do in the unlikely event you ever find your car or truck being
transformed into a boat, courtesy of Times LIVE: "...If
your car is swept into the water and submerged‚ DON'T PANIC! Stay calm
and wait for the vehicle to fill with water. Once the vehicle is full‚
the doors will be able to open. Hold your breath and swim to the
surface. If you are swept into fast moving floodwater outside of your
car‚ point your feet downstream. Always go over obstacles‚ never try to
go under..." (Image credit: Virginia Department of Transportation).
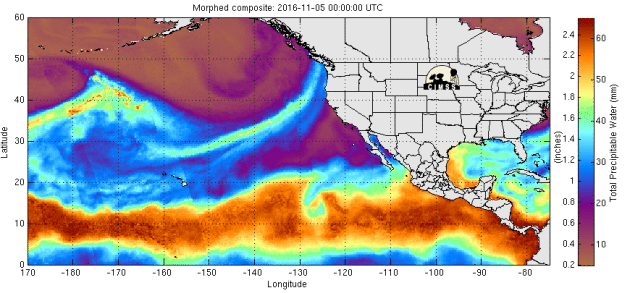
"Atmospheric Rivers" Soak Pacific Northwest and Western Canada.
Discover Magazine
has a good explanation of the meteorology powering persistent streams
of deep moisture impacting the northwestern USA; here's a clip: "
During
this past weekend and into Monday of this week, parts of British
Columbia were hosed with copious, flood-inducing precipitation, thanks
to at least two so-called ‘atmospheric rivers’ originating far to the
south and west. You can see them in the animation above, which shows the
amount of precipitable water in the atmosphere. Watch for long, thin
plumes depicted in green, yellow and orange, stretching from near Hawaii
and hitting the Pacific Northwest. Atmospheric rivers contain an almost
unimaginable amount of moisture. A strong one can move water vapor
“roughly equivalent to 7.5–15 times the average flow of liquid water at
the mouth of the Mississippi River, according to NOAA’s Earth System Research Laboratory..."
Animation credit: "
The
amount of precipitable water in the atmosphere over the northern
Pacific is seen in this animation created using data from microwave
observations by polar orbiting satellites. The animation covers the
period between Nov. 5th and 7th, 2016." (Source: Cooperative Institute for Meteorological Satellite Studies.)
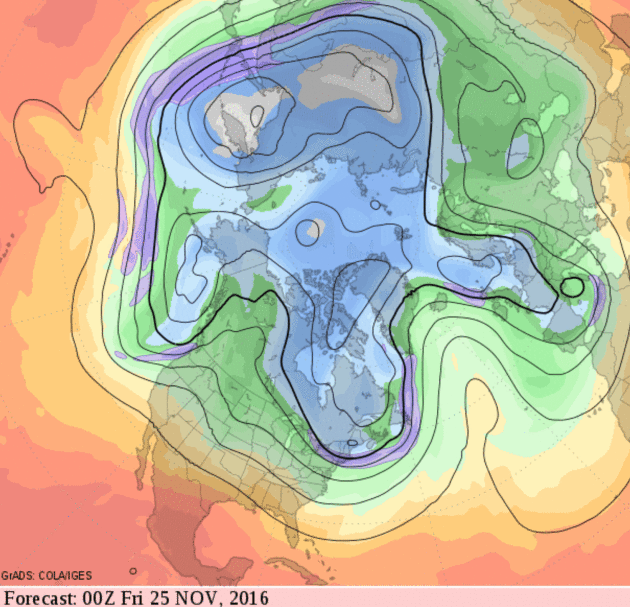
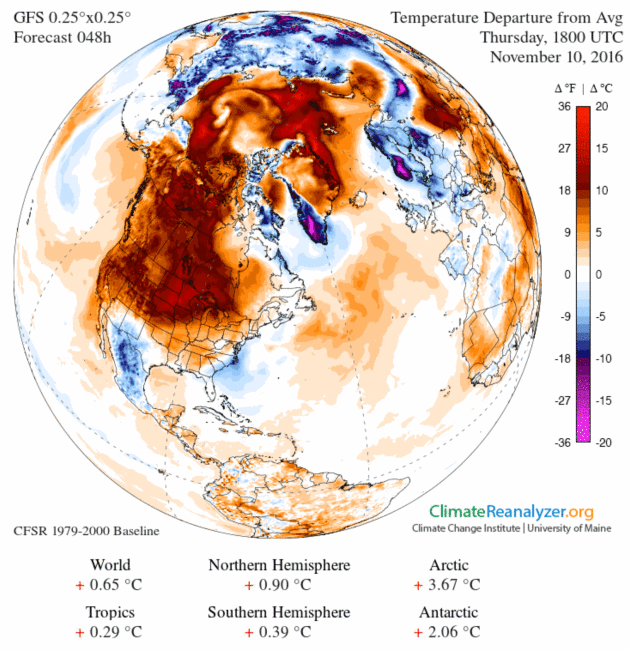
Where's The Cold Air?
This has to change in the coming weeks as long nights spark an eventual
cool-down, but I'm struck by how pervasive the warmth is across North
America - a huge area with temperature anomalies well above average. The
Arctic region is averaging 5-6F warmer than normal for this date.
Graphic:
Climate Reanalyzer.
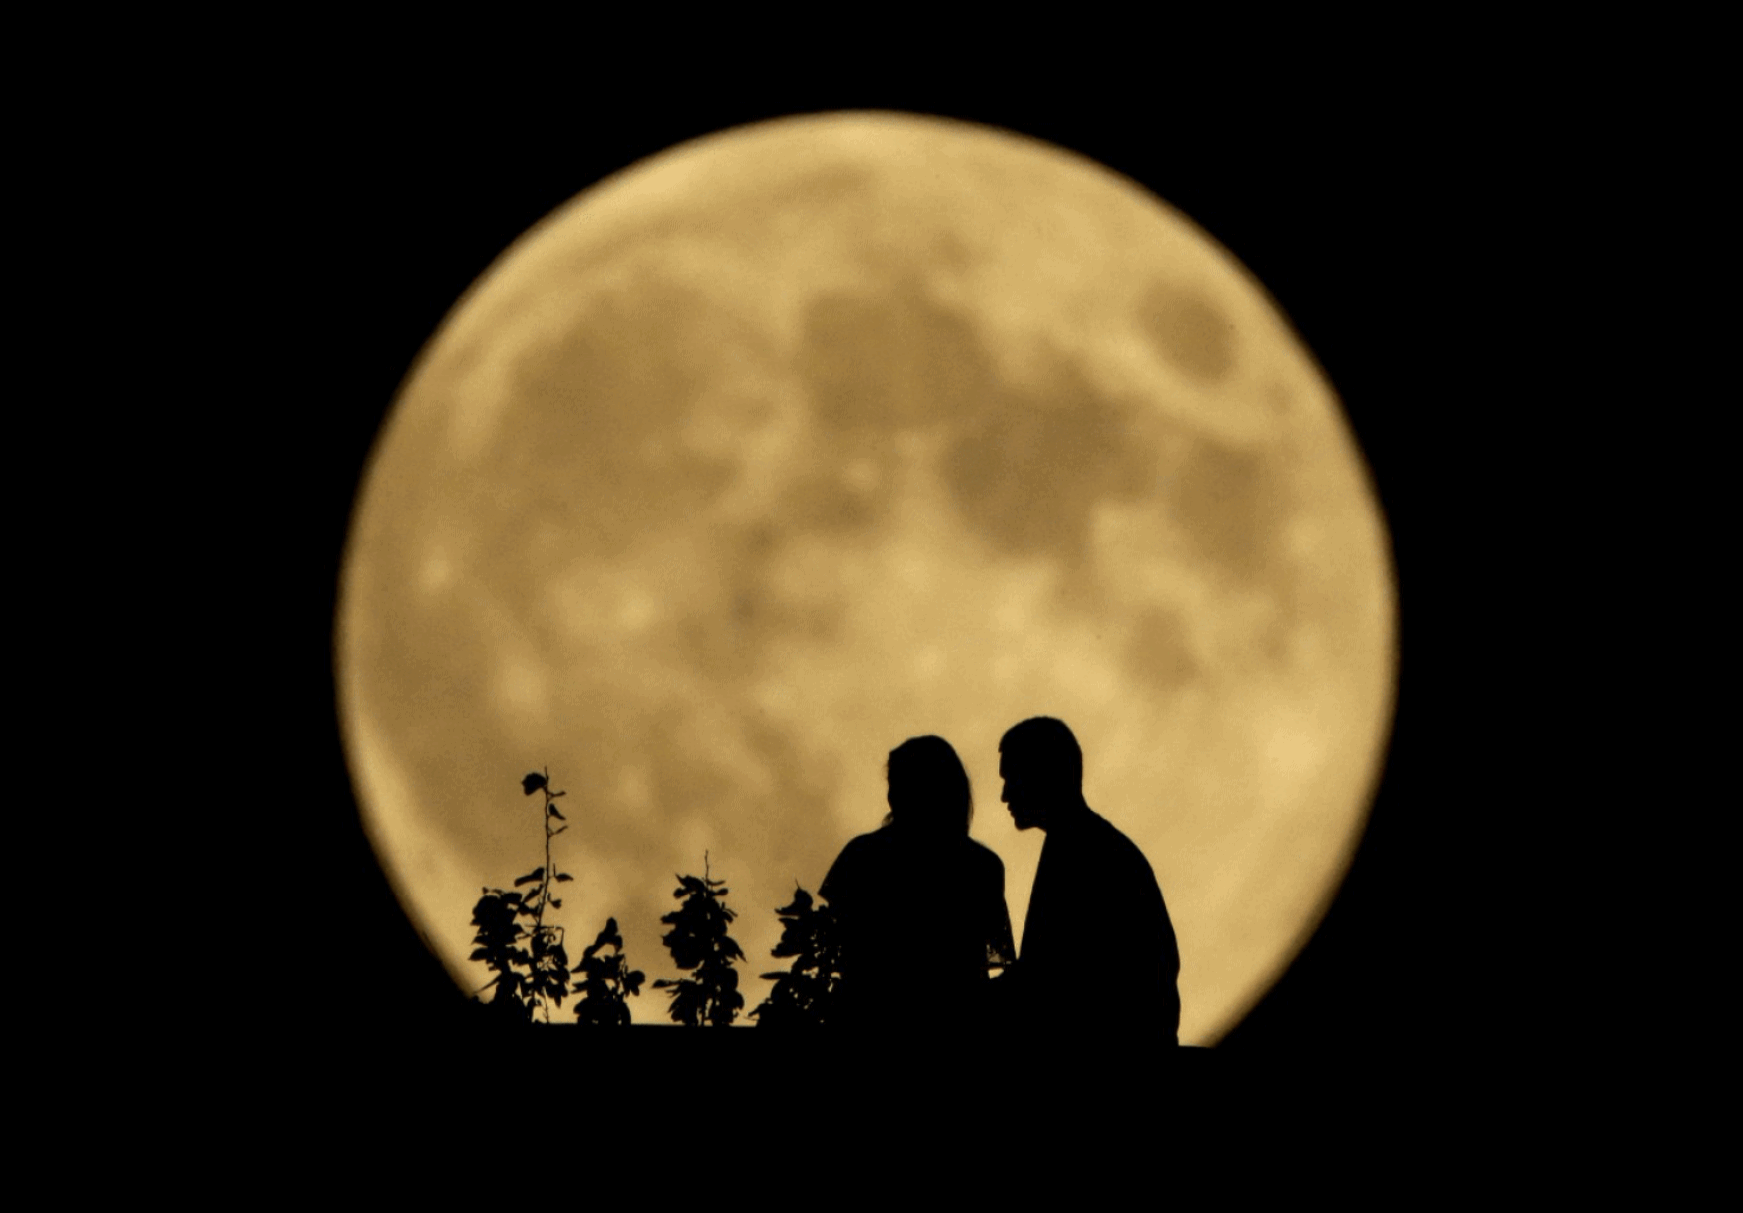
November's Supermoon Will Be Bigger Than It Has Been Since 1948.
The Washington Post has more details on the upcoming "spotlight moon"; here's the intro: "
November’s
full moon is special. Not only is it a supermoon — which appears larger
than a “regular” full moon — it will be the closest such moon to Earth
since January 1948. We won’t see the full moon this close again until
Nov. 25, 2034, according to NASA.
In the middle of November, we savor the splendor of a full moon. With
any luck, this awe-inspiring moon will lure people outside to breathe
the crisp air of the autumnal night sky, spark people to hold hands and
spur interest in relishing the heavens..."
Photo credit: "
The moon will be larger in the sky than it has been in decades — but not quite this big." (Charlie Riedel/AP).
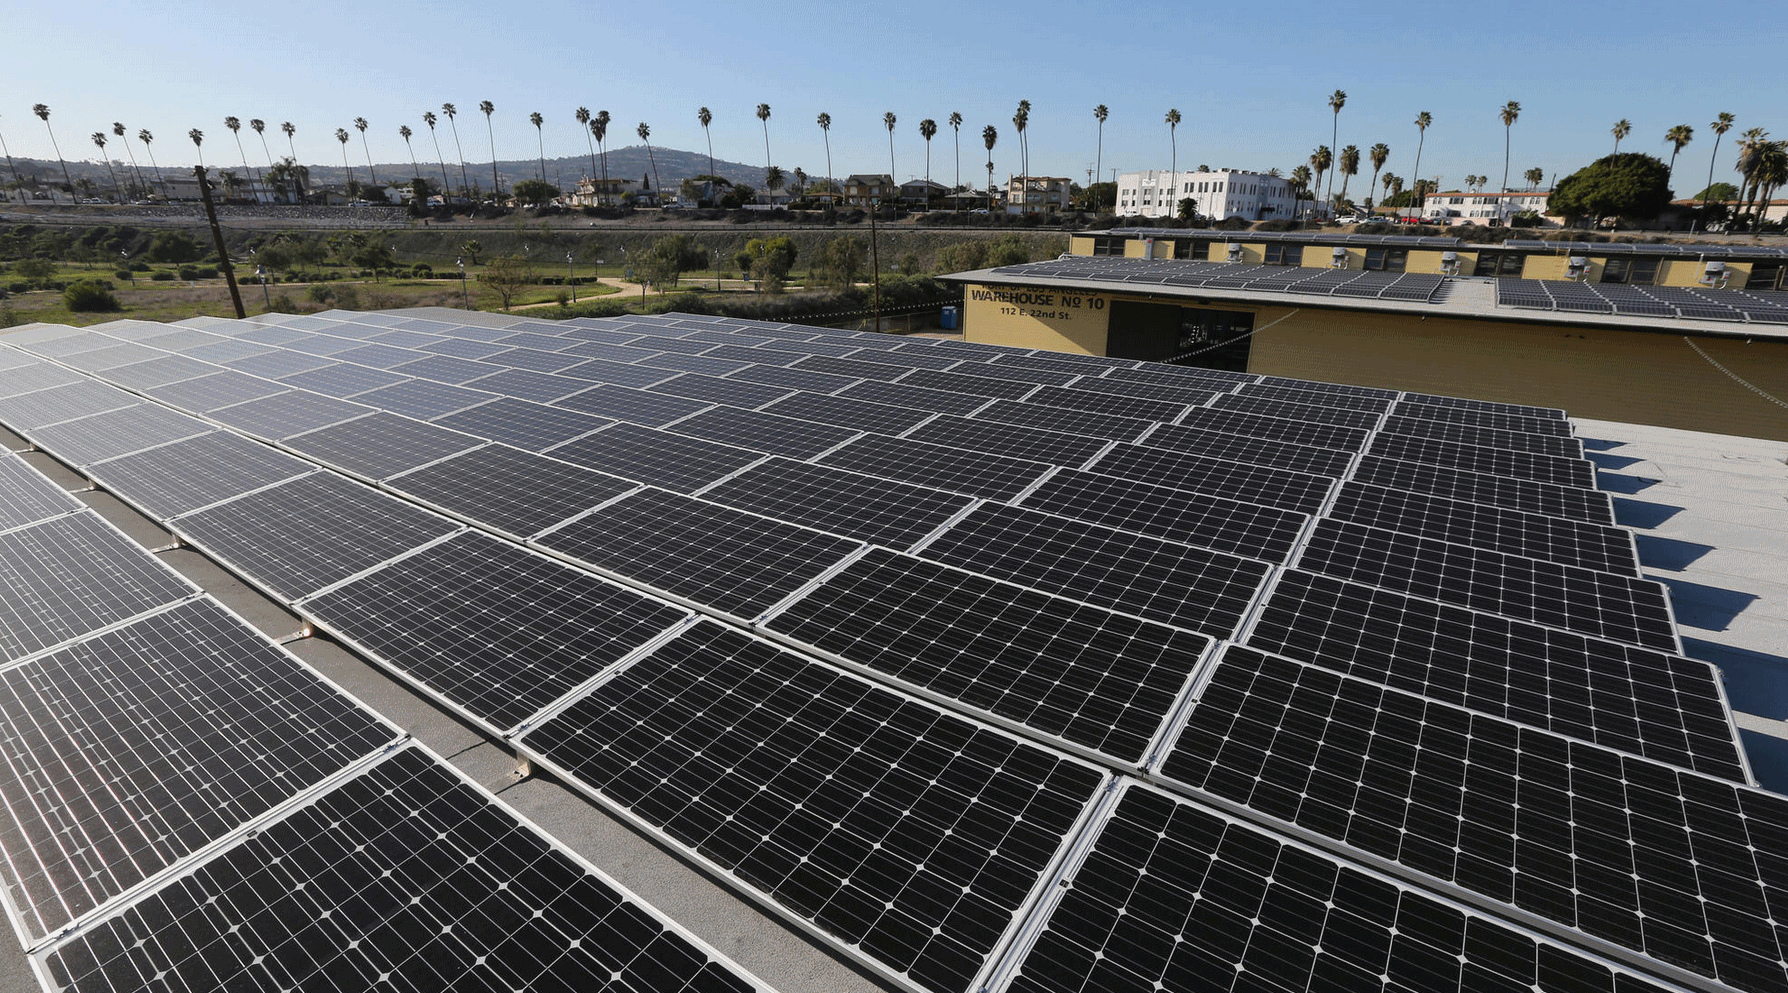 Solar Power Proponents Hopeful Trump Sees Benefit of Growing Industry.
 Here's an excerpt from the
Los Angeles Times: "...
As
part of his larger economic agenda, Trump has proposed lifting
environmental regulations, tapping coal and nuclear power, and opening
federal lands to oil and natural gas production. But despite his
campaign rhetoric, experts and industry players say, Trump’s energy
policies as president will bump into market realities. The challenge
Trump faces is that increasingly the economics in the energy sector
favor renewable technologies such as solar and wind, which are reducing
costs quickly. Increased fracking has produced natural gas at prices
that are cheaper than coal. And a worldwide oil glut has reduced
petroleum profits to the point where reducing regulation and opening
federal lands to drilling is unlikely to bring a drilling boom..."
Photo credit: "
A
large-scale solar panel project sits atop warehouses No. 9 and 10 at
the Port of Los Angeles in San Pedro, which have been converted into
retail space for shops and a microbrewery." (Luis Sinco / Los Angeles Times)
 Sunny Disposition: Falling Prices Fuel Solar Boom.
With costs dropping rapidly why wouldn't you want to take advantage of
the free energy falling on your yard? Here's an excerpt from
Milwaukee's Journal-Sentinel:
- A
new forecast by the U.S. Energy Department says the amount of solar
energy produced nationwide is poised to triple between 2014 and 2019.
- Nationally, solar installations jumped 45% in the first half of this year compared with the same period in 2015.
- Cutting-edge
technology could give solar power an even bigger "wow" factor. Elon
Musk, known for developing electric-powered Tesla cars and pushing for
commercial space travel, sees the potential for solar-powered roof
tiles, such as those made by his company SolarCity, that resemble
conventional shingles.
"I really think it's going
to get to the point where if you get a normal roof it's sort of odd,"
Musk, founder/CEO of Tesla, said during an interview last week on CNBC..."
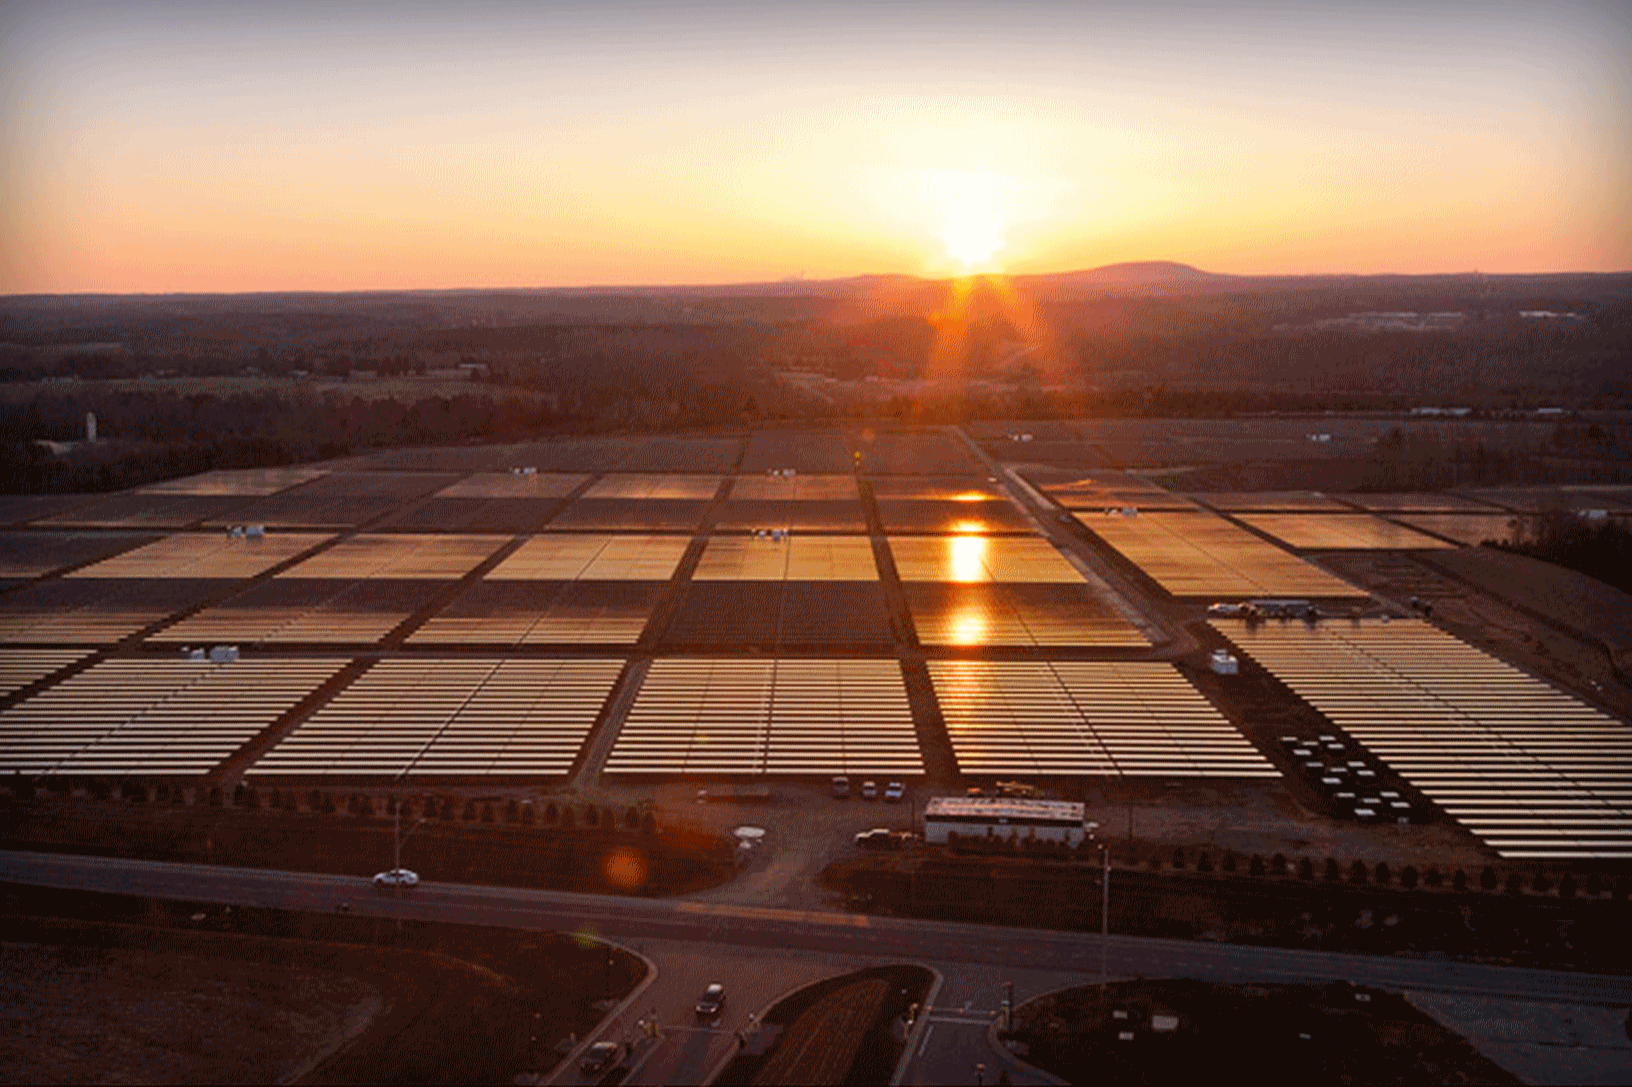
Photo credit: Apple.
Learning In The Age of Digital Distraction. We've never been more distracted, trying to convince ourselves that we can do 5 things, simultaneously, and do them well. NPR reports: "...
Maybe
the smart phone's hegemony makes perfect evolutionary sense: Humans are
tapping a deep urge to seek out information. Our ancient food-foraging
survival instinct has evolved into an info-foraging obsession; one that
prompts many of us today to constantly check our phones and multitask.
Monkey see. Click. Swipe. Reward. A new book The Distracted Mind:
Ancient Brains in a High Tech World explores the implications of, and
brain science behind, this evolution (some might say devolution)..."
Image credit:
LA Johnson/NPR.
TODAY: Sunny, chilly breeze. Winds: NE 5-10. High: 49
FRIDAY NIGHT: Clear and cold. Low: 33
SATURDAY: Early frost? Sunny, breezy, milder PM. Winds: S 10-15. High: 58
SUNDAY: Plenty of sun, weather honeymoon continues. Winds: W 10-15. Wake-up: 43. High: near 60
MONDAY: Blue sky, a bit cooler. Winds: N 8-13. Wake-up: 44. High: 54
TUESDAY: Clouds, showers likely. Winds: NW 10-20. Wake-up: 41. High: 55
WEDNESDAY: Sunny, still quiet for mid-November. Winds: SE 5-10. Wake-up: 39. High: 53
THURSDAY: Clouds and wind increase, still mild. Winds: SE 15-25. Wake-up: 44. High: near 60
Climate Stories
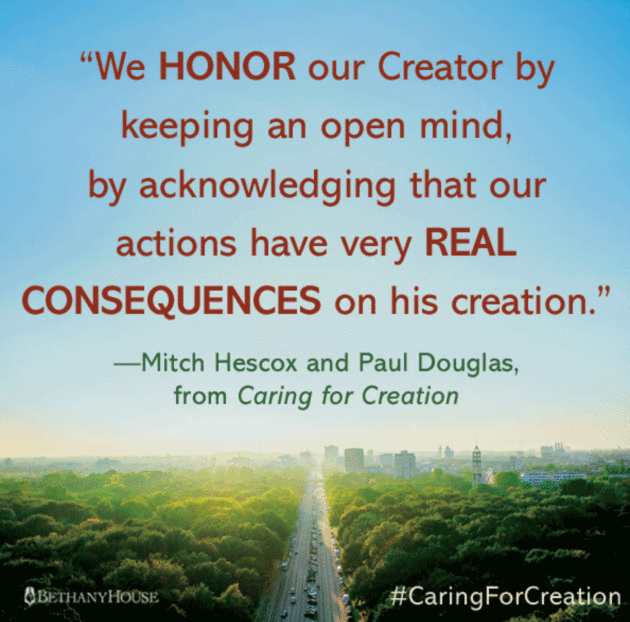
Caring for Creation: Community Conversation and Book Release November 15 at Minnehaha Academy.
If you're interested in this topic (and most everyone should be) I hope
you'll consider coming out next Tuesday evening, November 15, to
Minnehaha Academy to hear co-author of "
Caring for Creation"
Mitch Hescox and me discuss why climate awareness and a push toward
clean energy are essential, and why people of faith should pay
attention: "
Minnehaha Academy Welcomes Meteorologist Paul Douglas
and Evangelical Environmental Network Director Mitch Hescox for a
Compelling Climate Change Conversation and Book Release Event. Join us
for this not-to-be-missed community conversation and book release event
about climate change and the Biblical call for Christians to care about
the earth.
In this free evening conversation, you’ll learn:
- Why Christians should lead the charge for caring for God’s creation.
- How climate change goes beyond politics and affects the health, economy, and stability of future generations.
- Tips to help your family and those around you care for the earth..."
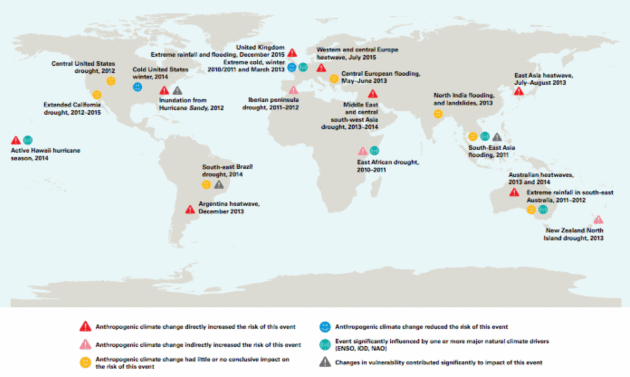
Growing Link Between Global Warming & Extreme Weather, Finds World Meteorological Organization. A warmer, wetter atmosphere is turning up the volume on extreme weather, especially record heat and flooding rains.
Clean Technica connects the dots related to attribution: "...
The new report, The Global Climate 2011-2015, investigated
the warmest five-year period on record, 2011 to 2015, which was also
the warmest on record for every single continent except Africa. These
record temperatures were accompanied by rising sea levels, as well as
major declines in Arctic sea-ice extent, continental glaciers, and
northern hemisphere snow cover. As the World Meteorological Organization
(WMO) notes, “All these climate change indicators confirmed the
long-term warming trend caused by greenhouse gases.” The WMO also points
to the awkwardly historic milestone, which we reported back in June, that carbon dioxide levels surpassed 400 parts per million for the first time in 4 million years..."
Map credit: "
Results of studies on attribution of extreme events to anthropogenic climate change." (Sources: Bulletin of the American Meteorological Society and various other publications)
How To Tell When The Arctic Ocean Will Be Ice Free. Here's a clip from a story at
Pacific Standard: "...
The
estimates also suggests, based on current sea-ice coverage, that it
will take another trillion metric tons of carbon dioxide emissions
before Arctic summer sea ice more or less vanishes. Given global
greenhouse gas emissions of around 35 trillion metric tons per year,
that suggests there won’t be any Arctic sea ice in September by
mid-century."
Global "Greening" Has Slowed Rise of CO2 in the Atmosphere, Study Finds. Here's an excerpt from a story at
The Guardian: "
A
global “greening” of the planet has significantly slowed the rise of
carbon dioxide in the atmosphere since the start of the century,
according to new research. More plants have been growing due to higher
CO2 levels in the air and warming temperatures that cut the CO2 emitted
by plants via respiration. The effects led the proportion of annual
carbon emissions remaining in the air to fall from about 50% to 40% in
the last decade. However, this greening is only offsetting a small
amount of the billions of tonnes of CO2 emitted from fossil fuel burning
and other human activities and will not halt dangerous global warming..."
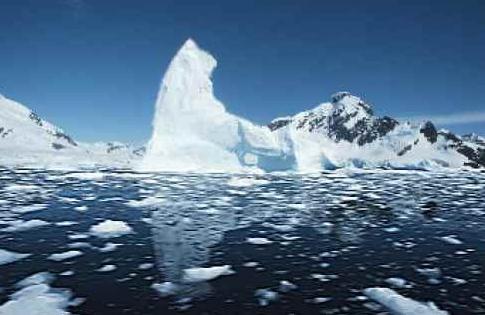
 The Arctic: A Bellwether of Climate Change. Maryland's Point News
 has a story that made me do a double-take; here's a clip: "...
The
Arctic is a bellwether of climate change,” explained Dr. Walsh. He said
that scientists can use observations from the Arctic to identify trends
and indicate the future of climate change for the rest of the world.
“What happens in the Arctic does not stay in the Arctic,” a playful
phrase that Dr. Walsh coined to describe the importance of studying this
region, was substantiated by data correlating temperature changes in
the Arctic to rising sea levels, feedback to greenhouse warming, and
extreme weather around the midlatitude regions on the globe. However,
Dr. Walsh explained, the cause for concern is not based solely on the
global impact, but on the impact local to the Arctic as well. According
to Walsh, 50% of all ice in the Arctic has melted in the past thirty
years due to rising temperatures..."
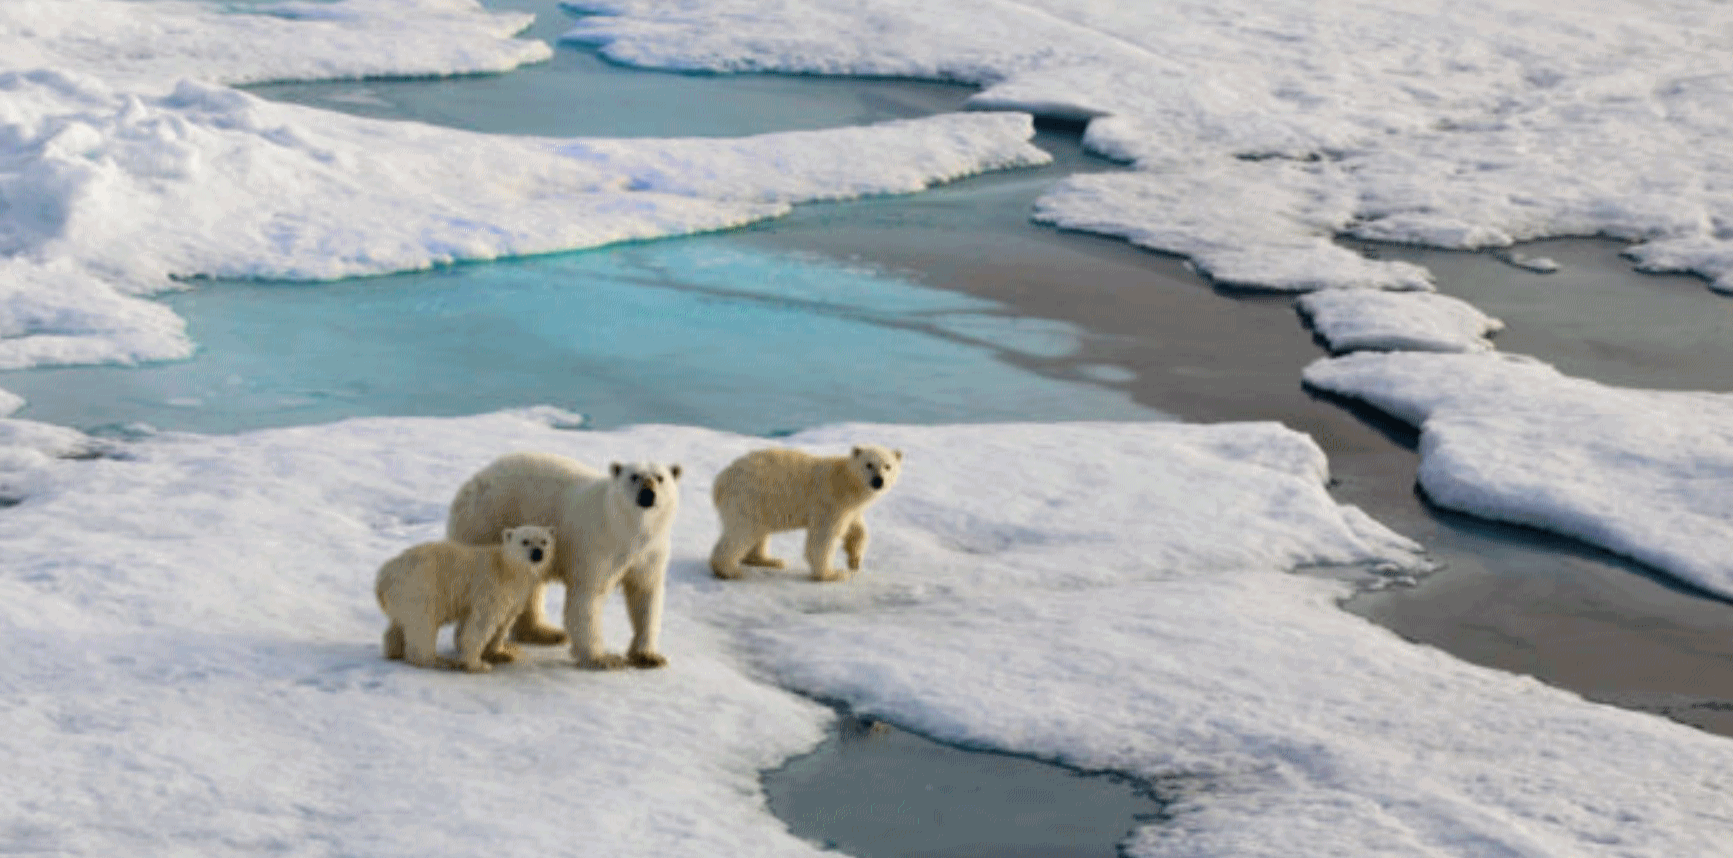
File photo: Huffington Post.


No comments:
Post a Comment