12 F. high yesterday in the Twin Cities.
27 F. average high on December 16.
41 F. high on December 16, 2015.
December 17, 1996:
20 to 40 mph winds combined with recent snowfall produce blizzard like
conditions for about a 36 hour period over much of the area. Whiteout
conditions are common in rural and open areas. Every county road in
Yellow Medicine county was impassable by the morning of the 18th.
Travelers heading west were stranded in Clara City as plows were pulled
off the road. Wind chills were as low as 60 degrees below zero.
December 17, 1946: Heavy snow is reported along with strong wind across northern Minnesota. Duluth has winds up to 62 mph.
Danger Zone - Coldest Night of the Winter Tonight?
We're about to get our Minnesota Mojo back, our weather-swagger, our national-weather-boasting-rights. By
Sunday morning at
7 am the air temperature in the MSP metro may slip to -20F; the coldest reading in nearly 3 years.
Sunday's
record is -24F, set in 1983. We'll come close. Factor in a 5-10 mph
breeze and it will feel like -30 to -40F. Serious, character-building
cold; possibly the coldest of the entire winter. Wind Chill Warnings are
posted for a chill factor of -35 to -45F by tonight. Exposed skin can
become frostbitten within 10 minutes or less. Take the chill seriously -
we don't get these levels of intense cold very often now.
Snow slowly tapers today as temperature slip below zero. The chill factor dips into the -20s this afternoon; by
tomorrow
morning you'll swear you've crash-landed on Pluto. But if you dress in
multiple layers with no exposed skin (always a good idea at my age)
you'll be fine, especially if you're moving.
"No such thing as bad weather, just inappropriate clothing choices." Right.
Weather
quiets down next week with a few flurries from a parade of wimpy
clippers - no big storms before Christmas. Highs surge into the 20s and
30s. You'll be amazed how good THAT feels. ECMWF models hint at an icy
mix the Sunday after Christmas.
For now get ready for remarkably excellent snuggling-weather conditions.
Here It Comes.
A taste of the Arctic, a Siberian Swipe, compliments of Comrade Putin.
Temperatures fall through single digits into negative territory by
afternoon, bottoming out somewhere around -20F Sunday morning. That's
the air temperature, not the wind chill. Beat your chest and let out a
primal scream. NAM guidance: Tropicaltidbits.com
 10-Day Snowfall Potential
.
The animation above shows a time lapse of predicted snowfall totals,
courtesy of NOAA's global GFS model. The best chance of a (very) white
Christmas comes from the Upper Midwest into the Great Lakes and New
England. Much of the west will be bright white come Christmas morning; a
few feet of additional snow from the Rockies westward to the Sierra and
Cascades.
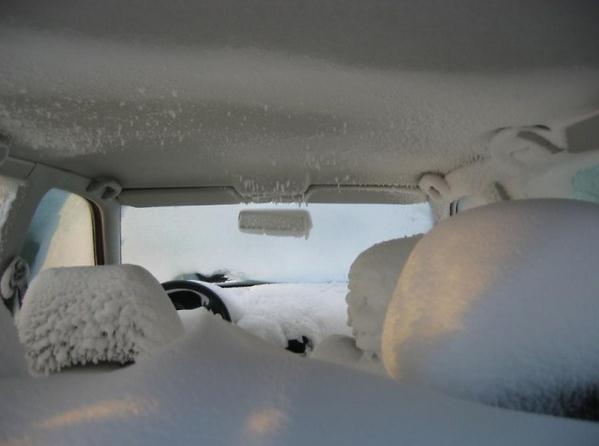
 First White Christmas in 3 Years for the Twin Cities
.
Hard to believe (staring out the window now) but there was only a trace
of snow on the ground last year, and 2014. The last white Christmas
(defined as an inch of snow or more at MSP International on December 25)
was back in 2013, when we woke up to 9". There should be more than that
this year. Santa is pleased.
Weather Perspective. Here's an excerpt from this week's installment of
Minnesota WeatherTalk, courtesy of Mark Seeley: "...
In
addition to the added snow cover, the trend for below normal
temperatures has continued this week, now 9 consecutive days across most
of the state. This is the longest spell of cooler than normal
temperatures since mid-February of 2015. Some northern Minnesota climate
stations fell to -20°F or colder this week, including Georgetown (Clay
County), Orr (St Louis County), and Camp Norris (Lake of the Woods
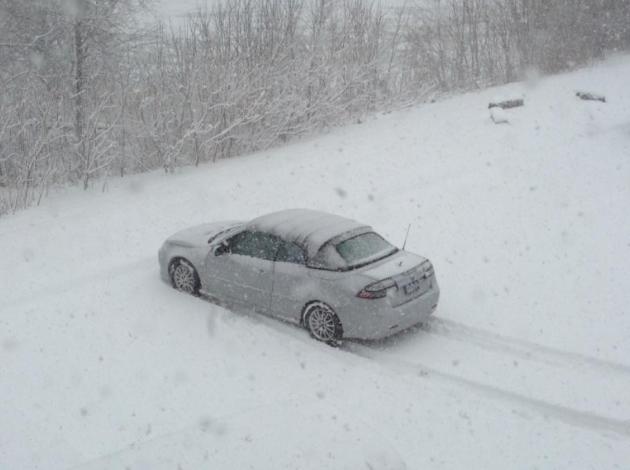
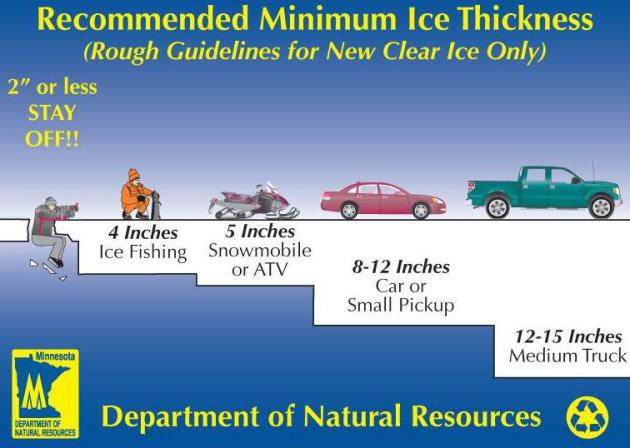
County). Snow cover around the state ranges from as little as 2 inches
to over 12 inches in many northern counties. Despite the snow cover,
frost depths in the soil have progressed over the past week and now
range from 6 to 12 inches in most areas. Ice cover on area lakes is
increasing as well with reports ranging mostly from 2 to 4 inches, but
caution is still advised not to venture out on the ice yet..."
Aeris Weather Briefings:
Issued Friday morning,
December 16, 2016:
* Long-duration snow event from the Northern Plains and Upper Midwest into New England today into
Sunday; band of 5-10" likely with locally higher amounts.
* Ice potential greatest across southern Ohio and western Pennsylvania.
* Sporadic flooding and mudslides reported across California with latest frontal passage.
* Urban and small stream flood advisory posted for eastern Los Angeles County.
* Dangerously cold air temperatures and wind chills forecast for the Upper Midwest
Saturday night into
Sunday; coldest air
in 3 years.
Advisories and Warnings.
The areas of greatest concern for potential travel disruptions are in
bright pink - watches have been upgraded to warnings, meaning
treacherous conditions are imminent or already-occurring.
Advisories Posted for New England.
A potential for an icy mix in the Pittsburgh area has prompted the
issuance of warnings, otherwise advisories are posted for New England
and major urban centers from Boston to New York to D.C. for a few inches
of snow. For the northeast this will be more of a nuisance vs. a
paralyzing storm scenario. Map credit: AerisWeather AMP.
Total Snow Accumulation.
Heaviest snows fall from South Dakota and the southern half of
Minnesota into Wisconsin and Michigan, where 5-10" will be the rule with
some isolated 12"+ amounts, especially areas downwind ofthe Great
Lakes. The mountains of Colorado may pick up 2-3 feet of snow, but metro
Denver should be spared from the heaviest bands.
Ice Potential.
All-snow requires temperatures <32f a="" aloft="" an="" and="" atmosphere.="" class="aBn" columbus="" data-term="goog_1064088154" for="" from="" greatest="" ice="" icy="" in="" layer="" lowest="" mean="" mile="" mix="" of="" ohio="" pittsburgh="" potential="" rainn="" roughly="" snow="" span="" tabindex="0" the="" to="" valley="" warm="" will="" youngstown="">
tonight
and
Saturday. Map credit: NOAA.
Close to 10" for the Twin Cities. A few inches fell last night; another burst of heavier snow is likely from this afternoon into
tonight
with 5-10" from CSt. Cloud to Minneapolis - St. Paul and Eau Claire.
Up to a foot of snow may fall just south of the Twin Cities by
Saturday afternoon, when snow tapers to flurries.
Major Dumping for Southern Wisconsin. As much as 10" of snow is expected for Madison and Milwaukee; the worst travel conditions close to Lake Michigan
Friday night into
Saturday morning.
Close Call for Chicago.
Although the heaviest snow bands are forecast to track just north of
Chicago, expect some travel disruptions (land and air) with the heaviest
5-6" amounts likely over the northern suburbs. This should be a
plowable snow event for metro Chicago.
Potentially Plowable for New England.
Although advisories are issued, models suggest some 3-6" snowfall
amounts for much of New England, including Boston and Hartford, with
lesser amounts closer to the coast. Expect travel delays, but this
should not be a crippling storm for New England.
Nuisance to Plowable for Metro New York City.
New York will be on the edge of significant accumulation, a couple
inches of slush for Manhattan, but close to 4-6" for far northern
suburbs in Westchester County, New York and the Greenwich/Westport area
of Connecticut. Map: NOAA.
After The Snow: Intense Cold. It won't last long, but by
Sunday
temperatures dip into the extreme danger zone from the Dakotas and the
Twin Cities to Milwaukee, Chicago and Des Moines. Air temperatures dip
well below zero with a chill factor as low as -40 across Minnesota and
the Dakotas - the coldest air since January, 2014.
Character-Building Cold. The map above shows predicted air temperatures around the breakfast hour
Sunday,
as cold as -30F across Minnesota and much of the Dakotas. Under these
conditions exposed skin can become frostbitten in less than 10 minutes.
Dangerously cold weather peaks
Sunday
with rapid warming set for next week - a glancing blow of Siberian air
focused on the Upper Midwest. (Map source: Tropicaltidbits.com)
Summary:
the storm is very much on-track; snow, ice, wind and bitter cold - a
premature taste of January. The worst of the snow and cold is coming on
the weekend, which may help to mitigate some impacts (no schools to
close across Minnesota and the Dakotas on a
Sunday due to severe cold), but I envision significant delays to land and air travel from this afternoon into
Sunday.
Meteorological winter, marking the coldest 90 days of the year, really
began back on December 1. Looking at the maps that's not too hard to
believe.
Paul Douglas, Senior Meteorologist, AerisWeather
Reason To Keep On Going.
Our Fairbanks Fling will be relatively brief. Just about the time you
can't take it anymore you won't have to. A more moderate, zonal flow blows
Pacific aiir back into town next week; ECMWF guidance continuing to show
a streak of 20s and 30s. Mark my words: you will be dazed and amazed
how good freezing feels after a spell of subzero. Graphic: WeatherBell.
Arctic Air Retreats North.
No t-shirt weather brewing anytime soon, but I'm happy to report that
the core of any subzero air will remain well north of the border through
New Year's Day, as the USA recovers from this latest outbreak. Looking
at latest long-range guidance I wouldn't be at all surprised if tomorrow
isn't the coldest day of the entire winter, even though (historically)
our coldest weather usually arrives in mid January.
 Large Regions of U.S. Damaged by Drought in 2016.
 Here's the intro to a story at
The Wall Street Journal: "
Droughts sparked
deadly wildfires, killed tens of millions of trees and damaged crops
and livestock in large regions of the U.S. in 2016. Major
regional droughts hit the U.S. this year in the Southeast,
California and New England—and all developed differently. But changes
in the earth’s climate mean regional droughts and other “extreme events
are going to be more common than in the past,” said Brian Fuchs,
climatologist at the Nation Drought Mitigation Center at the University
of Nebraska—Lincoln..."
Photo credit: "
Scorched cars and trailers burned by the Blue Cut fire in August line a residential street in Phelan, Calif."
Photo: Noah Berger/Associated Press.
Abnormally Warm Arctic Spurs Planet to Second-Warmest November on Record. Jason Samenow reports at
Capital Weather Gang: "
It’s
frigid outside over large parts of the United States, but the planet is
still warming, as evidenced by a near record-warm November for the
globe. Temperatures in parts of the Arctic averaged more than 20 degrees above normal,
as Earth recorded its second warmest November since 1880 (when records
began). NASA data show the planet’s temperature was 1.7 degrees above
the 1951-1980 November average, and just slightly cooler than November
2015 — the record-setter (at 1.8 degrees above average). While some
media commentators misleadingly claimed the Earth’s land temperature
recently experienced its greatest drop ever recorded, NASA data show
whatever drop there was (because of the transition from El Niño to La
Niña) has begun to reverse..." (Image credit: NASA).
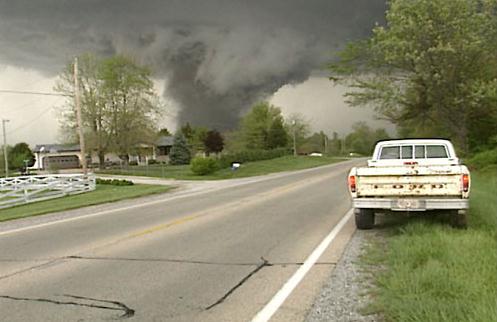
Experts Explain Why the U.S. Saw a Low Tornado Count in 2016. Here's an excerpt of a good explainer at
AccuWeather: "...
The
lower counts were mostly over the main tornado-prone regions of the
U.S., including the Plains and South. These areas experienced
drier-than-normal weather during the warm season. Because tornadoes
require a particular mix of ingredients in order to form, the number of
tornadoes is highly dependent on the prevailing weather patterns. "The
lack of deep moisture prevented the development of strong and
widespread thunderstorms during much of the spring and certainly during
the summer and fall seasons," Kottlowski said. The lack of sustained and
widespread thunderstorms reduces the chances for tornado development..."
 Report Offers Roadmap for Overhaul of U.S. Electrical Grid
.
Midwest Energy News has the story: "
A
new report by a team of engineers, scientists and researchers at the
Massachusetts Institute of Technology offers a roadmap for the redesign
of one of history’s most critical inventions. The power grid – named the
greatest engineering feat of the 20th century by the National Academy of Engineering – is in need of an upgrade, according to “Utility of the Future,”
released Thursday. Designed for last century’s rigid, analog and
centralized world, the grid must now be recalibrated for today’s
flexible, digital and decentralized landscape..." (Map source: FEMA, Wikipedia).
Advanced Black Lung Cases Surge in Appalachia.
NPR reports: "
Across
Appalachia, coal miners are suffering from the most serious form of the
deadly mining disease black lung in numbers more than 10 times what
federal regulators report, an NPR investigation has found. The
government, through the National Institute for Occupational Safety and
Health, reported 99 cases of "complicated" black lung, or progressive
massive fibrosis, throughout the country the last five years. But NPR
obtained data from 11 black lung clinics in Virginia, West Virginia,
Pennsylvania and Ohio, which reported a total of 962 cases so far this
decade. The true number is probably even higher, because some clinics
had incomplete records and others declined to provide data..."
Photo credit: "
The Sidney Coal Co.'s Coal Preparation Plant in Sidney, Ky., in 2006.
" Brian Tietz/AP.
Breaking News: Solar Now The Cheapest Form of New Electricity. So reports Bloomberg: "There’s
a transformation happening in global energy markets that’s worth noting
as 2016 comes to an end: Solar power, for the first time, is becoming
the cheapest form of new electricity. There have been isolated
projects in the past where this happened: An especially competitive
auction in the Middle East, for example, resulting in record-cheap solar
costs. But now unsubsidized solar is beginning to outcompete coal and
natural gas on a larger scale, and notably, new solar projects in
emerging markets are costing less to build than wind projects, according
to fresh data from Bloomberg New Energy Finance..."
Graphic credit: "
Disclosed capex for onshore wind and PV projects in 58 non-OECD countries." Source: Bloomberg New Energy Finance.
Will Elon Musk Be The Champion Cleantech Needs at the White House? Greentech Media has the article; here's a clip: "...
Where
Musk could be most effective as a Trump adviser is in advocating for
continued investments in cleantech research and development at the
Department of Energy. Among many other things, the DOE has played an
instrumental role in bringing down the cost of lithium-ion batteries and
helping to develop the next generation of battery technologies.
Companies like Tesla stand to benefit from government-led innovation and
government-trained talent pool. However, it's unclear what kind of
policy advice Musk's "go-it-alone" attitude will translate into. Tesla's
leadership frequently touts the company's abilities, like cutting battery costs
faster than projections. So it's possible that Musk will argue that
entrepreneurship is the true source of innovation, not the state..." (Image:
Investopedia).
Biggest Tech Failures and Successes of 2016.
Yes, but how will this impact my AOL account? And can I find anyone to
give me a fair price for my CB radio and 8-Track player? Here's an
excerpt from The New York Times: "If
you love technology, it may be time for a group hug: This year has been
rough for consumer technology. From exploding smartphones and
hoverboards to the proliferation of fake news on social media, many of
our tech hardware, software and web products suffered embarrassing
failures. Behemoths like Google, Facebook and Samsung Electronics were
on the firing line as a result. Yet the year was not entirely bleak.
There were major strides in several areas of consumer tech, including
Wi-Fi, virtual reality and encryption. What follows is a year in review
on the tech that needed the most fixing, and the tech that was actually
fixed in 2016..."
In 1562 Map-Makers Thought America Was Full of Mermaids, Giants and Dragons.
You mean to tell me it wasn't full of mermaids, giants and dragons? I
thought I read that fake news story on Facebook. Here's an excerpt from
Atlas Obscura: "
In
the 15th and 16th centuries, the mysterious lands of the western
hemisphere were a misty haze of tales and stories. After Christopher
Columbus set foot in the New World, curious Europeans ate up fantastic
sagas about sea monsters, exotic wildlife, and foreign civilizations.
Teasing out fact from folklore created an ever-growing obstacle for
depicting what the Americas truly looked like. In 1562, Spanish
chartmaker Diego Gutiérrez and Dutch engraver Hieronymous Cock made such
an attempt. They visualized the New World in a massive six-paneled
engraved map—the largest engraved map of America of its time..."
TODAY: Wind Chill Warning. Snow tapers, falling temperatures. Winds: NW 10-20. Wind chill: -20s. High: 5 (falling)
SUNDAY NIGHT: Wind Chill Warning. Near-record cold. Clearing - frigid. Low: -20
SUNDAY: Wind Chill Warning. Possibly the coldest day of winter. Some sun; feels like -30 early. Winds: SW 5-10. High: -4
MONDAY: Mostly cloudy, feels much better. Winds: SW 10-20. Wake-up: -6. High: 26
TUESDAY: Milder with gusty winds, few flurries. Winds W 15-25. Wake-up: 21. High: 35
WEDNESDAY: Chance of light snow, slushy? Winds: W 10-15. Wake-up: 20. High: 32
THURSDAY: Peeks of sun, good travel weather. Winds: W 8-13. Wake-up: 24. High: 31
FRIDAY: Clouds increase, milder breeze. Winds: S 10-15. Wake-up: 20. High: 34
Climate Stories...
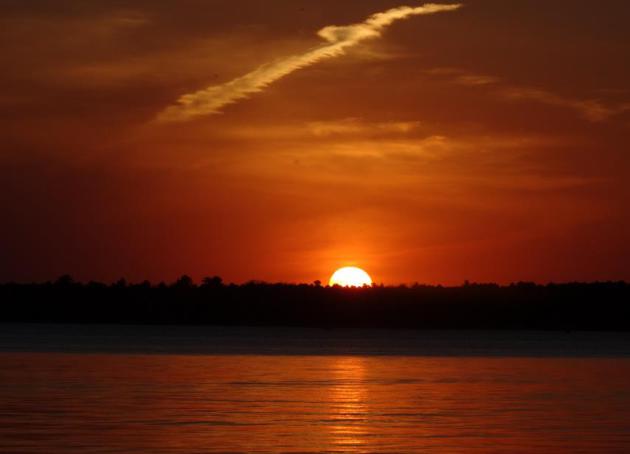
 Scientists Are Tying More Extreme Events to a Changing Climate. Here's an excerpt from The Washington Post: "A new report,
published Thursday as a special edition of the Bulletin of the American
Meteorological Society, provides some of the best evidence yet that
climate change already has a hand in our worst weather. It points
to a variety of extreme weather events in 2015 that were likely
influenced by global warming, from heat waves in Australia to heavy rain
in China to raging wildfires in Alaska.
The report, examining research on two dozen weather events, was
compiled and edited by scientists from the National Oceanic and
Atmospheric Administration, as well as the Met Office Hadley Centre for
Climate Prediction and Research..."
Photo credit: "The setting sun is partially obscured by smoke from an out of control 2015 wildfire on the Parks Highway near Willow, Alaska." (Reuters/Mat-Su Borough/Stefan Hinman).
Scientists Are Tying More Extreme Events to a Changing Climate. Here's an excerpt from The Washington Post: "A new report,
published Thursday as a special edition of the Bulletin of the American
Meteorological Society, provides some of the best evidence yet that
climate change already has a hand in our worst weather. It points
to a variety of extreme weather events in 2015 that were likely
influenced by global warming, from heat waves in Australia to heavy rain
in China to raging wildfires in Alaska.
The report, examining research on two dozen weather events, was
compiled and edited by scientists from the National Oceanic and
Atmospheric Administration, as well as the Met Office Hadley Centre for
Climate Prediction and Research..."
Photo credit: "The setting sun is partially obscured by smoke from an out of control 2015 wildfire on the Parks Highway near Willow, Alaska." (Reuters/Mat-Su Borough/Stefan Hinman).
Explaining Extreme Events From a Climate Perspective.
How much can be attributed to a warmer, wetter climate vs. natural
variability? Here's a link to more science, courtesy of the AMS, the American Meteorological Society: "This
fifth edition of explaining extreme events of the previous year (2015)
from a climate perspective continues to provide evidence that climate
change is altering some extreme event risk. Without exception, all the
heat-related events studied in this year’s report were found to have
been made more intense or likely due to human-induced climate change,
and this was discernible even for those events strongly influenced by
the 2015 El Niño. Furthermore, many papers in this year’s report
demonstrate that attribution science is capable of separating the
effects of natural drivers including the strong 2015 El Niño from the
influences of long-term human-induced climate change."
Climate Central has more
perspective.
Climate Change Worsened Deadly Heatwaves Last Year. Following up on the recent report on climate attribution, here is more perspective at
USA TODAY: "
From
Europe to India to Australia, climate change worsened several deadly
heat waves around the world in 2015, according to a report released
Thursday. "We’re seeing mounting evidence that climate change is making
heat waves more extreme in many regions around the world,” said report
lead editor Stephanie C. Herring, a scientist with the National Centers
for Environmental Information at the National Oceanic and Atmospheric
Administration (NOAA) . In all, 10 extreme hot streaks last year,
including heat waves in Europe, Egypt, India, Pakistan, China,
Indonesia, Japan and Australia, were worsened by climate change..."
Scientists: Strong Evidence that Human-Caused Climate Change Intensified 2015 Heat Waves.
NOAA provides more context: "
Human-caused
climate change very likely increased the severity of heat waves that
plagued India, Pakistan, Europe, East Africa, East Asia, and Australia
in 2015 and helped make it the warmest year on record, according to new
research published today in a special edition of the Bulletin of the
American Meteorological Society. The fifth edition of Explaining Extreme Events from a Climate Perspectiveoffsite link
presents 25 peer-reviewed research papers that examine episodes of
extreme weather of 2015 over five continents and two oceans. It features
the research of 116 scientists from 18 countries analyzing both
historical observations and changing trends along with model results to
determine whether and how climate change may have influenced the event..." (Image credit: NOAA).
Link Between Warming Oceans and More Extreme Typhoons in Western North Pacific.
It turns out there is a connection between warming of air and water and
the intensity of some of the typhoons (hurricanes) impacting the
western Pacific. The paper is
here, courtesy of the American Meteorological Society.
The Best Climate Graphics of the Year. Visualizing what's happening in ways that are easy to comprehend is non-trivial, and mission-critical. Here's an excerpt from Vox: "Here
at Vox, we’re big fans of clever graphics and visualizations that make
climate change, which can sometimes seem abstract and impenetrably
complex, easier to grasp. We’ve highlighted several this year (see here, here, and here),
more than one of them from University of Reading climate scientist Ed
Hawkins, who seems to have a real eye for these things. Helpfully,
Hawkins has rounded up his own favorite climate visualizations from the
year in one place — graphics showing the rise in temperatures, the rise
in CO2 concentrations, the melting of Arctic ice, and more. So without
further ado, here are the coolest, most visually arresting ways of
understanding just how screwed we are. Thanks, 2016..."
NASA Produces First 3-D Animation of Global Carbon Emissions. Here's an excerpt from
EcoWatch: "
The
National Aeronautics and Space Administration (NASA), the U.S. space
agency, has released an "eye-popping" three-dimensional animation
showing carbon dioxide emissions moving through the Earth's atmosphere
over the course of a year. It says
the 3-D visualization is "one of the most realistic views yet" of the
"complex patterns in which carbon dioxide in the atmosphere increases,
decreases and moves around the globe." The data used to produce the
visualization was collected by NASA's Orbiting Carbon Observatory-2 (OCO-2) satellite from September 2014 to September 2015..."
Late Night Comics Could Have a Real Impact on Climate Change Denial. Don't laugh - there's something here, reports
Popular Science: "...
People
watch these comedy shows in large part to be entertained. They’re not
there for the science. They’re sometimes there for the politics,” said
Feldman. Airtime on comedy shows, Feldman said, is "going to get a whole
lot more people paying attention to science.” In a 2011 study,
Feldman and her colleagues found that people who watched The Daily Show
and The Colbert Report were more likely to follow news about science
and technology—and particularly global warming. The effect was most
pronounced among viewers without a college education..."
Climate Denial Stages a Roaring Comeback. InsideClimate News has the story.
Tell Investors of Climate Risks, Energy Sector Is Urged. Here's a clip from The New York Times: "A coalition of the world’s most powerful bankers, regulators and even executives at some heavy polluters have a message for oil and gas companies: Be more forthcoming about the risks posed by climate change. The new guidelines, issued on Wednesday by a task force commissioned by the Group of 20
richest nations, are some of the most comprehensive about how companies
should measure and disclose the predicted effects of extreme weather
and rising seas. These recommendations come at a tough time for climate
advocates, still reeling from the prospect of a presidential
administration in the United States hostile to steps to address climate
change. With little prospect for new rule making in the United States
and slow progress elsewhere, the task force urged corporations to
disclose climate risks voluntarily..."


No comments:
Post a Comment