Distracting Case of Spring Fever Next 48 Hours
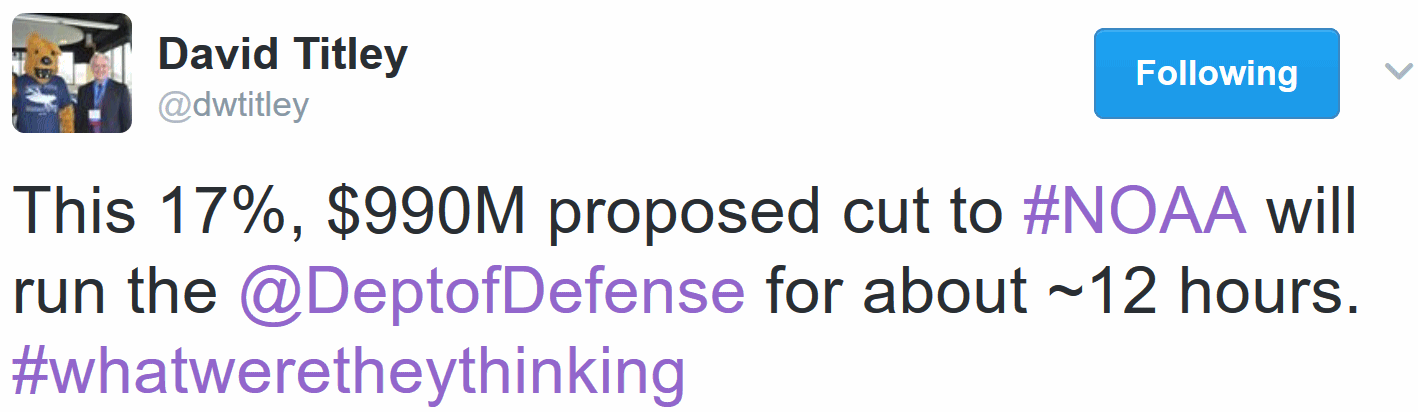
Cutting the federal budget is a good idea, but at the expense of public safety? NOAA's budget may be cut by 17 percent, much of that coming from satellite operations. 95 percent of data feeding our weather models comes from satellite data. Junk in - junk out.
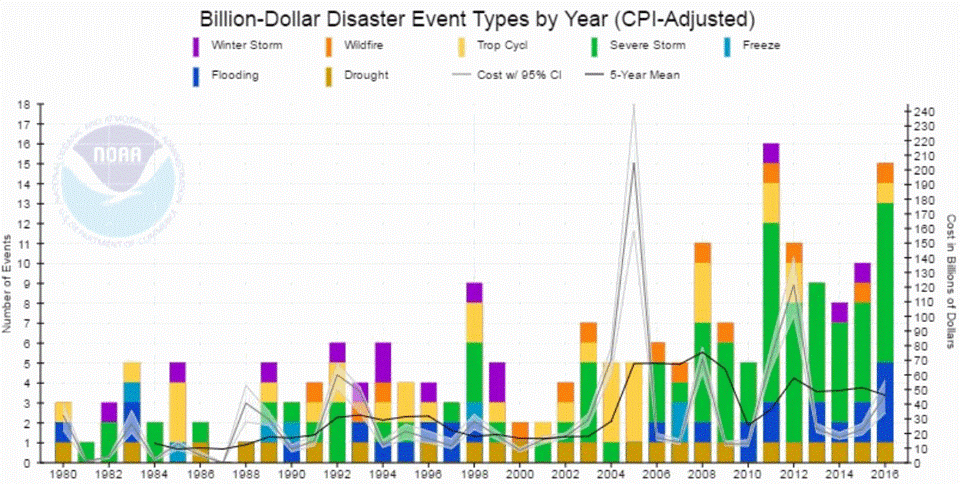
Weather-related natural disasters in the U.S. have more than tripled since 1980; $3 trillion dollars in damage the last 37 years.
It's a little like asking doctors to do without CT scans and sophisticated blood tests, then expecting them to make perfect diagnoses.
God-forbid another Sandy or Katrina-size storm hits, killing thousands, and it was because of dumbed-down weather models and inaccurate warnings, emanating from a crippled National Weather Service.
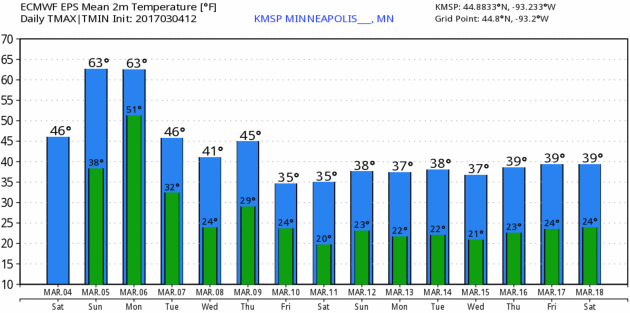
Spring comes sailing into town today as the mercury tops 60 F. Mid-60s and stray thundershowers Monday give way 40s later in the week - even 30s next weekend. The biggest, wettest storms sail south of Minnesota into mid-March.
PS: America sees more severe weather than any country on Earth. We need a state-of-the-art National Weather Service fully up to the challenge.
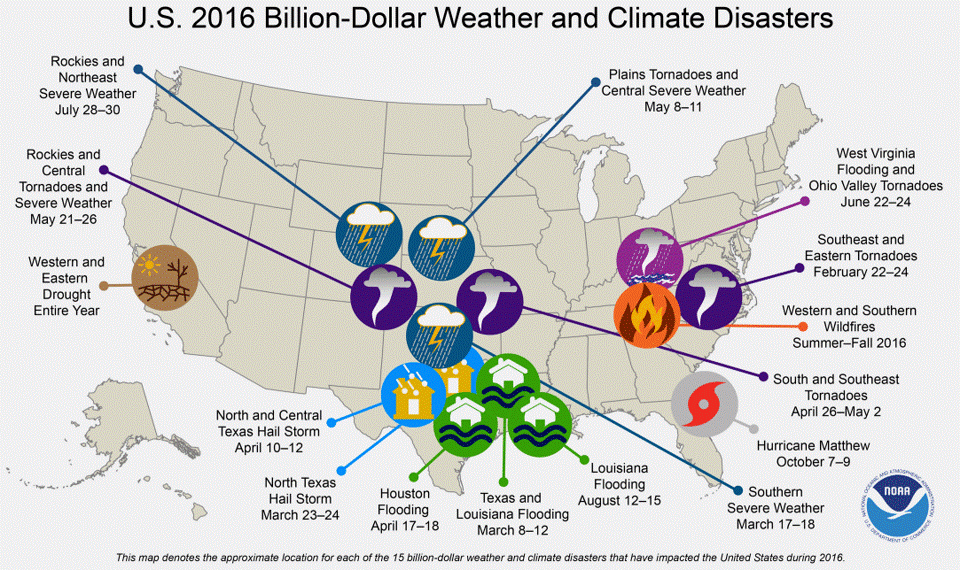
Billion-Dollar Weather Disasters in 2016. There were 15 altogether, one less than 2012, which had the most billion-dollar disasters on record. Map: NOAA NCDC.
Large Cuts Proposed for U.S. Weather Prediction. Here is an excerpt of a must-read post from Cliff Mass, outlining the implications of proposed NOAA budget cuts: "...The proposed cuts (described here) are huge and would cripple the ability of the National Weather Service to improve the quality of weather predictions provided to the American peopleCuts include:
1. A half-billion dollar reduction in NOAA's satellite program run by National Environmental Satellite, Data and Information Service (NESDIS). Weather satellite's provide 95% of the information used to initialize weather prediction models and such a large cut would result in the loss of major satellite observing systems. Weather prediction skill would decline.
2. A 26% (126 million) cut in the Office of Atmospheric Research (OAR)
OAR is responsible for the development of the next generation of
weather prediction models and the technologies underlying U.S.
operational weather forecasting. Such a large cut would greatly
undermine current activities to replace the problematic current
generation of U.S. global models. It would undermine the development of
new approaches to data assimilation of observational data. And much
more..."
Four Ways NOAA Benefits Your Life Today. Dr. Marshall Shepherd takes a look at how NOAA data fuels our everyday lives at Forbes: "...According
to figures in the Washington Post, the White House proposal eliminates
$513 million, or 22 percent of NOAA's satellite division or National Environmental Satellite, Data and Information Service. This division also houses critical climate data at the National Center for Environmental Indicators. This data is vital for understanding how our weather and climate are changing. Numerous reports have cautioned about looming gaps in weather satellite coverage
as our fleet of low-earth and geosynchronous orbiting satellites age.
Weather satellites provide a critical service for the public, the
military, industry, and other stakeholders. They are like smoke
detectors in our homes. You know they are there but really do not pay
them any attention until your house is on fire. For the safety of our
families, we replace the batteries when they age. This is pretty simple
to do for a smoke detector, but large satellite programs are different.
They require sustained and consistent funding for research and
development, industry contracts, and support..."
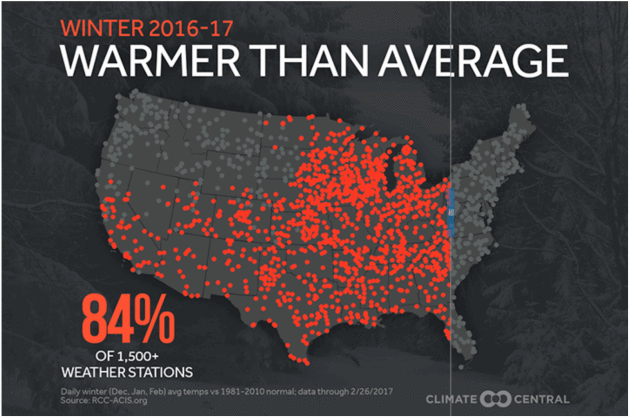
Recap of Meteorological Winter in Minnesota. Once again Dr. Mark Seeley helps to put the numbers into perspective at Minnesota WeatherTalk: "The 6th warmest February in state history concluded earlier this week, along with the end of Meteorological Winter (in the northern hemisphere December through February). The Meteorological Winter definitely followed the climatic trends of recent decades by being both warmer and wetter than normal. It was the 10th warmest Meteorological Winter in state history back to 1895, and the 15th warmer than normal one of the last 20 years on a statewide basis. Over the 90-day season approximately 700 daily temperature records were set within the state's climate observation networks, including 286 new daily high maximum temperatures and 414 new daily high minimum temperatures. During the Meteorological Winter Minnesota reported the coldest temperature in the 48 contiguous states only 9 times, a small number when compared to history. In December it happened 3 days, in January 4 days, and in February just 2 days..."
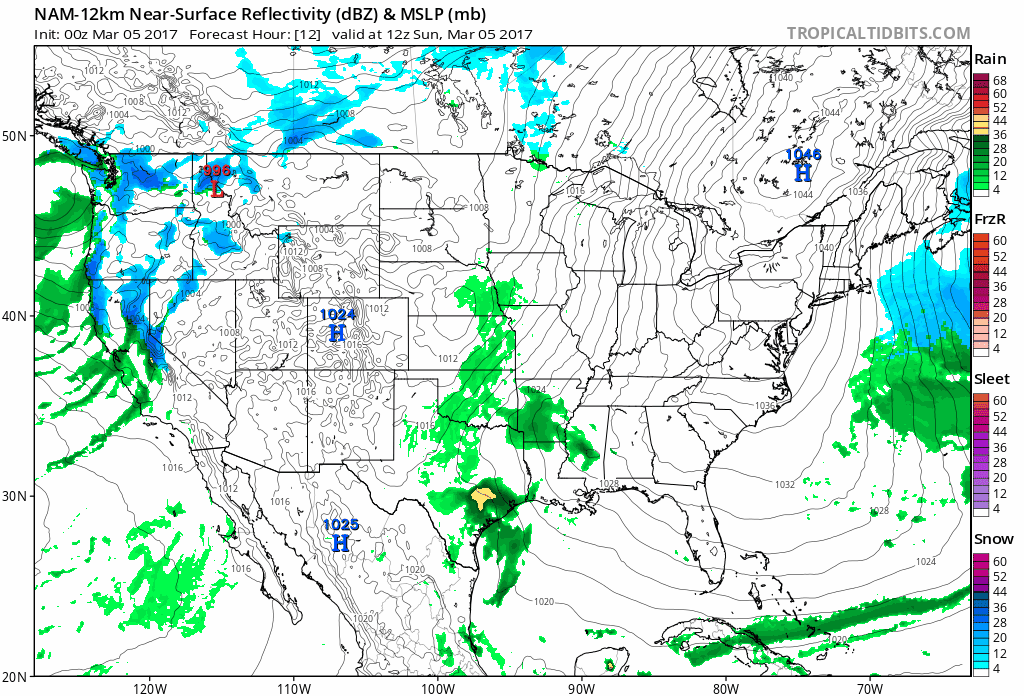
Winter Lingers Out West - April Preview Eastern Half of America. Another day, another storm pushing across the west coast into the intermountain west and Rockies, while a warm, moist fetch from the Gulf of Mexico sparks another outbreak of showers and T-storms from Texas as far north as the Twin Cities and Milwaukee by Monday. Source: Tropicaltidbits.com.
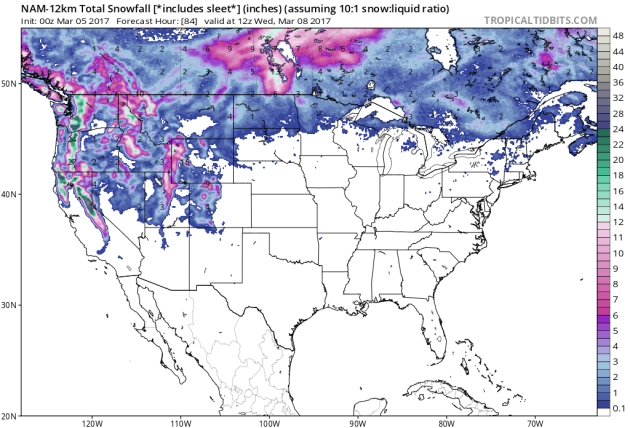

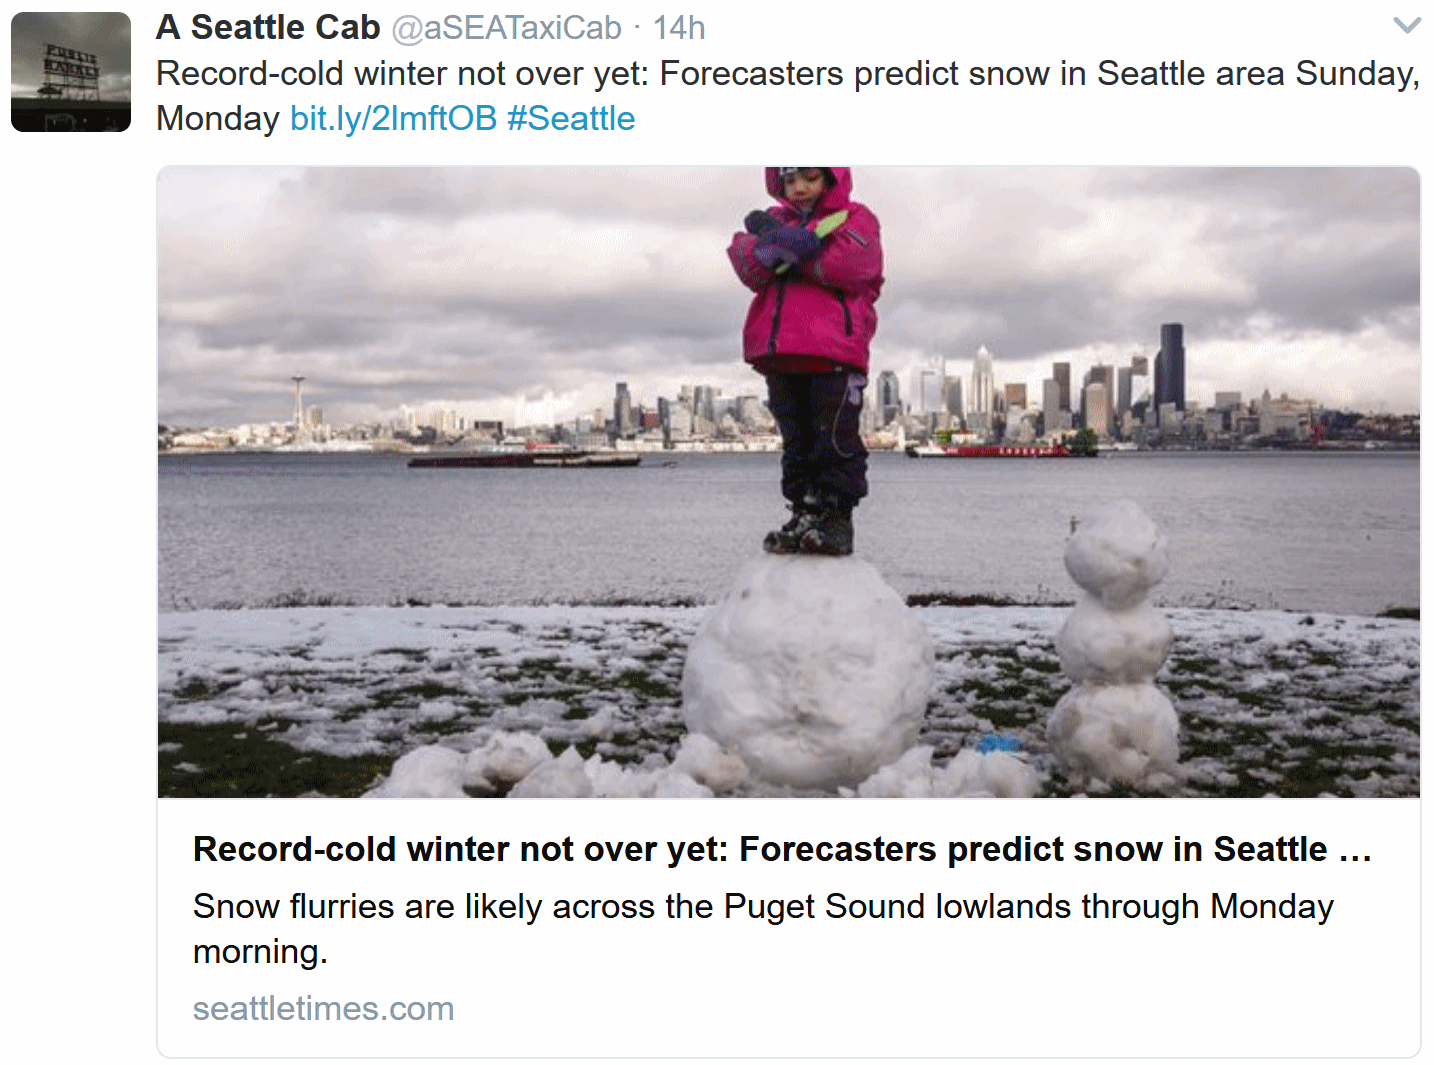
Coldest Winter in Seattle Since 1985. Curbed Seattle has the statistics: "If your heating bill weren't evidence enough, the National Weather Service has confirmed it: this winter has been the coldest Seattle has seen in a long time. December 2016 through February 2017 was Seattle's coldest since 1985, with 56 days below normal temperatures according to the NWS Seattle. It's also been a wetter-than-usual several months, with nine inches above normal precipitation since October - although we got more than 13 inches during the same period the year before..."

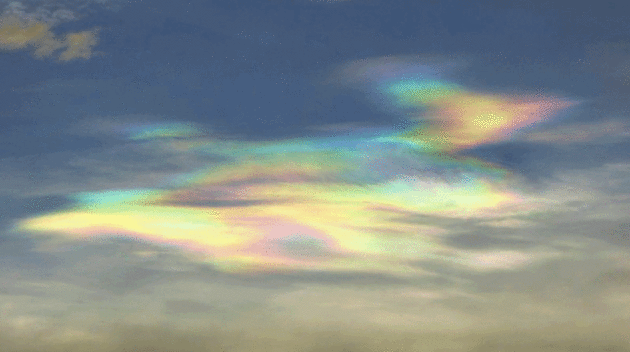
What Causes Rainbow Colors in Clouds? EarthSky has a good explanation and some wonderful examples of one of my favorite optical illusions: iridescent clouds: "Sky
watchers sometimes report seeing rainbow colors within clouds. These
colorful clouds are called iridescent clouds. When you see a cloud like
this, you know there are especially tiny ice crystals or water droplets
in the air. Larger ice crystals produce solar or lunar halos,
but tiny ice crystals or water droplets cause light to be diffracted –
spread out – creating this rainbow-like effect in the clouds. The
phenomenon is called cloud iridescence or irisation. The term comes from
Iris, the Greek personification of the rainbow..."
Photo credit: "Bird-shaped iridescent cloud over Mutare, Zimbabwe – February 13, 2017 – from Peter Lowenstein. Seeing shapes in clouds is an example of pareidolia."
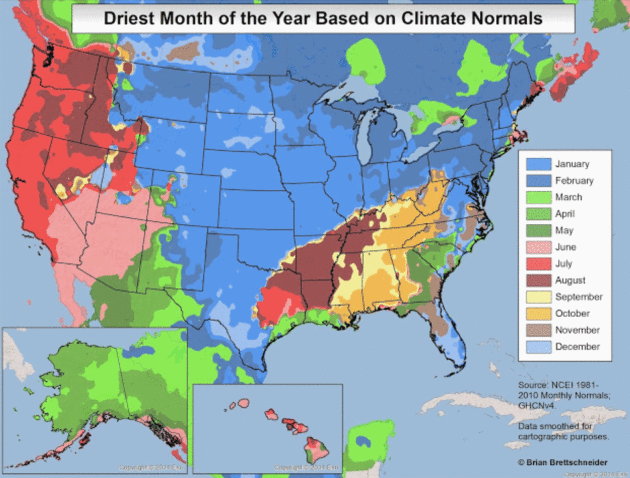
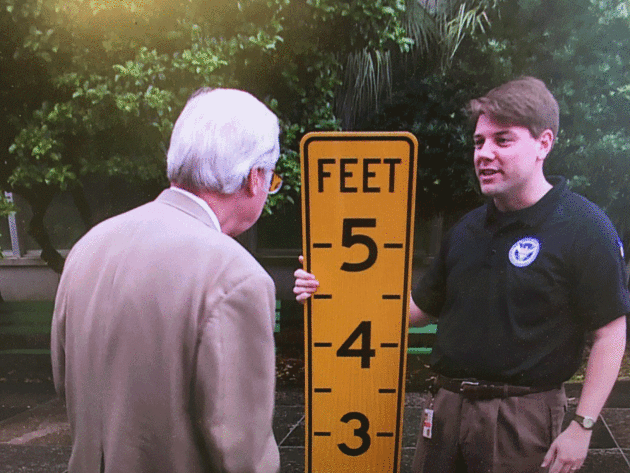
Photo credit: "Aaron Miller, Director of Homeland Security & Emergency Preparedness in New Orleans with new road sign to be placed at flood prone underpass, photo via @BillCapo on Twitter."
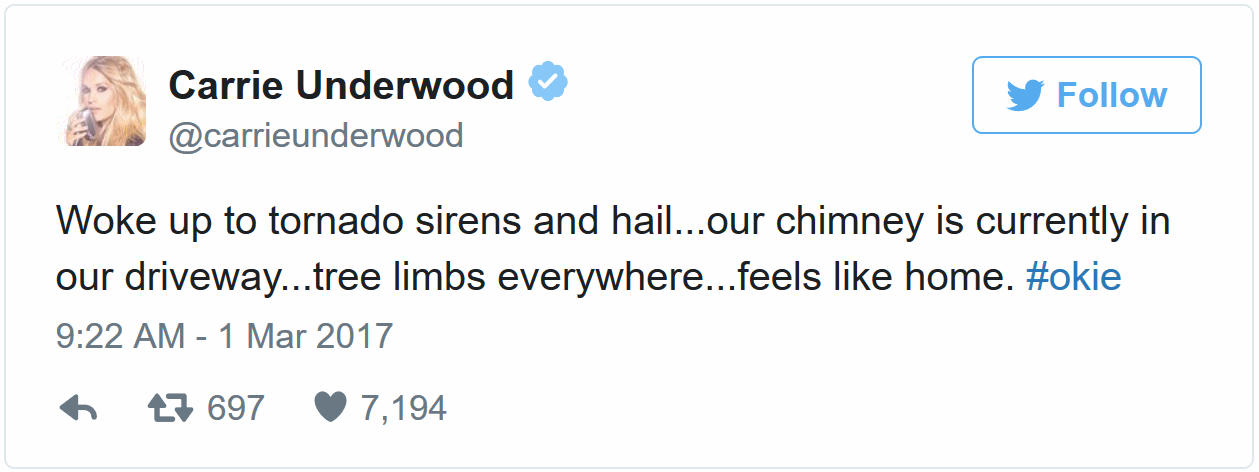
Carrie Underwood Reveals Home Was Hit by Nashville Tornado. MSN.com has an update: "FOX 17 News in Nashville reports that the storm's 100 mph winds caused damage to trees and power lines — and, indeed, a possible tornado may have touched down. But twisters are nothing new to Underwood, who spent the first two decades of her life in Oklahoma, where tornadoes are a dime a dozen. The state lies in an area along the Great Plains some dub Tornado Alley. In fact, 33-year-old Underwood wrote about a tornado on her 2011 hit single "Blown Away," which finds the song's character wishing for a metaphorical twister to come and wipe away painful childhood memories..."
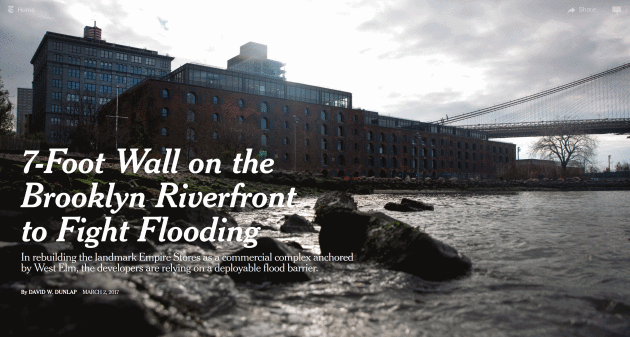
7-Foot Wall on the Brooklyn Riverfront to Fight Flooding. The New York Times reports: "...Should
the forecast call for an unrelenting storm, workers will erect the
panels a day before anticipated landfall, creating a 1,100-foot-long
barricade — one-fifth of a mile — in four to five hours. If all goes as
hoped, Empire Stores, which includes West Elm’s
headquarters, will ride out the flood like a tasteful island in a
surging sea. Communities across the country are confronting the mounting
evidence of climate change
and fortifying buildings and infrastructure against rising sea levels
and ever-more-intense storms. The New York Times is presenting case
studies in resilient design in and around New York City. The series and a glossary are looking at tangible measures being taken to resist floods, surges, high winds and heavy rains..."
Photo credit: "Flooding
is a constant threat to Empire Stores, a converted warehouse on the
East River in Brooklyn. Elevating the infrastructure was not practical
for the historic building, so owners purchased a flood barrier to be
erected if inundation threatens." Credit Kevin Hagen for The New York Times.
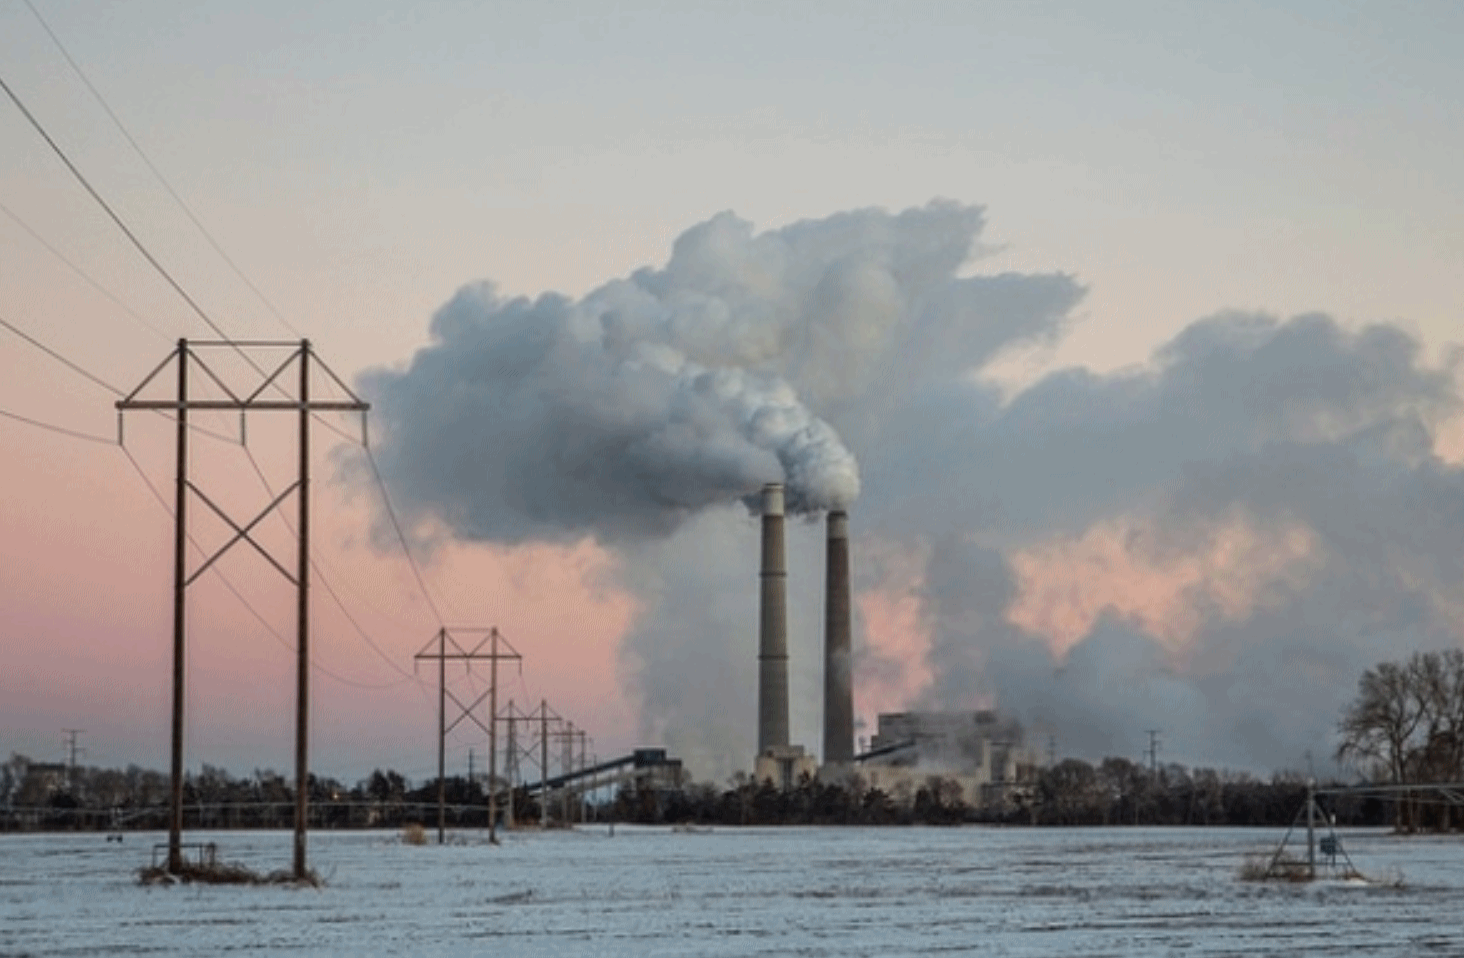
Why Democrats and Republicans are Both Right on Climate. Here's an excerpt of an Op-Ed from Daniel Kammen at Scientific American: "...Together the CPP and the CDP build a vibrant, intensely job-creating energy sector that would be far larger than either plan accomplishes alone. The CPP does not pit one state against each other, but pushes each state to develop its own carbon reduction plan. Both red and blue states are finding this easier and more profitable than previously imagined. The power sector reduced its carbon emissions 21 percent between 2005-2015, primarily by switching from coal to gas. It is well on the way to complying with the Clean Power Plan. The CPP will accelerate the transition to money-saving energy efficiency, and to a job-rich renewable energy sector. Countries such as China, Bangladesh, Denmark, Germany Kenya, Korea, and Portugal have seen tremendous manufacturing and job growth as they made their electricity sectors more diverse, clean, and job-producing..."
Photo credit: "Coal-fired power plant, Minnesota." Credit: Tony Webster Flickr (CC BY-SA 2.0)

Do Environmental Regulations Reduce Employment? Not Really. Here's an excerpt of a post from Dave Roberts at Vox: "...At the most basic level, the story is simple. Market economies tend to grow or contract based on broad macroeconomic factors such as aggregate demand, the rate of inflation, and population growth. As long as demand remains strong, inflation remains low, and the population grows, economic growth generally conntinues and employment rises. If those factors go the other way, growth slows and employment falls. Within this broad framework, regional or sectoral developments (regulations on a particular industry, particular industries growing or declining, population shifts between and among regions) are generally lost in the national noise. If a particular resource declines, the market finds substitutes. If a particular industry declines, other industries grow and absorb the workers..."
Photo credit: Wikipedia.
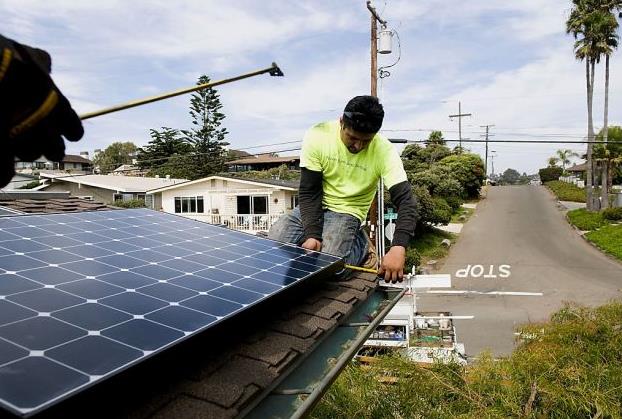
Photo credit: Sam Hodgon, Bloomberg.
SUNDAY: Mild sun, breezy. Winds: S 10-20. High: 62
SUNDAY NIGHT: Clouds increase, risk of a shower. Low: 53
MONDAY: Humid, risk of a T-shower. Gusty winds. Winds: S 15-35. High: 65
TUESDAY: Mostly cloudy, few windswept flakes. Winds: W 15-30. Wake-up: 37. High: 44
WEDNESDAY: More sun, not quite as windy. Winds: NW 10-15. Wake-up: 27. High: near 40
THURSDAY: Partly to mostly cloudy, milder. Winds: SE 8-13. Wake-up: 26. High: 45
FRIDAY: Mild start, then turning cooler. Winds: NW 10-20. Wake-up: 34. High: 46
SATURDAY: Cool sun, wet snow far south? Winds: NE 8-13. Wake-up: 22. High: 34
Climate Stories....

Was Our Snowless January and February a Sign of Climate Change? Here's an excerpt from Chicago Magazine: "...Just two months of abnormal weather can’t prove anything on their own, the climate experts say. However, the Earth is setting more record-high temperatures than record-low temperatures lately, and that is a sign of global warming. According to Horton, weather variability is natural in Chicago due to its location in the mid-latitudes, “the middle segment of the Earth where the weather is controlled by an oscillating jet stream,” which are slim strips of wind. This means that naturally, Chicago will have more irregularity in weather, as compared to the area near the equator, where temperatures are steady and predictable..."
Photo credit: "Shorts in February—should we be scared?" Photo: Michael Tercha/Chicago Tribune.
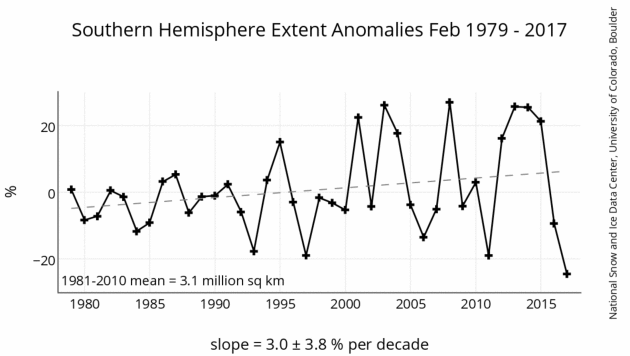
Graphic: National Snow and Ice Data Center.
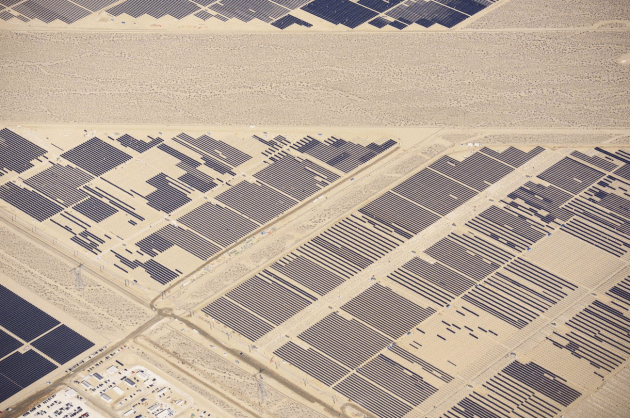
Photo credit: "Spread over 400 acres, Nevada Solar One is a massive project built in the hot, dry desert just south of Las Vegas. The plant uses 760 parabolic trough concentrators with more than 182,000 mirrors that concentrate the sun’s rays onto more than 18,240 receiver tubes. Every year, the projected amount of CO2 emissions this plant avoids putting into the atmosphere is equivalent to taking approximately 20,000 cars off the road. It is a refreshing site to look at—I can't wait to fly a solar-powered aircraft one." Photograph by Jassen T., National Geographic Your Shot.

You Can Care About Climate Change and Still Enjoy Freakishly Warm Winter Days. Food for thought from Jason Samenow at Capital Weather Gang: "...I understand that the concern about climate change is not a single ridiculously warm day but the trend toward many of them. But, of the various consequences of climate change, warm winters days are least deserving of our angst. Warm weather positively influences our mental well-being, the New York Times reported on Feb. 24, a day when the temperature soared to 70 degrees in New York City. On such warm days, it said: “We may be more helpful … We may spend more money … It may elevate our mood … [and] It may put us in the mood for love.” Indeed a study in Nature last April found that “virtually all American are now experiencing the much milder winters they prefer” because of climate change. Climate change is a story of mixed effects. Some are good, and some are bad..."
Photo credit: "Blossoms blooming at Congressional Cemetery. Feb. 25, 2017." (Jim Havard via Flickr)
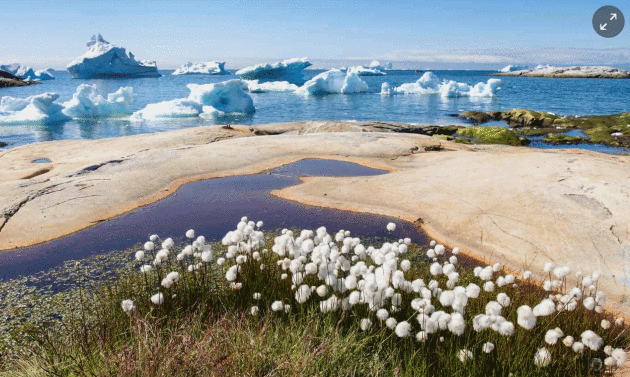
Photo credit: "Arctic cotton grass grows on Greenland’s seashore. Sedge is almost four weeks ahead of its timetable 10 years ago." Photograph: Pearl Bucknall/Alamy.
Regarding that one tweet: the one agency is constitutionally prescribed. The other is not. It is time to stop spending our way into national bankruptcy. If so many businesses are dependent on weather information, let them pay for it. A crippled NWS - who cares? ECMWF gave us Sandy forecast. Clearly the huge amounts were spending aren't buying us anything. Commercial firms can do better.
ReplyDelete