40 F. high yesterday in the Twin Cities.
24 F. average high on January 27.
36 F. high on January 27, 2015.
4" snow on the ground at MSP.
January 28, 1914:
A very rare thunderstorm (for this time of year) is observed at Maple
Plain during the evening. Heavy thunder and vivid lightning was
observed.
January 28, 1846:
Temperatures are not too shabby for a January day. The high in the Twin
Cities was 50, which is the normal high for the beginning of March.
A Happy King Boreas - Numbing Start to FebruarySome
Minnesotans tolerate winter, comparing it to a dark, near-death
experience. Many embrace the snow and cold - and today marks the
kick-off of
St. Paul's (amazing) Winter Carnival. It's a good opportunity to thumb our collective noses at Old Man Winter and eat, drink and play in the snow.
I expect only minor melting of ice sculptures in Rice Park into
Sunday with afternoon temperatures in the 30s. The mercury nudges 40F
on Saturday; a heat wave for Minnesota in late January.
Soak
up the relative warmth because King Boreas gets the last laugh next
week. Although not as bitter as 10-13 days ago I expect single digit
highs by late next week; a few more nights dipping below zero. Hardly
record territory, but cold enough for most folks.
Models still spin up a storm next week; loaded with moisture from the Gulf of Mexico a plowable snowfall is still possible
Tuesday,
but it's still much too early for specifics. That will depend on the
final track - but snow lovers should be cautiously optimistic.
Dripping icicles this weekend give way to a reality check
within one week.
Vacation from Wind Chill - Winter Bares Its Fangs Late Next Week.
An extended spell above 32F is likely into Sunday, possibly Monday
before temperatures tumble next week, reaching single digits by the end
of the week. The atmosphere may be warm enough for a light mix Friday,
again Saturday, with the best chance of accumulating snow late next
Tuesday into Wednesday. Source: WeatherSpark.
Milder Than Average.
Models are in tight alignment, showing highs in the mid to upper 30s
the next 4 days; 40F is not out of the question again on Saturday.
Source: Aeris Enterprise.
Another Correction.
Although not as brisk as 10-12 days ago by the end of next week daytime
temperatures hold in single digits, a few nights below 0F. The first
week of February starts out considerably colder than average.
Still Too Early to Panic (or Celebrate!)
NOAA models prinnt out .8 to 1" liquid next Tuesday night into
Wednesday, which would translate into a significant pile of wet snow.
Final amounts will depend on the precise storm track, how much moisture
gets pulled into Minnesota, and the temperature profile of the lowest
mile or so of the atmosphere.
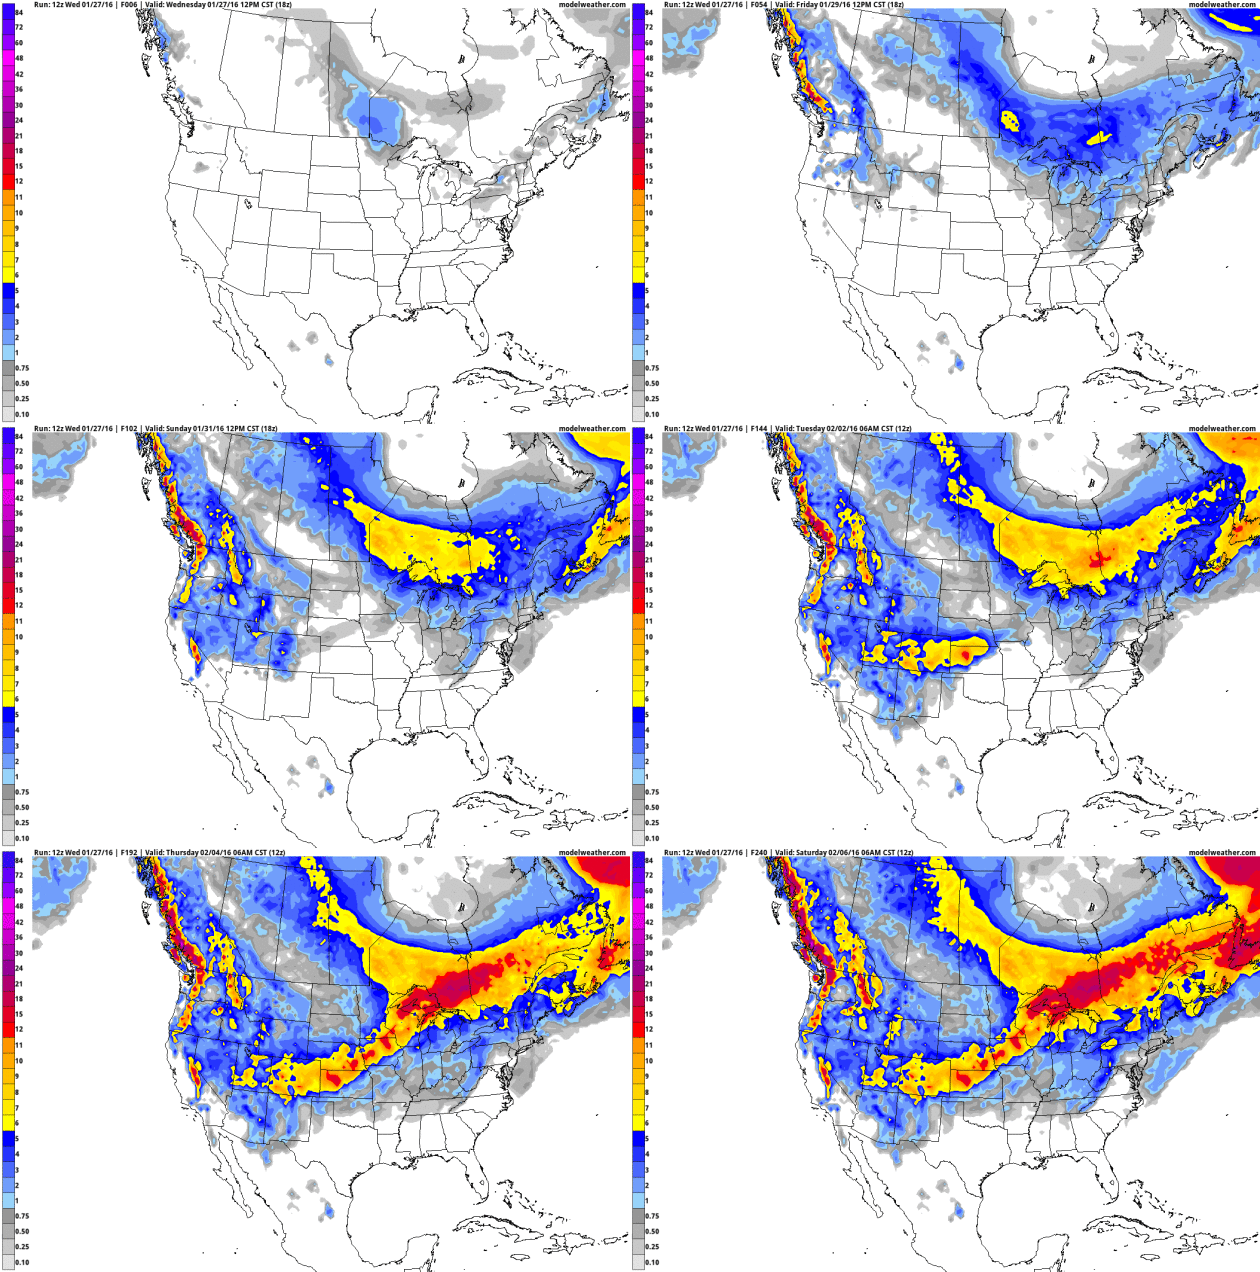
GFS 10-Day Accumulated Snowfall.
It's not reality, it's a weather model, but GFS guidance shows the
heaviest amounts of snow setting up just south and east of MSP Tuesday
PM into Wednesday AM, a swath of 6"+ possibly setting up close to home.
The greatest chance of accumulating snow appears to be over the
southeastern half of Minnesota. Source: NOAA and AerisWeather.
AO Goes (Slightly) Negative.
Compared to the cold shot in mid-January this may only be a glancing
blow of arctic air; the Arctic Oscillation (AO) forecast to trend higher
after February 6 or so. Source: NOAA.
El Nino Signal to Linger.
Here is the latest NOAA CFSv2 (Climate Forecast System) model for
February and March, showing warm anomalies as much as 5-7F warmer than
average for Minnesota and much of the northern USA and central Canada, a
reflection of a potent, but fading El Nino warming signal in the
Pacific. Map credit: NOAA and WeatherBell.
The Blizzard of '16 Ranked As One Of The Northeast's Worst Winter Storms. A story at
WXshift provides some perspective; here's an excerpt: "...
That’s
enough for this storm to rank as a Category 4 winter storm, which NCEI
describes as crippling. Based on the score that goes with the rank, this
storm will go down as the sixth-most severe winter storm on record for
the Northeast. NCEI's records include 199 winter storms to hit the
region since 1900. It ranked as the fifteenth-worst storm on record for
the Southeast out of 153 winter storms recorded since 1900. This
storm had the smallest geographical footprint among the top 10
strongest winter storms to hit the Northeast, but the area it hit the
hardest also happened to be one of the most densely populated swaths of
land in the country..."
Map credit above: "
A snowfall map and RSI score for this weekend's bizzard." Credit:
National Centers for Environmental Information
 16 National/Territorial All-Time Extreme Heat Records Set in 2015
. Meteorologist Jeff Masters at
Weather Underground has a very interesting post; here's the intro: "
In
addition to being the warmest year on record when averaged over the
entire globe, 2015 was also notable for all-time extreme heat records.
Sixteen nations or territories tied or set all-time records for their
hottest temperature in recorded history in 2015, and two (Israel and
Cyprus) set all-time cold temperature records. For comparison, only two
nations or territories set all-time heat records in 2014, and nine did
in 2013. The most all-time national heat records held by any year is
nineteen in 2010. Most nations do not maintain official databases of
extreme temperature records, so the national temperature records
reported here are in many cases not official...."
Map and data credit: Maximiliano Herrera.
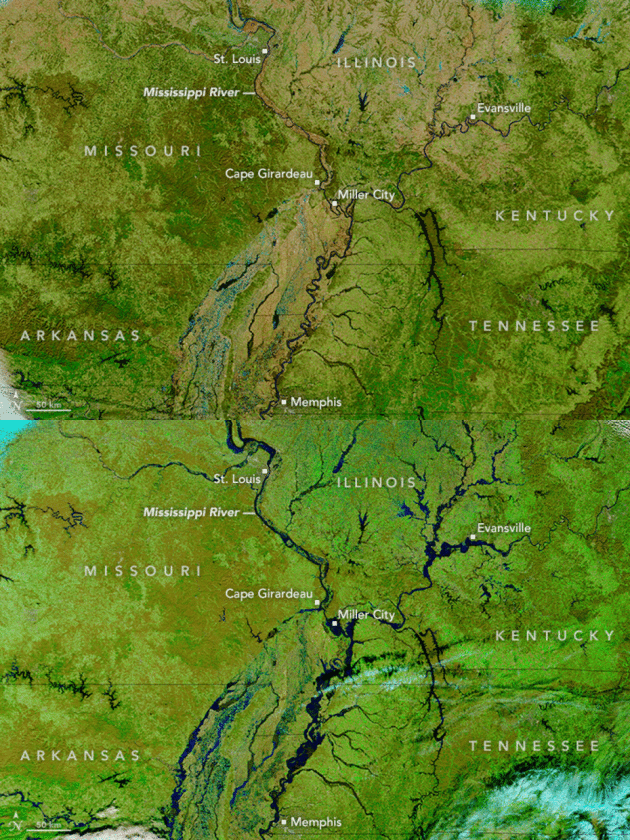
Raising The High-Water Mark. Why are we seeing 1-in-100 and 1-in-500 year floods with much greater frequency? Here's a clip from an NRDC article at
onEarth: "...
What
sounds like a freak occurrence probably feels more like déjà vu to
residents along the Mississippi, where communities have recently been
inundated with more and more so-called 10-, 25-, 50-, and 100-year
floods. It’d be easy to think a “200-year flood” was little more than
media hyperbole. In reality, though, these dramatic-sounding
designations are based on real calculations, made by government agencies
like the U.S. Army Corps of Engineers and FEMA. What’s worrisome is
that these estimates no longer seem to reflect our increasingly
waterlogged reality..."
Animation credit: "A comparison of NASA satellite images of the Mississippi River on January 3, 2016 and January 10, 2015."
El Nino Parches Asia Pacific, Destroying Crops and Drying Up Water Supplies.
Reuters has the story; here's the intro: "
Severe
El Niño-linked drought has destroyed crops, killed farm animals and
dried up water sources across East Asia and the Pacific, aid workers
said, and UNICEF appealed for $62 million to assist children impacted by
various crises in the region.
Humanitarian agencies are monitoring and responding to droughts and food
insecurity in an area from Indonesia and the Philippines, southeast to
Papua New Guinea and the Pacific Islands.
"El Niño is peaking at the moment, and we expect the impacts to come up
after the peak," said Krishna Krishnamurthy, a regional climate risk
analyst for the World Food Programme..."
Photo credit above: "A
father with his children walk over the cracked soil of a 1.5 hectare
dried up fishery at the Novaleta town in Cavite province, south of
Manila May 26, 2015." Reuters/Romeo Ranoco.
Study: Man-Made Heat Put in Oceans Has Doubled Since 1997. Here's the intro to an
Associated Press story: "
The
amount of man-made heat energy absorbed by the seas has doubled since
1997, a new study says. Scientists have long known that more than 90
percent of the heat energy from man-made global warming goes into the
world's oceans instead of the ground. And they've seen ocean heat
content rise in recent years. But the new study, using ocean-observing
data that goes back to the British research ship Challenger in the 1870s
and including high-tech modern underwater monitors and computer models,
tracked how much man-made heat has been buried in the oceans in the
past 150 years..."
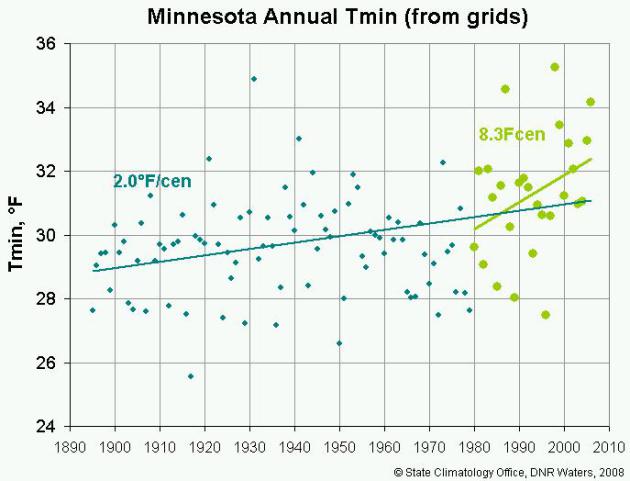
Mother Nature's Sidekick: El Nino or Global Warming? Or
both. There's a growing body of science suggesting that warmer oceans
may increase the magnitude, possibly even the frequency of El Nino warmm
phases in the Pacific. Here's an excerpt of a story at
The International Falls Journal: "...
According
to scientists who study Earth’s climate, the extreme and often bizarre
weather Minnesotans have been experiencing in the last few years is an
expected consequence of global warming or climate change. The climate -
determined by the average of many years of weather events and influenced
by major global forces, such as the buildup of greenhouse gases in the
atmosphere - is undeniably warming. Since 1970, winters have warmed by
at least 4 degrees in the top five fastest-warming states: Minnesota,
North Dakota, South Dakota, Wisconsin, and Vermont..." (Graphic: Minnesota DNR, State Climate Office).
 How Much Did El Nino Boost Global Temperature in 2015? Carbon Brief
 takes a look at new research that tries to provide perspective; here's an excerpt: "
Almost
as soon as the news broke that 2015 was the hottest year in the modern
record, the conversation quickly turned to how much of the
record-breaking warmth was down to climate change and how much to the
Pacific weather phenomenon known as El Niño. Carbon Brief has spoken to climate scientists working on this question, who all seem to agree El Niño was responsible for somewhere in the region of 10% of the record warmth in 2015. But while the science seems pretty clear, these numbers got somewhat lost in the media coverage..."
 More Extreme Weather Power Outages.
In light of the weekend blizzard knocking out power to so many people
(especially the Carolinas with severe glaze icing) I dug up a recent
Climate Central, showing an increase in weather-related blackouts since
1984. Aging infrastructure, more weather extremes, or a combination of
both factors?

Is Twitter a Better Source of Breaking Storm News?
I'm sure this will generate howls of protests from TV meteorologists,
but Twitter is a powerful tool, if used appropriately. For pinpointing
and geolocating storm damage and impacts it's an incredible resource,
but will Twitter or Facebook be able to provide context, analysis and
perspective? That's where local and national meteorologists can still
add considerable value. Here's an excerpt from the UK's Daily Mail: "The
US is glued to the news as winter storm Jonas crawls up the East Coast,
but a new study finds social media sites might be better sources for
storm news. After examining the flood that hit Colorado in 2013
researchers were able to pinpoint distressed areas using remote sensing,
Twitter and Flickr data. "By monitoring tweets and other social media
posts, these agencies could identify impacted areas in need of help
faster than ever before..."
Image credit above: "
Screenshot
of CarbonScanner during the 2013 Boulder floods showing filtered and
geolocated tweets captured by scanning application in real time (a), and
the alert box generated for which remote-sensing data collection was
tasked."
Brazil Is "Badly Losing" the Battle Against Zika Virus, Says Health Minister.
Is this looking more and more like a bad sci-fi thriller or is it just
me? It's the stuff nobody seems coming that worries me. Here's the intro
to a story at
The Guardian: "
Brazil’s health minister was warned that the country is “badly losing” the battle against the mosquito blamed for spreading Zika virus,
which has been linked to birth defects. Marcelo Castro said that nearly
220,000 members of Brazil’s armed forces would go door-to-door to help
in mosquito eradication efforts, according to Rio de Janeiro’s O Globo
newspaper. It also quoted Castro as saying the government would
distribute mosquito repellent to some 400,000 pregnant women who receive
cash-transfer benefits..."
Photo credit above: "
A
local worker disinfects the famous Sambadrome in Rio de Janeiro,
Brazil, on 26 January 2016 in an effort to protect next month’s Carnival
parades Zika-carrying mosquitoes." Photograph: Marecelo Sayao/EPA.
America's Using The Least Coal Ever to Keep The Lights On. Here's an excerpt from
Bloomberg Business: "
The
U.S. is using the least amount of coal ever to make electricity as
cheap natural gas establishes itself as the nation’s favorite
power-plant fuel. Coal’s share of total electricity generation fell in
November to a record 29 percent. Natural gas was the dominant fuel for a
fifth straight month, making up 34 percent of the U.S. power mix, the
Energy Information Administration said in a report Tuesday..."
By 2013 Renewables Will Be The World's Primary Power Source.
ThinkProgress takes a look at renewables coupled with energy storage to solve the intermittency problem; here's a clip: "..
.In November, the International Energy Agency quietly dropped this bombshell
projection: “Driven by continued policy support, renewables account for
half of additional global generation, overtaking coal around 2030 to
become the largest power source.” In this post, I’ll dive deeper into
this rapidly-approaching role reversal for coal and renewables. In Part
Two, I’ll explain why the so-called “intermittency” problem for some
renewables is basically solved and thus not a barrier to this reversal..." (Graphic credit: IEA).
The Best and Worst States for Rooftop Solar Panels.
CityLab takes a look at which states are best equipped to provide competitive solar solutions to consumers; here's an excerpt: "...
If you‘re mulling a rooftop solar installation (or any other kind of renewable energy project),
it’s worth playing around with the report’s map. It grades on just two
major criteria, but it gives a quick sense of how much of a headache to
expect from the regulatory process in a given state, and how much you’ll benefit from the energy you produce. Here’s a quick take: if you live in Alabama,
Georgia, Idaho, Oklahoma, or Tennessee, you probably want to wait for
some legislative reform, because these states score F’s on both counts.
If you’re a resident of California, Massachusetts, Ohio, Oregon, or Utah, though, full speed ahead: they’ve earned double aces..."
Map credit above: "The
interconnection map shows more room for improvement than net metering.
Many states don’t have any interconnection policy, which leads to a
failing grade." (IREC / Vote Solar).
Throw Away The Shovel: "Electric Concrete" Melts Snow. It can't come fast enough for my broken ankle, but here's another potentially game-changing innovation, courtesy of
Christian Science Monitor: "
For
commuters negotiating post-blizzard conditions, take heart: electric
snow-melting concrete may be coming to a city near you. Dr. Chris Tuan, a
professor of civil engineering at the University of Nebraska-Lincoln,
and his team of researchers have developed a concrete mixture prototype
that melts away falling snow and ice by conducting electricity. Steel
rods beneath the concrete’s surface connect to electrodes, which connect
to a 120-volt AC power source..."
Image sources:
Nebraska Department of Roads.
TODAY: Mostly cloudy, "mild" for late January. Winds: NW 10-15. High: 35
THURSDAY NIGHT: Still overcast. Low: 27
FRIDAY: Light mix possible, mainly wet roads. Winds: S 10-20. High: 36
SATURDAY: Gray skies, a little drizzle. Winds: SW 10-15. Wake-up: 33. High: 38
SUNDAY: Light mix possible, still fairly mild. Winds: W 5-10. Wake-up: 31. High: 33
MONDAY: Mostly cloudy and cooler. Winds: NW 7-12. Wake-up: 23. High: 29
TUESDAY: Potential for a plowable snow. Winds: NE 15-30. Wake-up: 22. High: 26
WEDNESDAY: Slow AM Rush. Flurries taper, still windy. Winds: NW 15-25. Wake-up: 11. High: 17
Climate Stories...
 The Zika Virus Foreshadows Our Dystopian Climate Future
. Climate activist Bill McKibbon has an Op-Ed at
The Guardian, here's a clip: "...
And
now think about the larger, less intimate consequences: this is one
more step in the division of the world into relative safe and dangerous
zones, an emerging epidemiological apartheid. The CDC has already told
those Americans thinking of becoming pregnant to avoid travel to 20
Latin American and Caribbean nations. Eventually, of course, the disease
will reach these shores – at least 10 Americans have come back from
overseas with the infection, and one microcephalic baby has already been
born in Hawaii to a mother exposed in Brazil early in her pregnancy.
But America is rich enough to avoid the worst of the mess its fossil
fuel habits have helped create..."
Map credit:
CDC.
What Are The Odds? Temperature Records Keep Falling. Here's an excerpt of an Op-Ed from climate scientist Michael Mann at
livescience.com: "...
While
the precise results depend on various details of the analysis, for the
most defensible of assumptions, our analysis suggests that the odds are
no greater than one in 170,000 that 13 of the 15 warmest years would
have occurred since 2000 for the Northern Hemisphere average
temperature, and one in 10,000 for the global average temperature. Even
when we vary those assumptions the odds never exceed one in 5,000 and
one in 1,700, respectively..."
Graphic credit above: "
Historical
Northern Hemisphere mean-temperatures (black solid line) along with the
estimated natural component alone (black dashed line) and five of the
surrogates (colored curves) for the natural component. Temperature
departures are defined relative to the long-term 1880 to 2015 average."
The Arctic is Melting and Big Business is Chomping At The Bit to Dig In. Here's are a couple of excerpts from
ThinkProgress: "...
This comes as studies
have found that Arctic ice is receding and thinning at an accelerated
pace. Annual mean ice thickness has decreased from nearly 12 feet in
1975 to some four feet in 2012, a 65 percent reduction, according to a
2015 study. Moreover, the Arctic warms
twice as fast (or more) than the Earth as a whole does.....In 2009,
only five cargo ships went through the Russian Northern Sea Route,
according to a recent study by the Council on Foreign Relations. By
2013, that figured climbed to 71..."
Photo credit above: AP Photo/Elaine Thompson.
The Science for Climate Change Only Feeds The Denial: How Do You Beat That?
More information, more data, more evidence doesn't help (with some
people). It merely feeds conspiracy theories. Here's an excerpt from
The Conversation: "...
Conspiratorial
thinking is problematic because it is immune to new evidence. Any
evidence against the conspiracy is viewed as part of the conspiracy. As a
consequence, climate science denial, and the generation of
misinformation that comes with it, is not disappearing any time soon.
This matters because several new studies have confirmed what many of us
already suspected – misinformation is effective. Just a handful of
cherry-picked statistics can reduce people’s acceptance of climate change. Of more concern to science communicators is the recent finding that misinformation can cancel out the positive effect of accurate information..."
Graphic credit above: "
Most common responses to climate change by climate contrarians."
Smith & Leiserowitz, 2012.
The Inexact (But Crucial!) Science of Climate Economics.
Pacific Standard takes a look at pricing carbon risk; here's the story intro: "
In
climate justice circles, there are few policy proposals dreamier than a
universal carbon tax—a fee on polluters that would encourage
corporations and consumers to reduce their carbon footprint, while
making green-energy sources less expensive relative to dirty fuels like
coal and natural gas.
The carbon tax is in a pickle, though, and not just because of climate
change skeptics in Congress. The problem: In order to set an efficient
market price on carbon emissions, it’s helpful to know the social cost
of those emissions (i.e. the scale of the externality being priced). But
climate economists don’t agree on that cost. In fact, they’re not even
close..."
The Blizzard of 2016 Was Influenced by Manmade Global Warming. Here's an excerpt from
Mashable: "...
Jay
Lawrimore, a senior scientist at the National Centers for Environmental
Information in Asheville, North Carolina, says that as the climate has
warmed, years with "heavy seasonal snow and extreme snowstorms continue
to occur with great frequency." He has published research showing that
the frequency of extreme snowstorms has increased in the eastern
two-thirds of the U.S. during the past 50 years. "Approximately twice as
many extreme U.S. snowstorms occurred in the latter half of the 20th
century than the first," he wrote in an email to Mashable..."
Graphic credit above: "
Top NYC snowstorms over the years, showing the clustering toward recent years (top right)." Image:
Weather5280
 Yes, Actually, Global Warming Probably Helped Supersize This Weekend's Blizzard.
 Here's a clip from
Vice News: "...
We
expect the Atlantic to continue to warm as we continue to increase
greenhouse gas concentrations through fossil fuel burning and other
activities," Mann said. "Peer-reviewed scientific studies suggest we are
likely to see more of these sorts of coastal storms in the future
because of human-caused climate change." In addition to the El Niño, the
warm coastal waters may be influenced by a mass of cold water in the
North Atlantic. This icy patch south of Greenland contrasts what has
otherwise been the warmest year on record and may be the result of
freshwater run-off from the country's melting glaciers..."
How Global Warming Helped Turn The Blizzard of 2016 Into a Record Storm. Meteorologist Eric Holthaus has more specifics at
Slate; here's an excerpt that caught my eye: "...
There are a lot of reasons for this, including a big boost from a very strong El Niño
(and some other factors that are, frankly, probably either random
chance or not well understood), but there is clear evidence global
warming is boosting the odds of recent big Northeast snowstorms. Among
the clearest is Physics 101: A warmer atmosphere is able to hold more moisture, and thus can produce heavier precipitation
(whether rain or snow) in a shorter amount of time. At the moment,
exceptionally warm waters off the East Coast (as high as 76 degrees
Fahrenheit!) are boosting the amount of water vapor in the air by about 10 to 15 percent, according to Kevin Trenberth of the National Center for Atmospheric Research..." (File photo: AP).
Is Climate Change Supercharging Storms Like Jonas and Sandy More Than We Thought? Joe Romm takes a look at
ThinkProgress; here's a clip: "...
But
the fact is that both East Coast SSTs and sea levels have been rising
considerably faster than the global average. Recent research
increasingly suggests that this apparent anomaly may not be random but
rather driven in large part by global warming itself. Stefan Rahmstorf,
Co-Chair of Earth System Analysis at the Potsdam Institute for Climate
Impact Research, has published a summary of that research (some of which
he himself conducted) in a must-read RealClimate post,
“Blizzard Jonas and the slowdown of the Gulf Stream System.” Since
higher sea surface temperatures helped drive record snowfall for Jonas,
Rahmstorf asks why SSTs are so high on the East Coast, as shown in this
graphic from Climate Reanalyzer..."
Graphic credit above: "
Sea
surface temperature (SST) anomalies for Sunday, January 24 showing very
warm water off the East Coast and a cold blob of water south of
Greenland. Recent climate research connects the two."
Climate and Conflict: Why Politicians Should Understand How Climate Change Poses a Threat to Security. To use Pentagon jargon, climate volatility is a "threat multiplier". Here's a clip from a story at
Chicago Policy Review: "...
The
authors review 55 papers regarding the relationship between conflict
and climate change. They conclude that changes in climate conditions,
such as temperature, rainfall, and water availability, influence the
conditions under which certain social interactions occur, in both the
short and long term, and thus may impact the probability and intensity
of conflicts. The study finds that these results hold across geographic
regions, different societies, and over time. The increased risk is
observed for two categories of conflict: first, for interpersonal
conflicts occurring between individuals, such as assault, murder, rape,
road rage, or violence at sporting events or by the police; and, second,
for intergroup conflicts, describing conflicts between groups of
individuals, such as organized political violence, civil conflicts,
riots, or land invasion..."
 Record Warmth "Almost Certainly" Due To Humans, Scientists Say.
 Here's a snippet from a
Bloomberg Business story: "
The
odds are “vanishingly small” that recent years of record warmth aren’t
due to human emissions of greenhouse gases, researchers in the U.S. and
Germany said, adding to pressure on world governments to cut back on
fossil fuel use. Thirteen of the 15 warmest years ever recorded were
registered through 2014, the researchers at the Potsdam Institute for
Climate Impact Research, or PIK, said Monday in the journal Nature. The
odds of that occurring naturally range from one in 5,000 to one in
170,000, they wrote. Data showing 2015 is the warmest year ever were published after their study was completed, and would make the odds even slimmer, PIK said in an e-mailed statement..."
No comments:
Post a Comment