"Wanna See a Fighter Jet Fly Through a Rainbow? Of Course You Do"
RAINBOWS ARE GORGEOUS. Jets are cool. Put them together, and you’ve got this incredible photo of a Tornado GR4 soaring through a radiant band of ROYGBIV. The photographer prefers to remain anonymous because of his day job: smuggling guns, knives, and other contraband through airports in order to expose lax security. It's exciting work, though not so exciting as what he captured last October above the Cambrian Mountains in Wales. “It was amazing,” he says. “I’ve never seen anything like it." That’s saying a lot. He grew up near the Cambrian Mountains watching the jets soar by and now regularly hikes the hills to photograph them. It's home to Mach Loop, part of Low Flying Area 7, one of 20 regions around the UK where the Royal Air Force and NATO allies train pilots. Fighter jets, helicopters, and other aircraft swoop through the valleys at altitudes as low as 250 feet. “If you climb up a side of the hill," he says, "the jets are sometimes flying beneath you."
(A Royal Air Force GR4 Tornado soars through a rainbow in the Cambrian Mountains, Wales.
CATERS NEWS AGENCY via Wired)
CATERS NEWS AGENCY via Wired)

"Terrifying footage shows plane dodge twisters as it comes to land"
"Terrifying footage shows how a plane had to dodge tornado-like columns in the sky. It happened on Tuesday, when severe weather hit the Black Sea area of Russia. Local reports suggested that there were at least 12 twisters spotted in the area above the Black Sea. Around nine flights to Sochi International Airport were diverted as the swirling columns of air formed. This video is like no flight we ever want to be a passenger on:"

"How much would Hurricane Harvey rain raise the Great Lakes?"
Hurricane Harvey has produced historic rainfall amounts in southeast Texas. If we took all of that rain and dumped it in the Great Lakes, it would raise the world's largest freshwater source significantly. The current estimate of total gallons of rain from Hurricane Harvey is 19 trillion. Ryan Maue if Weatherbell.com gives this estimate using doppler radar rainfall estimates. Maue looked at how much rain fell over the surface area affected by Hurrican Harvey. Some areas of Texas have tallied nearly 50 inches of rain. What if we took that 19 trillion gallons of water and dumped it in the Great Lakes? How much would the water levels go up in the Great Lakes.
(An overhead view of the flooding in Houston, from Buffalo Bayou on Memorial Drive and Allen Parkway, as heavy rains continue falling from Tropical Storm Harvey, Monday, Aug. 28, 2017. ( Karen Warren/Houston Chronicle via AP)(Karen Warren))

"Hurricane Harvey will cost $190bn: More than Sandy and Katrina"
The floodwaters may be receding in Houston, but the cost of Hurricane Harvey is likely to hit $190bn (£147bn), a weather forecaster has warned - greater than both Hurricanes Sandy and Katrina. Joel Myers, founder of AccuWeather, said the hurricane was the "costliest and worst natural disaster in American history", and added the disaster could even push back the Federal Reserve's next interest rate hike. "Business leaders and the Federal Reserve, major banks, insurance companies, etc should begin to factor in the negative impact this catastrophe will have on business, corporate earnings and employment," said Myers. "The disaster is just beginning in certain areas. Parts of Houston, the United States' fourth largest city, will be uninhabitable for weeks and possibly months due to water damage, mould, disease-ridden water and all that will follow this 1,000-year flood."
See more from Cityam HERE:
(Hurricane Harvey is expected to cost $190bn - Source: Getty via Cityam.com)
 ____________________________________________________________"Harvey is a 1,000-year flood event unprecedented in scale"
See more from Cityam HERE:
(Hurricane Harvey is expected to cost $190bn - Source: Getty via Cityam.com)
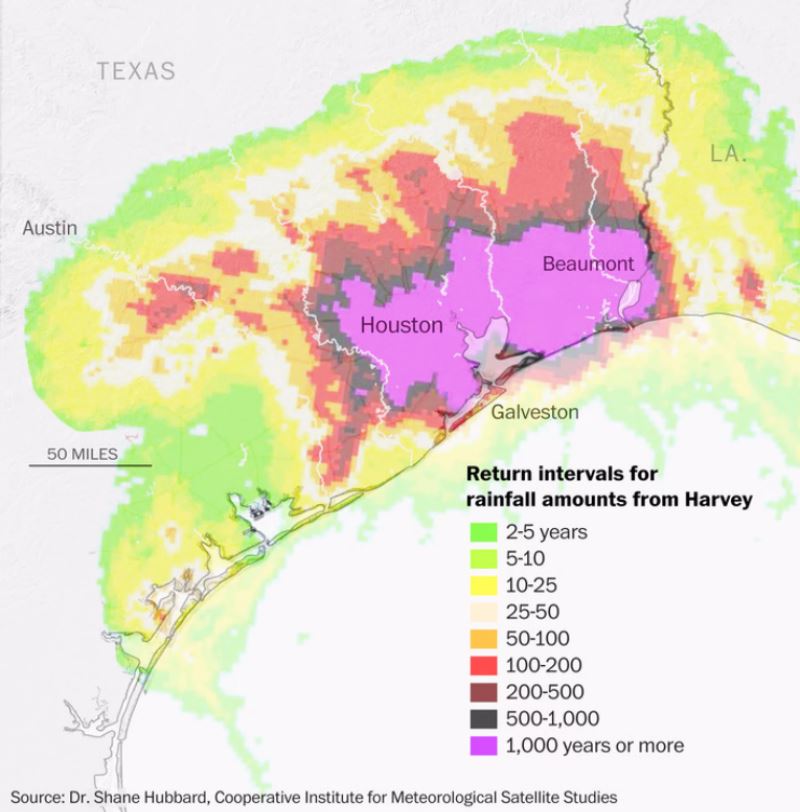
As Harvey’s rains unfolded, the intensity and scope of the disaster were so enormous that weather forecasters, first responders, the victims, everyone really, couldn’t believe their eyes. Now the data are bearing out what everyone suspected: This flood event is on an entirely different scale than what we’ve seen before in the United States. A new analysis from the University of Wisconsin’s Space Science and Engineering Center has determined that Harvey is a 1-in-1,000-year flood event that has overwhelmed an enormous section of Southeast Texas equivalent in size to New Jersey. There is nothing in the historical record that rivals this, according to Shane Hubbard, the Wisconsin researcher who made and mapped this calculation. “In looking at many of these events [in the United States], I’ve never seen anything of this magnitude or size,” he said. “This is something that hasn’t happened in our modern era of observations. ”Hubbard made additional calculations that accentuate the massive scale of the disaster:
**At least 20 inches of rain fell over an area (nearly 29,000 square miles) larger than 10 states, including **West Virginia and Maryland (by a factor of more than two).
At least 30 inches of rain fell over an area (more than 11,000 square miles) equivalent to Maryland’s size.
At least 30 inches of rain fell over an area (more than 11,000 square miles) equivalent to Maryland’s size.
________________________________________________________________________
"Harvey’s two-step across Texas: The peculiar meteorology behind a U.S. rain record"
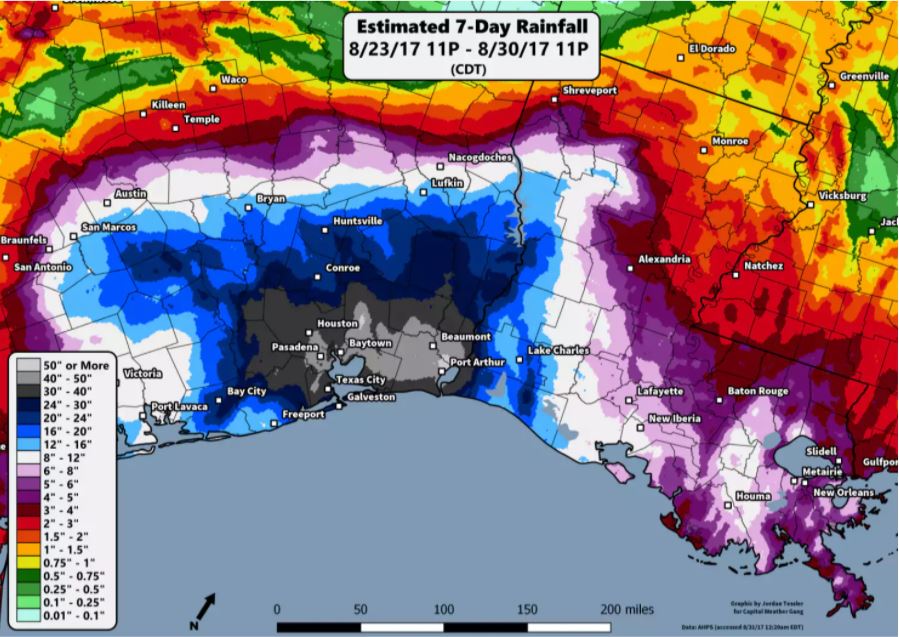
"Over the past few days, a staggering amount of water fell across Southeast Texas and Louisiana. All this water disgorged from one of the greatest meteorological events in U.S. history: an intense Category 4 hurricane named Harvey. This analysis attempts to explain how this extreme storm evolved — from landfall to eventual exit from Texas, with emphasis on the rain generation. The rain accumulation totals Our strategy here is to look at the behavior of this weather system day by day, from Aug. 25-30. But first, let’s examine a map of the preliminary rain amounts across the greater Texas region (above), over this multiday period from Aug. 23-30. These values are all subject to continued verification. The deepest water accumulations encompass Houston, Beaumont, Galveston, Pasadena and Port Arthur."
____________________________________________________________________
"Harvey's unusual lightning: We've never seen a hurricane in this way"
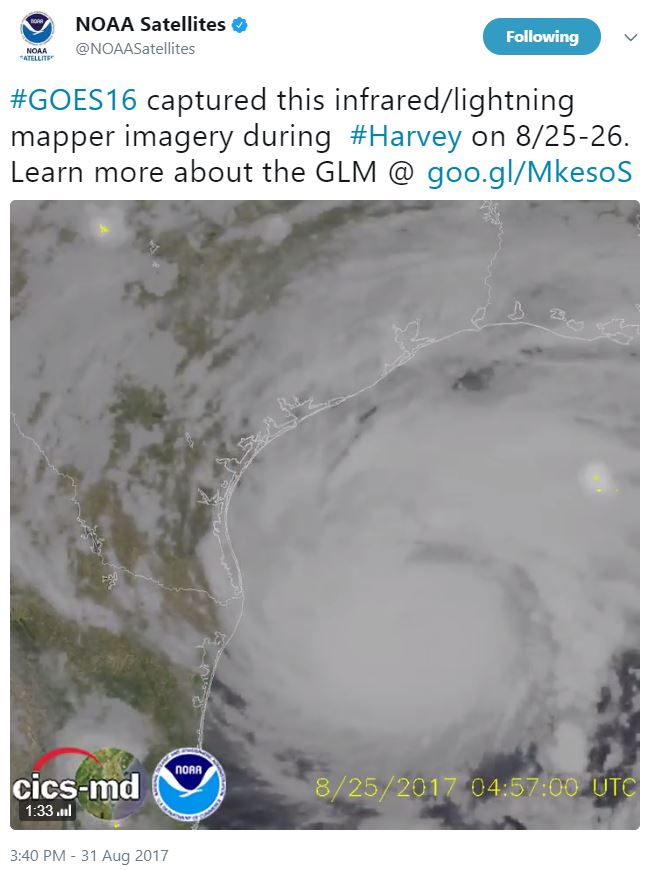
"When Hurricane Harvey approached the Texas coast for its first of two landfalls on Aug. 25, a new and advanced weather satellite watched its every move. The spacecraft, known as GOES-16, is still in an experimental phase, but the data it provides is available to National Weather Service (NWS) forecasters already. As meteorologists test out the capabilities of this new platform, which launched last year, they are revealing new insights on storm systems. With Harvey, the satellite's lightning mapper — which tracks lightning over land and out to sea, where current observations fall short — revealed something fascinating. Here's a video posted by the National Oceanic and Atmospheric Administration (NOAA), which operates the satellite, on Thursday. The yellow flashes represent lightning strikes, either cloud-to-ground discharges or cloud-to-cloud. As with most hurricanes, you'll notice that the most active area of lightning production is well away from the center of the storm. "
________________________________________________________________________
"Future Hurricanes Will Be Worse Than Harvey"
"Research on Superstorm Sandy yields grim projections about global warming and extreme weather in the decades to come. How powerful would Hurricane Harvey have been in 1880? How much stronger might it be in 2100? A single Hurricane Harvey has been more than anyone can bear. But to better prepare cities for future storms, researchers are preparing to re-watch Harvey thousands of times. They’ve already been studying earlier storms, and their conclusions don’t bode well for the decades to come. In the months and years after Superstorm Sandy’s 2012 assault on New Jersey and New York, Gary Lackmann, an atmospheric science professor at North Carolina State University, was asked how the event might be understood in light of human-driven global warming. He knew that the question everyone wants answered—did climate change cause the storm—wasn’t the right one. Hurricanes were around long before the industrial revolution. Two questions did, however, resonate:
How does climate change affect the frequency or intensity of huge storms?
What would the weather pattern that sustained Sandy have spawned in a cooler past or a hotter future?
What would the weather pattern that sustained Sandy have spawned in a cooler past or a hotter future?
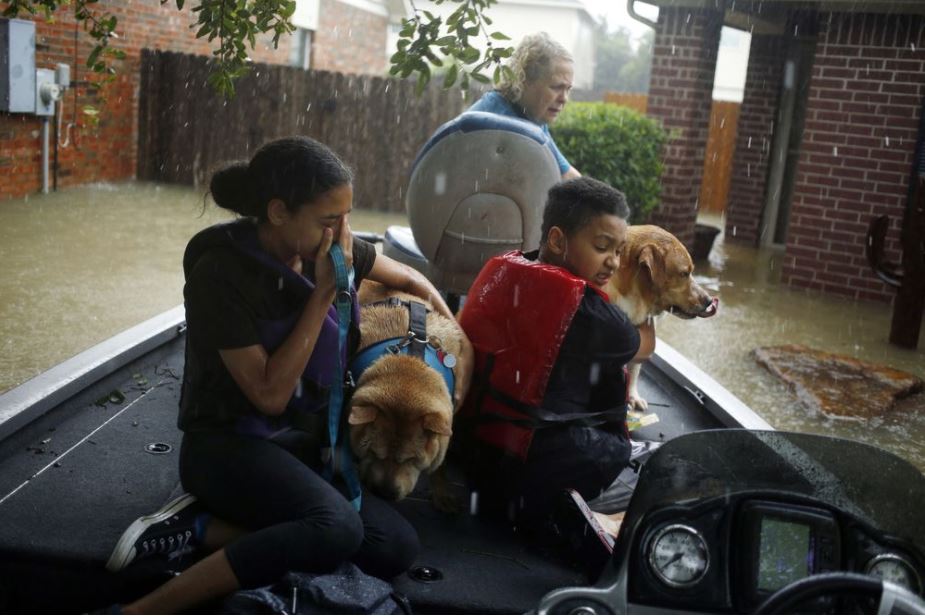
(A boy and girl hug their grandmothers' dogs after being rescued from rising floodwaters due to Hurricane Harvey in Spring, Texas, on Aug. 28, 2017. Photographer: Luke Sharrett/Bloomberg)
_______________________________________________________________________
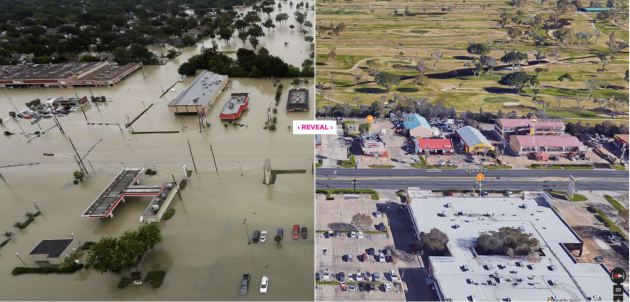
"Dramatic before and after photos show the scale and scope of Harvey's devastating floods"
The terms"catastrophic" and "unprecedented" have taken on a new, grim meaning for residents of Texas and Louisiana. Tropical Storm Harvey, which came ashore between Port Aransas and Port O'Connor, Texas, on August 25 as a hurricane, dumped so much rain on the Houston area that it is now considered the most extreme rainstorm on record to strike any U.S. city, dropping 50-inch-plus rainfall totals in some parts of the state. The rain overwhelmed the Houston metro area as well as Beaumont and Port Arthur, sending most rivers to record heights and trapping people in their homes. These images show the scale and impact of the flooding throughout the state.
 ________________________________________________________________________
Where and What Is Left of Harvey?
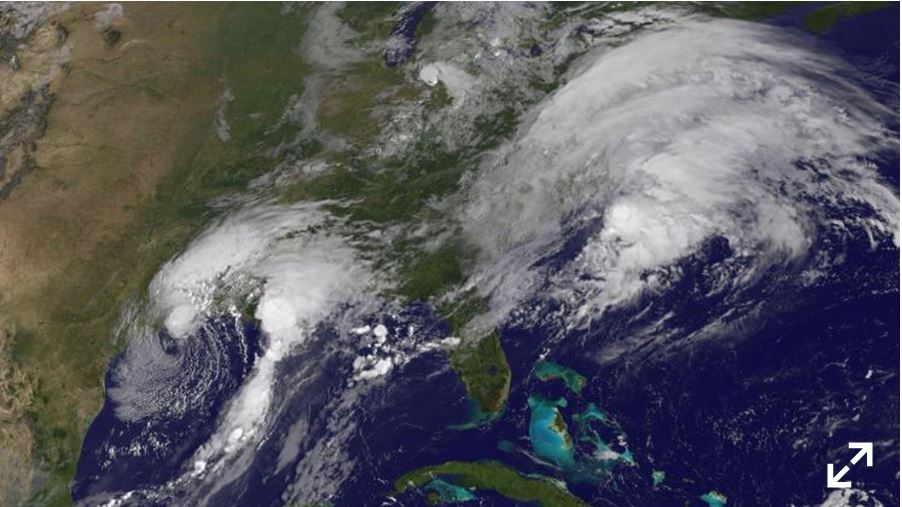
The left-overs of Harvey have thankfully started moving and are picking up speed. As of Saturday afternoon, the center of circulation was exiting Kentucky and heading into eastern Ohio with widespread rain and gusty winds. Here is the visible satellite image from early Friday which showed a fairly large storm system and cloud mass enveloping much of the Ohio and Tennessee Valley.

The remnants of Harvey will continue to lift northeast through the weekend with the last of rains ending in the Northeast late Sunday night/early Monday morning. As the remnants of the storm lift northeast, areas in the path of the storm should expect gusty winds and areas of heavy rainfall.

How Much Rain?
Here's a look at the rainfall potential through 7am Monday as the remnants of Harvey lift northeast through the weekend. Note that some areas could see as much as 1" to 2", which is fairly heavy rainfall, but considering that Harvey dumped more than 50" of rain across parts of Texas, that is hardly anything.

Next Up: IRMA in the Atlantic
No rest for the weary in the Atlantic Basin with another strong hurricane quickly developing on the heels of Harvey. Here's a look at IRMA in the central Atlantic, which as of Saturday afternoon was a category 2 hurricane with sustained winds of 110mph. The official track has this regaining major hurricane (category 3 or higher) status by the end of the weekend.

Here's the model intensity for IRMA, which shows the storm generally in the category 2 to category 4 range over the next several days. Note that a major hurricane is classified as a category 3 storm or higher. With that said, most of the models have this storm staying at major hurricane (category 3 or 4) status and staying there for a several day period. Stay tuned.
.png)
Tracking IRMA
Here's the latest from NOAA's National Hurricane Center, which shows IRMA quickly becoming a very strong hurricane as it drifts west toward the Windward Islands in the eastern Caribbean. A lot could change over the next several days, but folks in the path of this storm should pay attention to latest forecasts as this dangerous storm churns through the Atlantic.
.png)
Here are the latest spaghetti models for IRMA over the next several days. These are the ensemble models for both the American (GFS) model and the European (ECMWF) model. As you can see, most of the models take this storm just north of the Caribbean and north of the Bahamas. However, a few models take this storm toward the southern coast of Florida and perhaps even into the Gulf of Mexico; some even into the Northeast. Interestingly, *most* of the ECMWF models suggest that this storm steers east of the East Coast. Again, a lot could change over the next several days, so pay attention to the latest forecasts as this storms drifts west-northwest through the first half of September.


Here's the Atlantic overlook, which shows another wave of energy southeast of IRMA that has a HIGH chance of tropical development over the next 5 days. Stay tuned...
.png)
___________________________________________________________
Tracking LIDIA in the Eastern Pacific
LIDIA has been causing problems in the Eastern Pacific and across parts of Mexico. In fact, LIDIA hit Los Cabos, Mexico and has been responsible for flash flooding and at least 5 deaths.
.gif)
According to NOAA's NHC, LIDIA will weaken to a tropical depression through the weekend as it moves back into the Eastern Pacific. Note how close it will be to southern California, this should help to bring in high surf to those areas over the weekend and into early next week.

__________________________________________________________________________
PRELIMINARY 2017 Tornado Map
It certainly has been a fairly active first half of 2017 with 1321 preliminary tornado reports through September 1st. Note that this is the most tornadoes through September 1st since 2011, when there were 1,733 reports. The map below shows the distribution of the tornadoes so far this year.
.gif) PRELIMINARY 2017 Tornado Count
PRELIMINARY 2017 Tornado Count
According to NOAA's SPC, the PRELIMINARY 2017 tornado count is 1321 (through September 1st). Note that is the most active year for tornadoes since 2011, when there were 1,733 tornadoes. Keep in mind there was a major tornado outbreak in the Gulf Coast region from April 25-28, 2011 that spawned nearly 500 tornadoes, some of which were deadly. That outbreak is known as the Super Outbreak of 2011 and has gone down in history as one of the biggest, costliest and one of the deadliest tornado outbreaks in history.

_____________________________________________________________________
According to NOAA's SPC, the PRELIMINARY 2017 tornado count is 1321 (through September 1st). Note that is the most active year for tornadoes since 2011, when there were 1,733 tornadoes. Keep in mind there was a major tornado outbreak in the Gulf Coast region from April 25-28, 2011 that spawned nearly 500 tornadoes, some of which were deadly. That outbreak is known as the Super Outbreak of 2011 and has gone down in history as one of the biggest, costliest and one of the deadliest tornado outbreaks in history.
_____________________________________________________________________
2.) Flooding possible across portions of California and the Southwest.
3.) Flooding possible across portions of the Middle Mississippi Valley, the Lower Mississippi Valley, the Ohio Valley, and the Tennessee Valley.
4.) Flooding occurring or imminent across portions of the Lower Mississippi Valley, the Southern Plains, and Florida
5.) Much above normal temperatures across portions of the Central and Northern Great Basin, the Northern Plains, the Northern Rockies, California, and the Pacific Northwest, Mon-Fri, Sep 4-Sep 8.
6.) Heavy rain across portions of the Alaska Panhandle and southern mainland Alaska, Mon-Tue, Sep 4-Sep 5.
7.) High winds across portions of the Alaska Panhandle, southern mainland Alaska, and the Aleutians, Mon, Sep 4.
8.) High significant wave heights for coastal portions of mainland Alaska and the Aleutians, Mon-Tue, Sep 4-Sep 5.
9.) Slight risk of much above normal temperatures for portions of the Central Plains, the Central Great Basin, the Northern Plains, the Northern Rockies, the Central Rockies, California, the Northern Great Basin, the Upper Mississippi Valley, the Pacific Northwest, and the Southwest, Sat-Fri, Sep 9-Sep 15.
10.) Moderate risk of much above normal temperatures for portions of the Pacific Northwest, the Northern Rockies, the Northern Great Basin, and the Northern Plains, Sat-Mon, Sep 9-Sep 11.
11.) High risk of much above normal temperatures for portions of the Northern Rockies and the Northern Great Basin, Sat, Sep 9.
12.) Severe Drought across the Middle Mississippi Valley, California, the Northern Plains, the Northern Rockies, and Hawaii.
.png)
"‘History is being made’ Farmers, ranchers assess impact of North Dakota drought"
"Recent rains have helped green the land around Kim Entze’s ranch in western North Dakota, but he lamented that the relief didn’t come sooner. “A little earlier here … it was getting pretty depressing. People were starting to panic and didn’t know what to do,” he said, calling this year “by far the worst” drought he has seen in his 43 years of ranching. Many agree with Entze’s assessment that this year has been historically dry. The North Dakota Farmers Union earlier this month called the drought one of the worst the state has seen since the 1980s, while Tim Petry, a North Dakota State University extension livestock marketing economist, put it in the top five of the past 50 years. “It’s right up there, particularly in far western North Dakota,” he said. “History is being made.” The drought is also expected to have dire financial consequences. North Dakota Agriculture Commissioner Doug Goehring predicted Friday it will have a $4 billion to $5 billion overall economic impact on the state."
See more from Bismarck Tribune HERE:
(Kim Entze stands in a field at his ranch south of Golden Valley on Wednesday. John Hageman, Forum News Service)

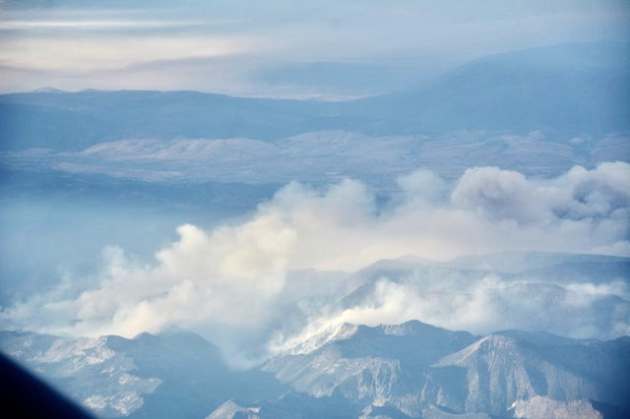
"The state’s governor declared a drought disaster across 20 counties while a National Weather Service official acknowledged a long-range forecast missed the mark. A WET WINTER in 2017 pulled most of the West out of a long and serious drought. But one state was left behind: Montana. Andy Fjeseth, a spokesperson for the Montana Department of Agriculture, said some officials are calling the drought a “100-year event” in the state. It has hit the eastern part of the state Particularly hard. Wheat and hay farmers have lost crops, he said, because normal spring rains never came. Many cattle ranchers have been forced to sell off their animals early or move them long distances to find decent grazing conditions. In May, Montana Gov. Steve Bullock declared a drought emergency across 20 counties in the eastern half of the state."
See more from Newsdeeply HERE:
(Smoke rises from the Lolo Peak fire in Montana as seen from an airplane on August 18, 2017. The wildfire has expanded to 28 thousand acres, prompting evacuations. The state has been hit with both wildfires and drought this year.CITIZENSIDE/Jay Cline)
Exceptional and Extreme drought conditions are in place over parts of Montana and North and South Dakota due to several days/week of hot and dry weather. The image below suggests how much rain would be needed to end the drought, which suggests nearly 6" to 12" or more!


EXCEPTIONAL Drought in Montana
According to the US Drought Monitor, nearly 25% of Montana is considered to be in an EXCEPTIONAL drought, while nearly 40% is in an EXTREME drought. Note that 3 months ago, only 33% was abnormally dry.

Critical Fire Weather Conditions Sunday
According to NOAA's SPC, CRITICAL fire weather conditions are in place across parts of the High Plains on Sunday. With hot, dry and breezy winds, wildfires could start and quickly get out of hand.

____________________________________________________________________
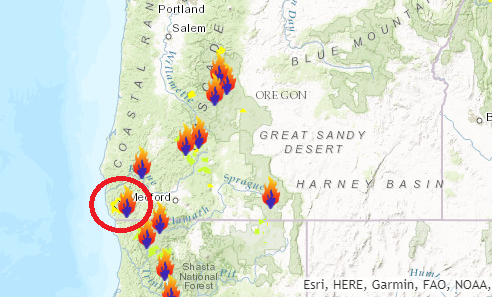
Chetco Bar Fire - 5 Miles Northeast of Brookings, OR
The Chetco Bar Fire in near Brookings, Oregon is a very large wildfire in the Western US that started on Wednesday, July 12th by lightning and has grown to more than 138,000 acres! There are more than 1,500 people working on this fire, which is only 10% contained. The estimated containment date is set for Sunday, October 15th.
See more from Inciweb HERE:


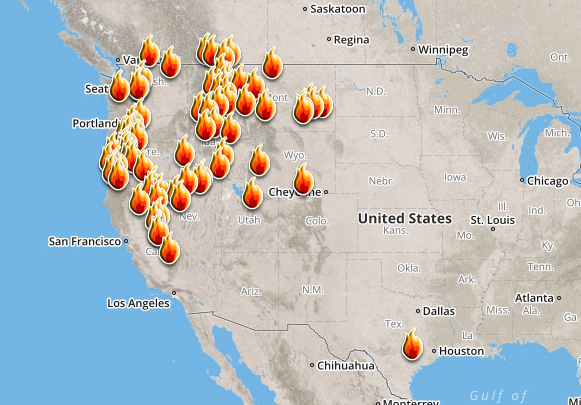
Here's a look at the current wildfire map across the country. Continued hot and dry weather has helped to spark several wildfires across the Western US. There have even been fires popping up in the Eastern U.S., two of the larger fires are burning in Florida.
Here's a list of all the current large wildfires from Inciweb:

The Chetco Bar Fire in near Brookings, Oregon is a very large wildfire in the Western US that started on Wednesday, July 12th by lightning and has grown to more than 138,000 acres! There are more than 1,500 people working on this fire, which is only 10% contained. The estimated containment date is set for Sunday, October 15th.
See more from Inciweb HERE:
Wildfire Smoke on Satellite
Here's a neat visible satellite loop from Saturday afternoon, which shows wildfire smoke across parts of the Northwestern US. You can actually see widespread smoke drifting slowly across northern California and southwestern Oregon, while several smoke plumes really seem to get going across parts of Idaho and Montana.
Ongoing Large Wildfires
Here's a list of all the current large wildfires from Inciweb:
National Smoke Analysis
Here's the projected wildfire smoke concentration for midday Sunday, which suggests that smoke from wildfires burning across parts of Western Canada and the Western US could continue to linger around the Northwest, Midwest and the Great Lakes Region. There also appears a very high concentration of smoke from fires burning across the Central Canada near the Hudson Bay. If you are in these areas, air quality could be a little poor, but these areas may also be enjoying very interesting looking sunrises/sunsets, which tend to look hazy or reddish-orange.
_________________________________________________________________________
National Weather Outlook
Here's the weather outlook through the middle of next week, which shows somewhat active weather conditions across parts of the central and eastern US. Scattered showers and storms will continue with the remnants of Harvey as it lifts northeast through Sunday. There will be a bit of a break before another front slides through the eastern half of the country during the first half of the week. Also note that IRMA is starting to show up on longer-range models.
.gif)
Severe Threats: Sunday & Monday
According to NOAA's SPC, there is just a general thunderstorm risk across a parts of the country, but a MARGINAL risk has been issued for Sunday across parts of the Great Lakes and the Ohio Valley.


Excessive Rainfall Potential Sunday & Monday
According to NOAA's WPC, there is a MARGINAL risk of excessive rain on Sunday as the remnants of Harvey lift northeast through the northeastern part of the country. The good news is that the rainfall will be nothing like it was over the past couple of days as the storm system is starting to pick up speed. A more rapid pace to the storm system should help to limit rainfall tallies. A MARGINAL risk of excessive rainfall has also been issued on Monday from the Central US to the Eastern Great Lakes as a cool front sweeps across the region.
.gif)
.gif)
________________________________________________________________________
Hottest Day at the Fair Sunday. Concerns about Irma
By Todd Nelson, filling in for Douglas.After a cooler and wetter than average August, we've emerged into very summerlike start to September. Fairgoers really haven't had much to complain about weatherwise as temperatures haven't been all that hot. In fact, it's actually been a little cooler than average with highs mainly in the 70s. Sunday will be the hottest day for the Great Minnesota Sweat-Together as highs approach the mid to upper 80s under sunny skies. Take that on a stick!
Sunny skies have returned to southeast Texas, but incredible flood waters remain from what will be one of the costliest hurricanes to have ever hit the U.S.. Early estimates suggest nearly 100 billion dollars in damages, which will take months and years to fix.
Meanwhile, Hurricane Irma continues to churn through the Atlantic. Latest forecast models suggest that this storm will steer north of the Caribbean, but could make a close encounter with the East Coast by next weekend. Still too early to tell, but I am getting concerned.
Enjoy the 80s today, it'll feel like Fall on Tuesday. Brr!
________________________________________________________________________
Extended Forecast
SUNDAY: Mostly sunny and mild. Lake-worthy. Winds: WSW 5-10. High: 86
SUNDAY NIGHT: Mostly clear and quiet. Winds: SSW 10-15. Low: 63
MONDAY: A few PM showers? Turning cooler. Winds: NW 10-15. High: 75.
TUESDAY: Back to school. Feels like Fall with an afternoon sprinkle Winds: NNW 7-12. Wake-up: 53. High: 65.
WEDNESDAY: Still chilly. Passing clouds. Winds: N 5-10. Wake-up: 49. High: 65.
THURSDAY: More sun. A little warmer. Winds: WSW 5. Wake-up: 51. High: 70.
FRIDAY:Mostly sunny, feeling better. Winds: S 5. Wake-up: 54. High: 72.
SATURDAY: Mild sunshine. Winds: SE 5. Wake-up: 52. High: 75.
_______________________________________________________
_______________________________________________________
This Day in Weather History
September 3rd
September 3rd
1989: An early afternoon thunderstorm dropped 1 3/4 inch hail in Stearns and Morrison Counties.
1980: An F2 tornado results in $2.5 million in property damage, followed by an F3 tornado causing $25 million in damages in Stearns County.
1970: The record-setting hailstone fell that made Coffeyville, KS famous. It had a circumference of 17.5 inches and weighed 1.67 pounds.
1917: An earthquake is felt from Staples to Brainerd.
________________________________________________________
________________________________________________________
Average High/Low for Minneapolis
September 3rd
September 3rd
Average High: 77F (Record: 97F set in 1925)
Average Low: 58F (Record: 32F set in 1974)
Average Low: 58F (Record: 32F set in 1974)
Record Rainfall: 1.08" set in 1887
_________________________________________________________
_________________________________________________________
Sunrise/Sunset Times for Minneapolis
September 3rd
September 3rd
Sunrise: 6:38am
Sunset: 7:46pm
Sunset: 7:46pm
Hours of Daylight: 13hours & 08mins
Daylight LOST since yesterday: ~3 minutes and 1 seconds
Daylight LOST since summer solstice (June 20th): ~2 hours & 30 minutes
__________________________________________________________
Daylight LOST since summer solstice (June 20th): ~2 hours & 30 minutes
__________________________________________________________
Moon Phase for September 2nd at Midnight
3.0 Days Before Full "Corn" Moon
3.0 Days Before Full "Corn" Moon
Sept. 6, 3:03 a.m. EDT – Full Corn Moon.This moon is also sometimes called the Barley Moon, in those years when the September full moon comes during the opening days of the month — an artifice that was used to keep the Harvest Moon from coming too early.

_________________________
Weather Outlook For Sunday
Sunday will be the warmest day of the MN State Fair this year as highs climb 80s across much of the state. There could even be a few low 90s that develop in far western Minnesota. Note the high in Pierre, SD could reach the triple digits! The good news is that dewpoints won't be too high, so it won't feel too bad.

Weather Outlook For Sunday
Winds will pick up a bit through the day Sunday ahead of a cool front that will move through on Monday. Note that some spots in far western and northwestern Minnesota could see winds gusting up to near 20mph or more by the afternoon.

Sunday will be a very warm and sunny day across the region. Enjoy it because readings will drop to more Fall-like levels as we head into the next few days.

The UV Index for Sunday will be HIGH, which means that it will only 20 to 30 minutes or less to burn unprotected skin. With that said, if you are planning on spending any extended length of time outside, make sure you wear appropriate attire and lather on the sun block!
 __________________________________________________________________________
Thunderstorm Threat and Sunday & Monday
According to NOAA's SPC, there is a general thunderstorm risk across parts of the state on Sunday and Monday, mainly across far northern Minnesota. While the threat for widespread thunderstorm activity is not expected, a few locations could hear a few rumbles through the rest of the Labor Day weekend.
.png)
.png)
Simulated Radar Ahead...
Here's the simulated radar from Sunday to Monday, which shows a few showers and perhaps a few rumbles of thunder moving across the northern part of the state PM Sunday. A cool front moving across the state on Monday may help to produce a few more isolated showers PM Monday.

Rainfall Potential Ahead
.png)
_________________________________________________________
The rainfall forecast through midday Tuesday shows a better chance of rainfall across the northeastern part of the state, where some 0.25"+ tallies maybe possible.
_________________________________________________________
Somewhat Smoky Skies on Sunday...

Here's a look at the vertical smoke integration midday Sunday, which suggests smoky skies across much of Minnesota and the Dakotas once again. A west to northwest flow aloft will continue to carry smoke from wildfires burning across the Western US and Canada.
August 2017 - 11th Wettest in Minnesota State History
It was a pretty wet month of August with the Twin Cities seeing 6.75" of rain! That is 2.45" above average for the month! Note that some locations in western Minnesota saw nearly 10" to 12"+ with Redwood seeing the most at 12" of rain! Here's an excerpt from Mark Seeley's Weather Talk, which suggests that Minnesota had it's 11th wettest August in state history!
The most noteworthy climate attribute of August was the rainfall. Overall the statewide average rainfall was over 5 inches, ranking as the 11th wettest month of August in state history. Some western and southern communities reported their wettest August in history with total rainfall values over 10 inches. Redwood Falls topped the state network reports with over 13 inches. They reported the largest ever 1-day rainfall on August 17th in state history with a measurement of 8.12 inches. In addition over 40 climate stations in the state reported at least one new daily rainfall record during the month.
.png)
Precipitation Year to Date
Here's a look at how much precipitation we've seen so far this year. Note that precipitation amounts are quite a bit higher as you go east into Wisconsin, while precipitation amounts fall considerably as you head west into the Dakotas. The Twin Cities has seen 25.65" of precipitation this year, which is 3.48" above average. La Crosse, WI has seen 31.76" of precipitation this year, which is 7.80" above average! However, Fargo, ND has seen only 10.50" of precipitation this year, which is -5.56" below average, while Minot, ND has seen only 5.33" of precipitation this year, which is 8.11" below average!
.png)
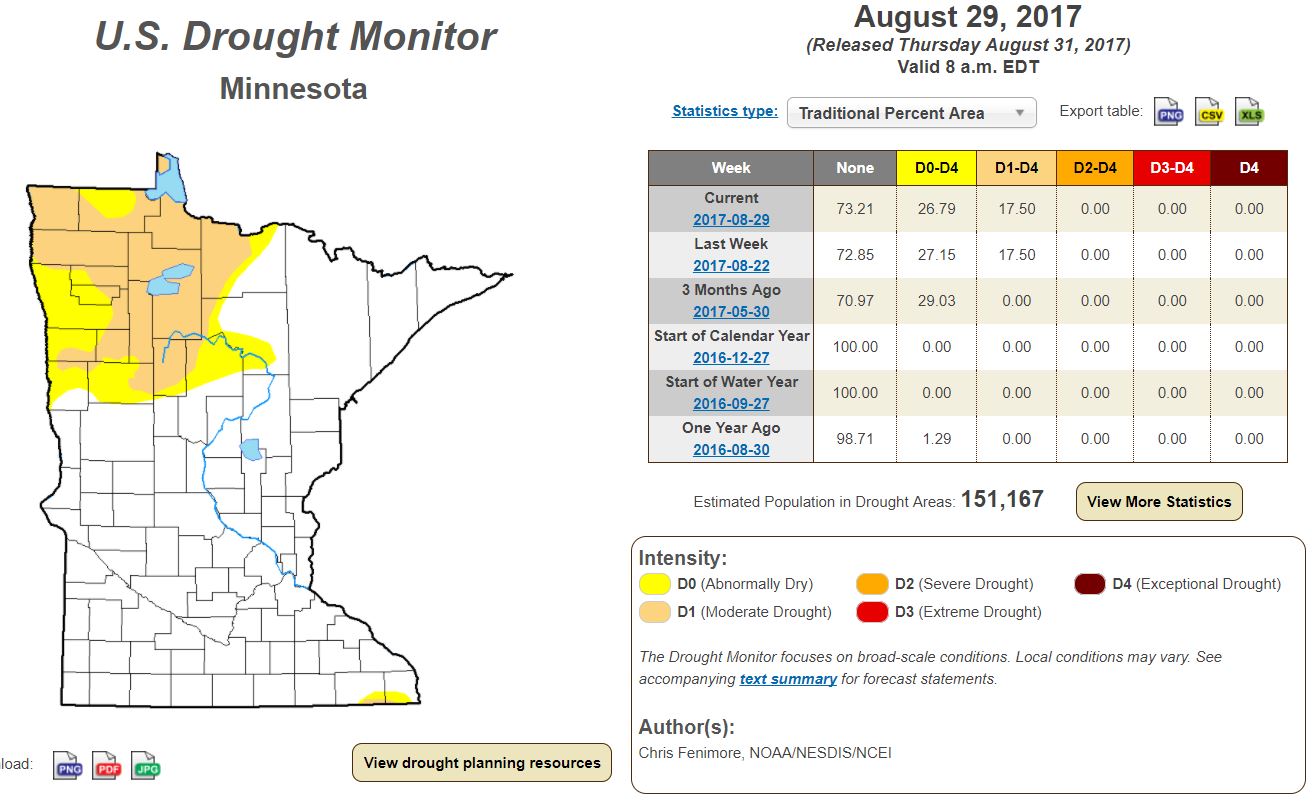
While much of the state saw appreciative rainfall during the month of August and so far this year, parts of western and northwestern Minnesota are dealing with moderate drought and abnormally dry conditions. According to the US Drought Monitor, 17.5% of the state is considered to be in a moderate drought. Note 26.8% of the state is considered to be abnormally dry, while last week 27.2% was abnormally dry last week.
______________________________________________________
Pollen Forecast
Itchy, sneezy? I tend to get a little more allergic to fall and I notice it more and more around State Fair time, which then finally starts to fade as the first frosts of the season start to arrive. With that said, according to pollen.com, the allergy forecast for Minneapolis suggests high to high to medium-high levels over the next few days. AHHH-CHOOO!!!

____________________________________________________________________________
Minneapolis Temperature Outlook
Here's the temperature outlook through September 17th, which shows temps warming into the 80s on Sunday, but will fall nearly 20 degrees or more by Tuesday and Wednesday in the wake of a cool front. Temperatures will gradually warm back into the 70s by the end of the week/weekend ahead, but it appears that temps will remain slightly below average through mid-month.

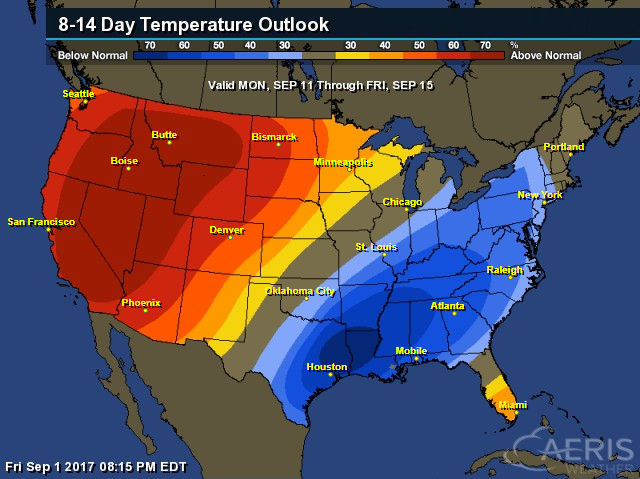
6 to 14 Day Temperature Outlook
According to NOAA's CPC, the extended temperature outlook from September 11th through the 15th suggests warmer than average temperatures settling back in across much of the Midwest and High Plains with the cooler air lingering across the Ohio Valley.

___________________________________________________________
Extended Temperature Outlook
According to NOAA's CPC, the extended temperature outlook through September 15th shows that a good chunk of the Eastern and Southern U.S. will be cooler than average, but the Western US will remain above average.
Extended Temperature Outlook
Here's the extended 850mb temperature anomaly loop into the middle part of September. This describes how warm or cold (from average) mid/low level temperatures will be over time. Note that the cooler blues moving back in across much of the Central US as we head into next week, while the warmer reds/oranges look to continue across the Western US.
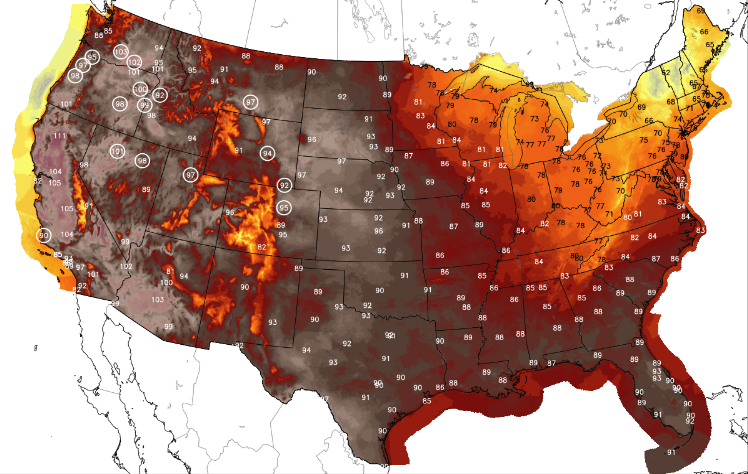
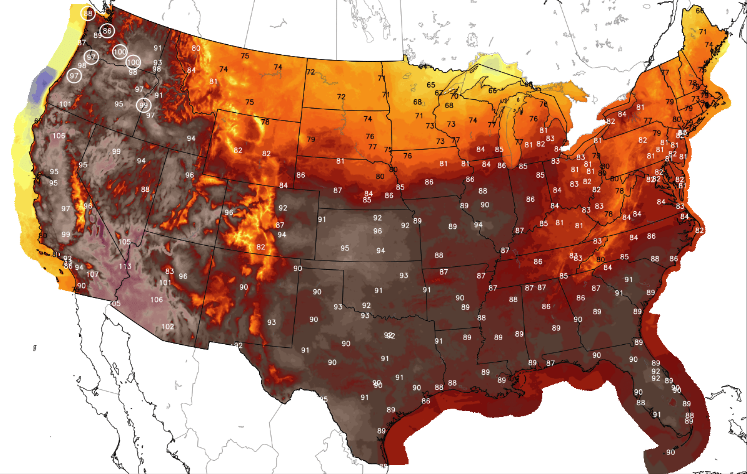
Record Highs in the Western US
With temperatures running nearly 10F to 20F+ over the next several days, there could be a number of record highs that follow. Here's the forecast record highs for Sunday and Monday. Note that a few records could be found from parts of California to as far north as Oregon!
__________________________________________________________-
Weather Outlook Ahead
The weather outlook over the next couple of days shows somewhat unsettled continuing in the Eastern and Northeastern US as the remnants of Harvey lift northeast through the weekend. A bubble of high pressure will then take over across a good chunk of the Eastern half of the country before another cool front arrives early next week. Meanwhile, spotty showers and storms will be found in the Desert Southwest as a little moisture from LIDIA clips the region.
.gif)
5 Day Precipitation Outlook
According to NOAA's WPC, the next several days could produce areas of locally heavy rainfall across parts of the Eastern and Northeastern US as the remnants of Harvey push through the area this weekend. There also appears to be lingering heavy rainfall potential across the Gulf Coast and Florida with some 1" to 2" possible. Also note the heavy rain south of California as LIDIA scrapes across the Baja California Peninsula. Meanwhile, much of the western and northwestern parts of the country will remain hot and dry!
.gif) ___________________________________________________________________
___________________________________________________________________
"Chronic Wasting Disease management - Mandatory testing in four areas scheduled this fall"
"The discovery of deer infected with CWD that were raised in captivity on farms in Crow Wing and Meeker counties means that wild deer harvested from permit areas surrounding those farms will be tested for CWD this fall during the first two days of the firearms deer season. Wild deer in these areas are not known to have CWD. Testing should determine if any are infected. Testing also will be done in permit areas surrounding the disease management zone in southeastern Minnesota. Deer harvested in southeastern Minnesota within that disease management zone – deer permit area 603 – will continue to be tested and carcass movement restricted."

_______________________________________________________
"Hunters should note errors in printed hunting regulations handbook and map"
"Hunters should be aware of several errors in printed copies of the 2017 Minnesota Hunting and Trapping Regulations Handbook and in the fold-out deer season map that accompanies the regulations booklet."

"Catastrophic storms, once rare, are almost routine. Is climate change to blame?"
"While climate change did not cause Hurricane Harvey, it could explain the intensity of this tropical cyclone as well as other catastrophic storms that have hit the United States in recent years, experts say. Harvey is the latest in little over a decade of “500-year” and “100-year” floods that once were considered rare. The storm, a Category 4 hurricane when it initially made landfall last week, has dumped trillions of gallons of water onto southeastern Texas, submerged houses and freeways, driven Houston-area residents from their homes and resulted in more than 20 deaths. Climate change won’t mean more storms overall — but it probably will mean that that biggest storms become even bigger, scientists say. For example, rising ocean temperatures could be making storms like Harvey bigger than they would be otherwise, said Michael Mann, a climate scientist at Pennsylvania State University. That’s because as the ocean’s surface temperature rises, the atmosphere’s ability to hold moisture goes up."
"Hurricane Harvey is seen Tuesday from a National Oceanic and Atmospheric Administration satellite. (Agence France-Presse / NOAA-NASA)"
____________________________________________________________
"Scientists Are Running Out of Space for Climate Data"
"Climate models produce incredible amounts of data. Soon, scientists may have to give some of it up. Climate science has gotten big. Debates about the research, its implications and the need for corrective action erupt everywhere from Middle American dinner tables to Capitol Hill and the bowels of social media. But climate science has gotten big in another sense, too -- one of sheer data volume. Mathematical models of Earth's climate are producing so much data that scientists may soon be forced to give some of it up. When it comes to understanding Earth's climate, the actual measurements of things like rainfall and temperature, even when built up over the course of decades, can only get you so far. To predict hypothetical scenarios and tease out what's causing what, scientists use computer programs that simulate the complex forces at work. By "seeding" these models with conditions on a given day and then watching how they play out over years or centuries, scientists can conduct virtual experiments that would be impossible in real life. "A climate model is really like a virtual laboratory," said Allison Baker, a computational scientist at the National Center for Atmospheric Research in Boulder, Colorado. "You can ask 'what if' questions, like 'what if the Arctic ice all melts?'""
____________________________________________________________________
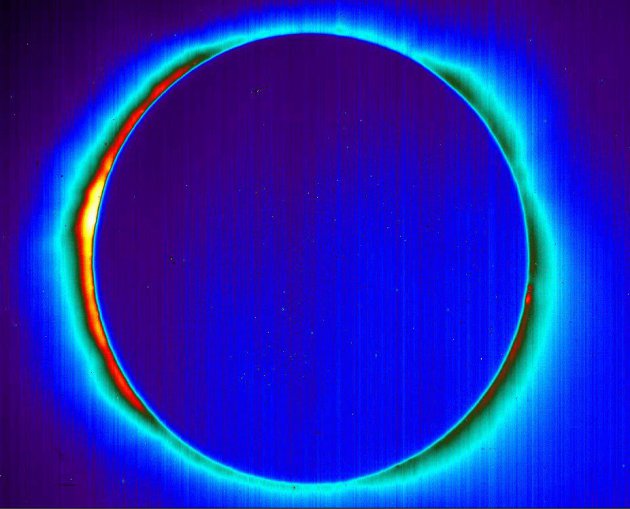
"NASA Just Released This Absolutely Breathtaking Image of The Solar Eclipse in Infrared"
"While millions across the continental US turned their eclipse glasses to the sky to watch the Sun disappear behind the Moon last Monday, NASA scientists took to the skies to get a much broader view of the event. They've now released a few of their images taken from 15,240 metres (50,000 feet), including a spectacular infrared view of the eclipse in totality, and our limited human eyes aren't worthy of the view. Not only are these some of the most spectacular images you'll see of the eclipse, but they're also giving scientists a rare opportunity to study the surface temperature of Mercury, as well as probe the Sun's mysterious outer atmosphere. This is the eclipse at the moment of totality in infrared:"
______________________________________________________________
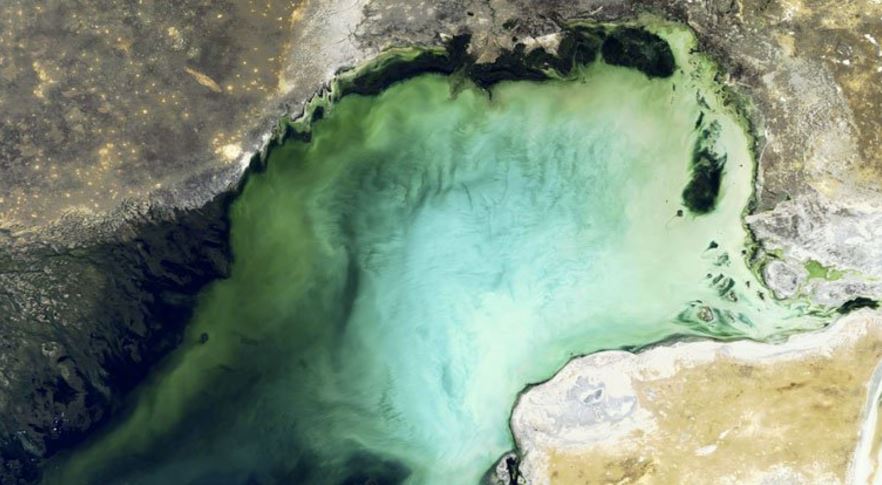
"We Finally Know Why The Caspian Sea Is Evaporating Off The Face of The Planet"
"Like a puddle under hot sunshine, the world's largest inland body of water is shrinking in the face of heat – in this case, a scorching climate the modern world has never before seen. The Caspian Sea, which lies between Europe and Asia, has been slowly evaporating over the past two decades due to rising temperatures associated with climate change, a new study shows. According to an analysis led by researchers from the University of Texas at Austin, the Caspian Sea is dropping almost 7 centimetres (2.8 inches) in its water level each year, and has been ever since 1996. If that descent continues, it won't take too long before this landlocked mega lake – bordered by Russia, Kazakhstan, Iran, Azerbaijan, and Turkmenistan – falls below its historic low set in the 1970s."
_________________________________________________________________________
Thanks for checking in and don't forget to follow me on Twitter @TNelsonWX

No comments:
Post a Comment