*
Japan earthquake now upgraded to a 9.0 on the Richter Scale. Details
here.
* “This magnitude places the earthquake as the fourth largest in the world since 1900 and the largest in Japan since modern instrumental recordings began 130 years ago." source: USGS
* Death toll likely to rise into the tens of thousands.
*
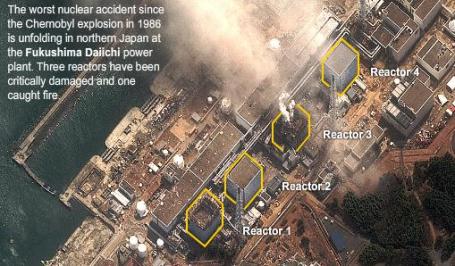
Worse than a nuclear meltdown?
* Japan faces potential
nuclear disaster as radiation levels rise. (New York Times)
_________________________________________________________________
*
Flood threat accelerates with rapidly warming temperatures this week - temperatures may stay above 32 F. from Wednesday morning through at least Monday of next week.
* "
One inch of rain anytime from here on out will be problematic." Dan Luna, Meteorologist in Charge of the Chanhassen National Weather Service office in an e-mail Monday evening.
* Highs approach or top 50 as early as Wednesday, some mid 50s possible late week, again Sunday.
* Light, showery rains possible Thursday & Friday; heavier rain possible Sunday, as much as .25-.50" rain may fall.
*
Peak flood potential (on major rivers): first half of April, but precise timing is impossible to pin down. Ultimate flooding will depend on daytime highs, whether nighttime lows stay above freezing, and the exact amount of rain we receive over the next few weeks. Residents living near Minnesota's streams and rivers should stay alert.
*
Some smaller streams and rivers may approach flood stage as early as next week.
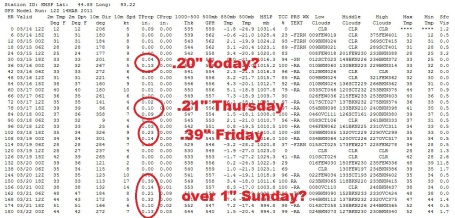
* Showery and mild weather lingers through March 26, turning colder (and drier) the last few days of March.
Cause For Concern? The GFS has been (wildly) overestimating precipitation amounts for the last 2 weeks - and I hope that's the case this time around. Models predict light showers today, heavier showers Thursday and Friday. We get a break on Saturday, and then a (potentially) significant southern storm pushes in on Sunday, with a potential for .50 to 1" of rain. If (and it's a huge if) we do pick up an inch of rain between now and Sunday evening, the risk of (severe to extreme) flooding will increase significantly. With frozen (waterlogged) ground melting snow will almost immediately run off into streams and rivers.
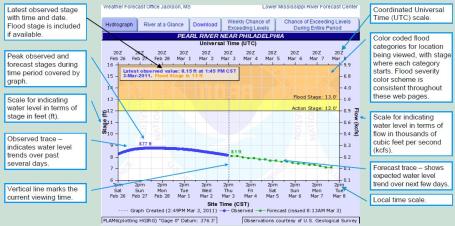
Hydrograph. The National Weather Service has a good
explanation of theiir hydrograph product - which tracks impending flood levels for select towns along rivers: "
The hydrograph is the first graphic displayed after clicking on a specific river or stream location on the Hydrologic Service Area (HSA) Map. It provides recent observations for many points and a forecast for the next few days. Tabs at the top of the hydrograph allow a user to display other graphical information for the river/steam location."
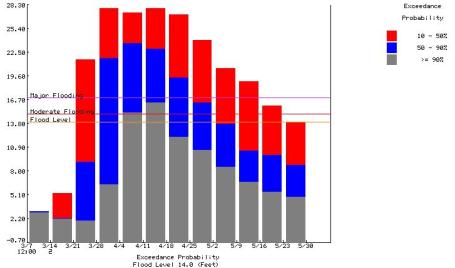
Probability Of Major Flooding In St. Paul. This National Weather Service
product shows the 1 week chances of exceeding river levels on the Mississippi River in St. Paul. The greatest potential for flooding comes during the first half of April. There is a 40-50% risk that flooding in St. Paul will exceed the high-water marks set in 1965. During an average spring that probability is closer to 3%.
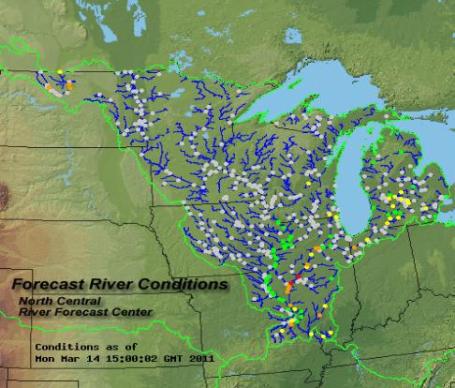
Spring Flood Monitor. The local NWS office in Chanhassen is ratcheting up coverage of the impending flood situation across the Upper Midwest. Click
here to see a good overview. Although we don't expect any problems this week, some streams and smaller rivers may approach flood stage by next week, especially if we do pick up significant rain over the weekend.
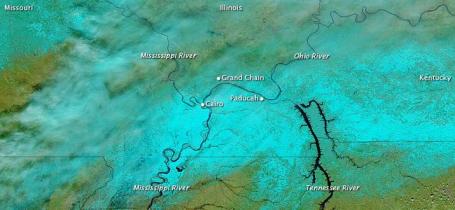
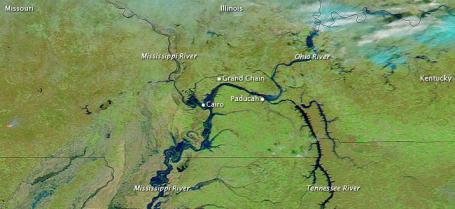
Flooding On The Ohio River. NASA's Earth Observatory shows a stark difference between low-orbit photos taken February 12 (top) and March 12 (bottom). Click
here to see a full-screen image.
Extreme Weather - Missouri snow amounts on Monday (courtesy of Earth Networks):
Columbia, MO airport - - 5 inches of heavy wet snow
Sedalia MO - Whiteman AFB - - 3 inches of wet snow
Kansas City MO - WFO - 3 inches of snow
St. Louis, MO airport - - 2 inches of wet snow
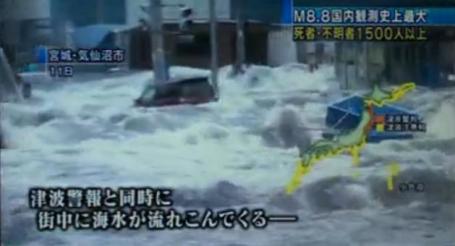
Scariest First-Person Video Of The Tsunami Yet? Check out
this clip from Gizmodo video clip. Not sure how this guy kept filming, especially with the increasingly dire shouts coming from the public loudspeaker. Absolutely amazing "
This first-person view is the most terrifying and astonishing video I've seen of the Japan tsunami. Initially everything seems ok, just a mild wave coming towards the camera. But keep watching. By the end of it, the raging water is taking entire buildings off the streets of Kesennuma, in the Miyagi Prefecture, Japan. This is the exact point where this video was taken, before the catastrophe."
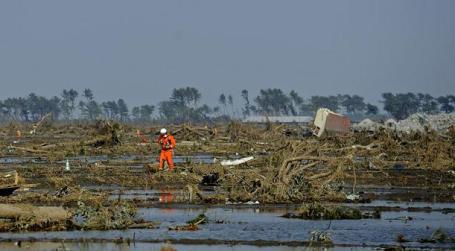
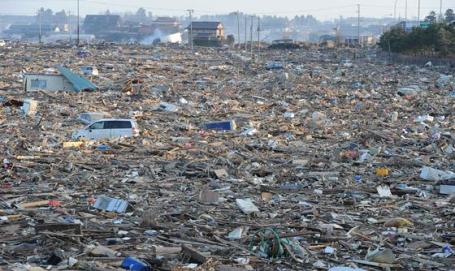
Horror Movie Come To Life. The photos are beyond imagination, your worst dream become reality. USA Today has a
slideshow that captures the devastation and heartache - something beyond our comprehension.
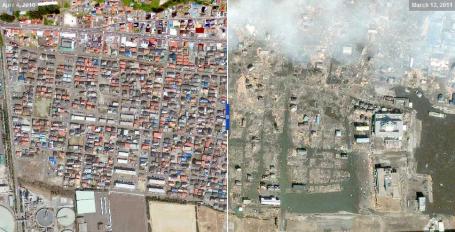
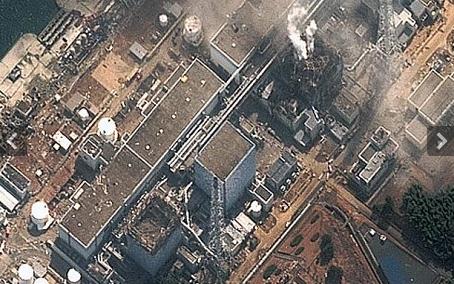
Satellite Photos of Japan, Before And After The Quake And Tsunami. The New York Times has a
link showing before and after photos of various locations around northern Japan. After you click on the link move the slider to compare satellite images, taken by GeoEye, from before and after the disaster.
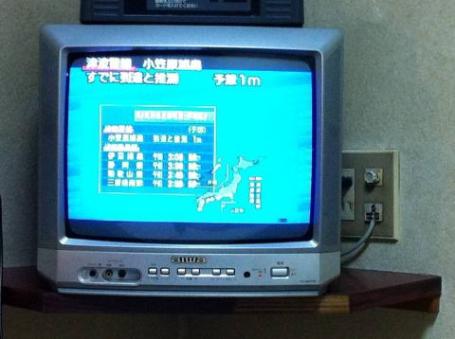
Quake Warning System Alerted Tokyo. No other country has done a better job, or invested more money to keep it's population up to date on impending earthquakes and tsunamis than Japan. Warning time for the quake itself ranged from a few seconds to as much as 2 minutes, many coastal towns received a 7-9 minute advance warning of the approaching 20-30 foot tsunami. The Wall Street Journal has more
details: "
As the 8.9-magnitude earthquake struck Japan's northeastern coast, the world's first early warning system—developed by the country's meteorological agency—detected the quake's shock wave near the seismic center and sent off the warning message, which appeared on national television and radio as well as cellphone screens.In Tokyo, because of its distance from northern Japan, the warning message reached people before the quake actually jolted the capital. When an earthquake occurs, seismometers near its source detect the first shock wave, which is usually mild and harmless. This wave is followed by another wave that travels more slowly and is much stronger and potentially destructive. The agency's computer system analyzes the first, faster-traveling wave and quickly estimates how powerful the second wave will be; if it is likely to be very powerful, the system immediately issues a warning message. The message comes on TV and radio, and many Japanese cellphones can receive and display the message. Some power and gas facilities as well as railway and industrial systems automatically halt their operations."
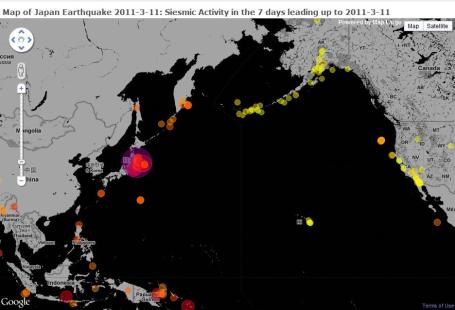
Seismic Activity In The 7 Days Leading Up To Japan's 8.9 Catastrophe. Click
here to see this map full-screen, courtesy of maplarge.com.
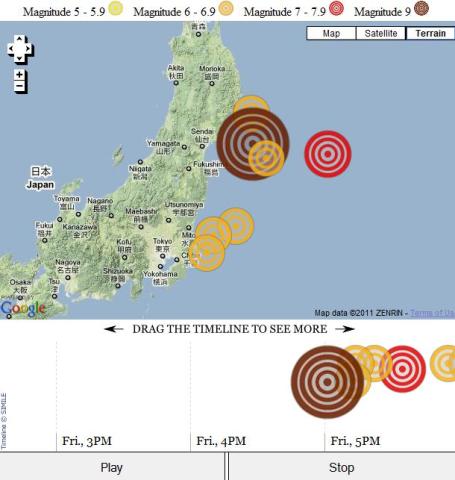
Shaking Before And After Japan's Great Quake. There was a flurry of quakes leading up to the massive 8.9 tremor on Friday, and hundreds of subsequent aftershocks. An interactive
graphic from the L.A. Times: "
The magnitude 8.9 earthquake that rocked Japan on March 11 at 2:46 p.m. struck after a series of smaller quakes earlier in the week. Aftershocks — as many as 12 to 15 an hour — now total in the hundreds, including more than 30 of magnitude 6 or greater. Play the timeline map below to see quakes magnitude 5 and greater before and after the strongest temblor to strike Japan in 140 years. The timeline begins two days before the great quake, when a magnitude 7.2 earthquake hit off the coast shortly before noon March 9. All times are Japan Standard."
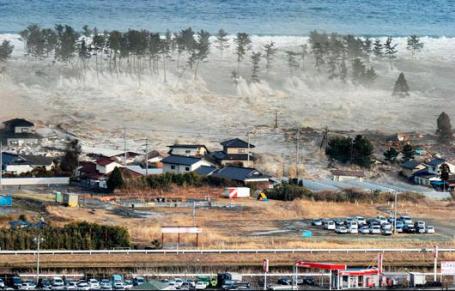
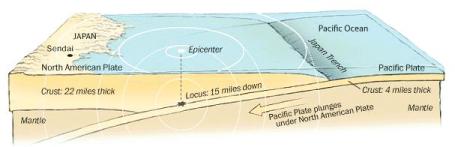
Anatomy Of An Earthquake. The Washington Post has an excellent
explainer graphic and interactive map showing the geological forces that precipitated last week's 8.9 quake, one of the 10 largest ever observed worldwide: "
As huge tectonic plates in the earth's surface constantly grind against each other, jagged edges often lock together until pressure builds enough to jar them apart. On Friday, a chunk of the Pacific plate, which normally creeps westward under Japan at about three inches per year, practically leaped forward — up to 59 feet, according to USGS modeling. This quick jolt thrust undersea land upward, causing the earthquake and tsunami."
Third Explosion Raises Specter of Nuclear Nightmare. Just when you thought things couldn't get any worse. The problem: Japan's coastal nuclear reactors were built to withstand earthquakes and tsunamis, just not a 9.0 quake and 25-30 foot tsunami powerful enough to extend as far as 6-10 miles inland. Some of the fuel rods were (apparently) uncovered for several hours, leading to some degree of melting of the reactor core. Radioactive particles are now being observed outside the plant, the steam released from the plant(s) getting dirtier and dirtier. An update from the U.K.'s Telegraph: "
Government officials admitted that it was “highly likely” the fuel rods in three separate reactors had started to melt despite repeated efforts to cool them with sea water. Safety officials said they could not rule out a full meltdown as workers struggled to keep temperatures under control in the cores of the reactors. The Fukushima crisis now rates as a more serious accident than the partial meltdown at Three Mile Island in the US in 1979, and is second only to the 1986 Chernobyl disaster, according to the French nuclear safety authority. After insisting for three days that the situation was under control, Japan urgently appealed to US and UN nuclear experts for technical help on preventing white-hot fuel rods melting. The International Atomic Energy Agency (IAEA) said it was “unlikely” that the accident would turn into another Chernobyl, but failed to rule it out completely. More than 500,000 people are thought to have been made homeless by Friday’s earthquake and tsunami, which is estimated to have killed at least 10,000. More than 2,000 bodies have been washed up on beaches along Japan’s Pacific coast, but rescuers have yet to reach isolated towns and villages in some of the worst-affected areas."
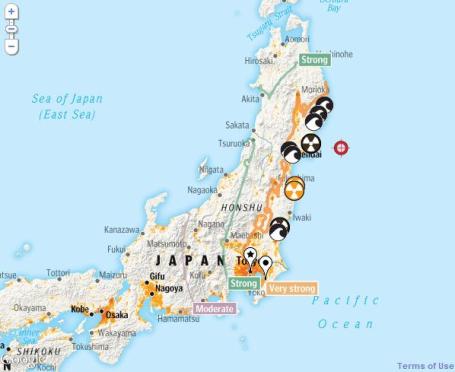
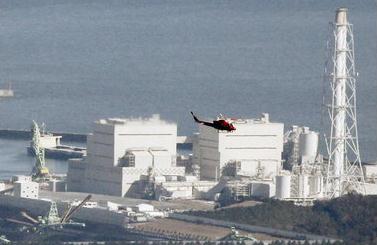
Nuclear Facilities Of Japan. Here's another
interactive graphic, courtesy of Google and the Harvard Center for Geographic Analysis.
Japan's Nuclear Crisis: Lessons For The USA. The New York Times
reports: "
Japan's nuclear crisis continued on Sunday as officials faced the possibility of multiple meltdowns of nuclear reactors. More than 170,000 people were evacuated in the northeastern coastal area ravaged by the 8.9 magnitude earthquake and tsunami on Friday, and fears of radiation contamination spread. While the cataclysm in Japan was a so-called once-in-a-century event, it also revived fears about the safety of nuclear power, which had regained support as an alternative to global dependence on fossil fuels. What are the lessons so far from the Japan disaster for the nuclear plants in the United States? Which plants or type of plants should we be most concerned about? Can reactors be made strong enough to survive a severe earthquake?"
*
U.S. Nuclear Industry Faces New Uncertainty. Just as nuclear power was staging something of a comeback in the USA with numerous projects awaiting approval, the disaster(s) in Japan are causing industry and government regulators to take a hard look at the inherent problems and challenges, especially reactors near active fault lines on the west coast (and near the New Madrid fault, which threatens St. Louis and Memphis). The New York Times has the story
here.
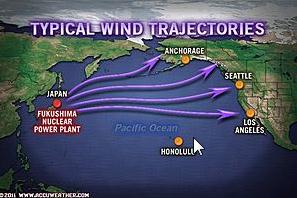
Tracking Potential Fallout. There's no way to know how far radioactive debris from Japan's damaged nuclear reactors might travel, if swept up in the jet stream prevailing winds aloft. Rain could bring some of that radioactivity down to the ground - significant dispersion and dilution likely before any radioactive particles ever reached the west coast. Here's an
update from Accu Weather: "
Generally speaking, any radioactive cloud rising significantly into the atmosphere would travel essentially eastward and northeastward across the Pacific Ocean, eventually reaching North America anywhere between Alaska and California. The precise details as to timing and path taken would depend upon the state of the atmosphere at the time of the hypothetical radiation release. Although such a cloud would pose virtually no threat while in the upper atmosphere, the fallout at the ground of radioactive particles from it should be a concern for any monitoring authority. A hypothetical release of radiation staying near the ground would be subject to low-level winds, which are more prone to varying."
New Discoveries In The Wake Of Japan's Quake. Some additional
information from physorg.com: "
What tripped scientists up was a lack of recent activity in the area, Jordan said. The last earthquake of this magnitude along this plate boundary occurred in the year 869. Seismologists had been debating the fault's potential to break, but they had little data to go on. "The question was whether that section had locked - accumulating strain - or was it slipping slowly," Jordan said. "We now know that this is a plate boundary that was locked."
Q: You mean there were no hints at all?
A: Brian Atwater, a USGS seismologist based in Seattle, said that Japanese GPS data collected since the 1990s showed that the coast of Japan was being pulled inland at a rate of about 25 feet per century, another indication that the plates were stuck and energy was building between them."
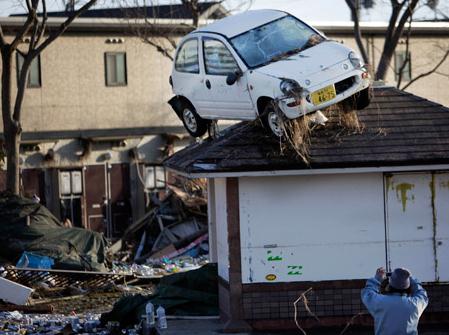
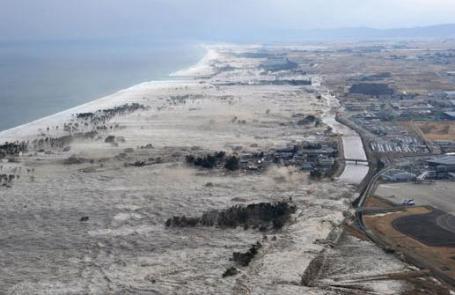
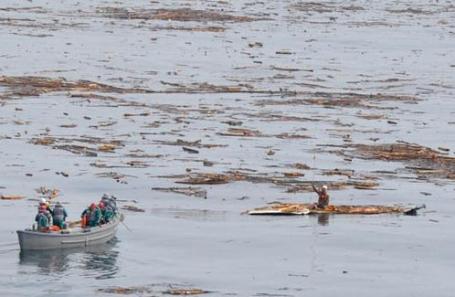
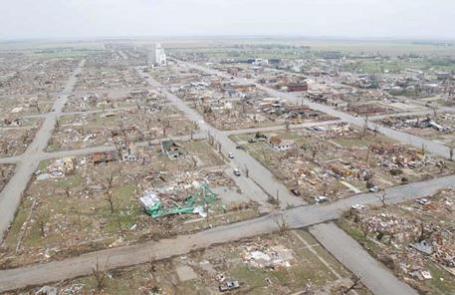
Extreme Force. The photo of the aftermath of the May, 2007 Greensburg tornado (F-5) is a reminder of the brutal forces of nature capable of leveling entire towns. Photo courtesy of the Wichita Eagle. Stu Ostro from the Weather Channel has a
post showing other examples of entire towns and coastal cities being wiped off the map. People often forget how powerful moving water can be. His comments: "
Then today I saw the photograph below of a town in coastal Japan, which instantly made me think of other similar stunning images of annihilation, images of the extreme force that can be unleashed in our world by the atmosphere, the Earth, and its human inhabitants."
The iPad2: Complete Coverage. Yes, techno-geek that I am I ran out to the MOA Mall of America store Friday evening to see if the iPad2 REALLY is better than the iPad (1). It is. It's faster, slimmer, lighter - all the things I wish I could be. Apps load up much faster, multi-tasking is smoother, the video camera is surprisingly good, the front-facing camera perfect for videoconferencing (Facetime is pretty amazing). I can accomplish 80% of what I can do on my laptop - instantly, no boot up, no viruses (yet). It's a significant improvement over what was already an amazingly sleek slab of tech. Here's a
story from Gizmodo: "
The iPad 2 is here. And yeah, it's pretty great. Despite the early looks, we're still finding surprises. Like? The screen is definitely better than the original iPad's. That's just the beginning. Here's a summary of our ongoing iPad 2 coverage, from speedtests and graphics battles versus the original iPad to essential apps and app deals), a possible answer to that most pressing of questions— white or black iPad? —and a quick buying guide."
Four Out Of Five Toddlers Use The Internet. Say what? When did this happen? Here's the
story from Gizmodo and Mashable: "
Apparently 80% of children age five and under are active internet users, according to a recent study. So that's where all those illiterate YouTube comments come from! Snark aside, there's nothing inherently wrong with kids that young being online, so long as what they're watching is heavily supervised. And given the motor abilities of your basic pre-schooler, I'm guessing they're not typing in too many URLs on their own. (with all the horrific news out there, almost biblical catastrophes half a world away and a growing risk of river flooding here at home - this story is definitely my favorite today).
Paul's Conservation Minnesota Outlook for the Twin Cities and all of Minnesota:
TODAY: Milder with increasing clouds, few PM showers. Winds: S 10-15. High: 42
TUESDAY NIGHT: Partly cloudy, not as cold. Low: 30
WEDNESDAY: Partly sunny, definite hints of April. High: 51
THURSDAY: Still mild, few passing showers. Low: 39. High: 50
FRIDAY: Mostly cloudy with a few more showers possible; only 1-2" snow left on the ground? Low: 37. High: 53
SATURDAY: Intervals of sun, nicer day of the weekend. Low: 38. High: 55
SUNDAY: Rain, potentially heavy. Slight thunder risk? Low: 40. High: 57
MONDAY: Lingering showers, lot's of mud. Low: 42. High: 48
Fast-forward Spring
Highly skilled hydrologists (river forecasters) working at the National Weather Service in Chanhassen will be burning the midnight oil over the next 4-5 weeks. With highs in the 50s, and nighttime lows staying well above 32 F. from Wednesday through next Monday, the rate of snow melt will be considerable. The ground is frozen and waterlogged, the result of record rains in 2010. Any additional rain will accelerate that snow melt. The (recently unreliable) GFS model hints at over .50" rain on Sunday. Yes, the atmosphere will be warm enough for all-rain, even a slight chance of a few embedded thundershowers over southern Minnesota. Let's hope that doesn't materialize - it could be a worst-case scenario for Minnesota's rivers. We'll see, but April-like weather is imminent.
Flooding results in an average of $13 billion in annual damage nationwide, the second greatest cause of weather-related deaths, second only to extreme heat. No problems expected this week but smalle rivers may approach flood stage next week. A sprinkle today gives way to Thursday showers; the main event arrives Sunday as Gulf moisture flows north.
Hope for the best, prepare for the worst.
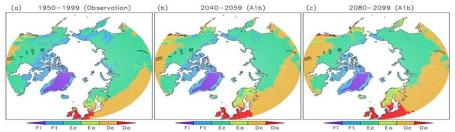
Climate Change's Impact on Arctic Region by 2099: Study. Physorg.com takes a look at transformations predicted for the top of the world by the end of the century. If anything, supercomputer simulations have underestimated the rate of warming (and thinning of ice) in recent years:
" Imagine the vast, empty tundra in Alaska and Canada giving way to trees, shrubs and plants typical of more southerly climates. Imagine similar changes in large parts of Eastern Europe, northern Asia and Scandinavia, as needle-leaf and broadleaf forests push northward into areas once unable to support them. Imagine part of Greenland's ice cover, once thought permanent, receding and leaving new tundra in its wake. Those changes are part of a reorganization of Arctic climates anticipated to occur by the end of the 21st century, as projected by a team of University of Nebraska-Lincoln and South Korean climatologists. In an article to be published in a forthcoming issue of the scientific journal Climate Dynamics, the research team analyzed 16 global climate models from 1950 to 2099 and combined it with more than 100 years of observational data to evaluate what climate change might mean to the Arctic's sensitive ecosystems by the dawn of the 22nd century. The study is one of the first to apply a specific climate classification system to a comprehensive examination of climate changes throughout the Arctic by using both observations and a collection of projected future climate changes, said Song Feng, research assistant professor in UNL's School of Natural Resources and the study's lead author. Based on the climate projections, the new study shows that the areas of the Arctic now dominated by polar and sub-polar climate types will decline and will be replaced by more temperate climates -- changes that could affect a quarter to nearly half of the Arctic, depending on future greenhouse gas emission scenarios, by 2099."


No comments:
Post a Comment