Paul's Conservation Minnesota Outlook for the Twin Cities and all of Minnesota:
TODAY: More humid, scattered T-storms, some strong/severe. Dew point: 73. Winds: S 15. High: 88
FRIDAY NIGHT: T-storms likely, some packing locally heavy rain. Low: 75
SATURDAY: Sticky sunshine, strong storms. Dew point: 75. Winds: S 15. High: 94
SATURDAY NIGHT: Evening thunder, very warm and muggy overnight. Low: 79
SUNDAY: Blazing sun. Dew point: 78 Feels like 110. Potentially dangerous levels of heat & humidity. High: 96
MONDAY: Heatwave builds. Oppressively hot and sunny. Low: 80. High: 97
TUESDAY: Stifling heat - no relief yet. A bright, unrelenting sun. Low: 79. High: 96
WEDNESDAY: Still steamy & sweaty. Sunny and hot. Low: 78. High: 94
THURSDAY: Fading sun, a few cooling T-storms later? Low: 76. High: 92
74 F. high in the Twin Cities on Thursday.
.13" rain fell yesterday at MSP, .66" at St. Cloud.
81 degree dew point predicted for Saturday afternoon, heat index tops 110.
105-115 heat index possible every afternoon from Saturday through at least Tuesday.
Sunday: hotter/drier day of the weekend (probably too hot/dry aloft for T-storms). Highs reach the mid/upper 90s. With a predicted dew point in the 75-80 range it may feel like 105-115 F. I expect the NWS to issue an Excessive Heat Warning by Sunday for the metro area and much of southern Minnesota.
"...
10 percent of the moisture found in the atmosphere is released by plants through transpiration." - source: USGS
"...The globe experienced the seventh warmest June since record keeping began in 1880. The Arctic sea ice extent was the second smallest extent for June on record. - June summary from NOAA, details below.
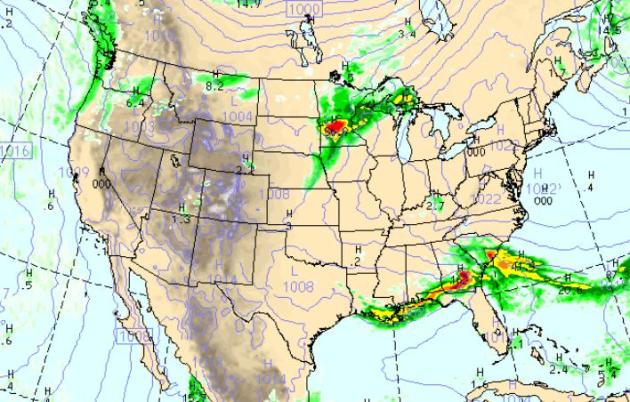
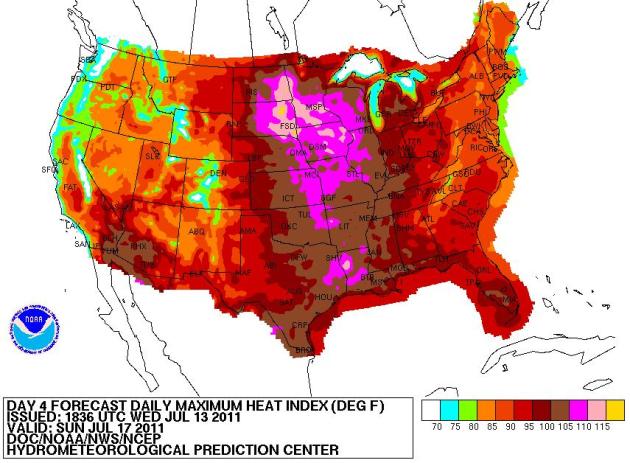
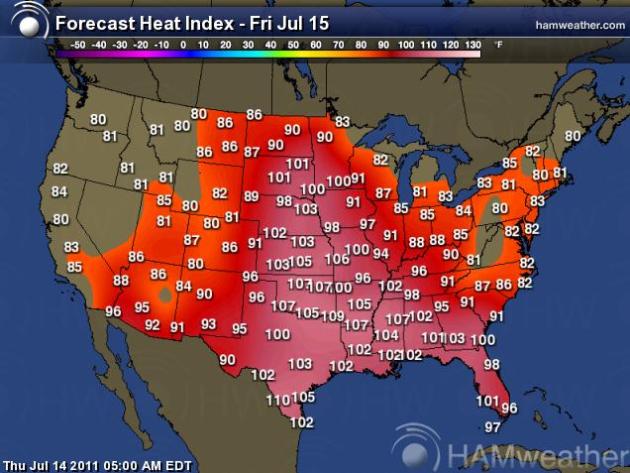 Heatwave Expands North.
 The predicted heat index (factoring temperature and dew point) is expected to top 100 from southwestern Minnesota southward to Texas and much of the south later today. The culprit: dew points forecast to range from 75-80, as humid as it ever gets. Map courtesy of Ham Weather.
Sauna-Like Sunday. The models are all fairly consistent: by Sunday the combination of temperatures in the mid 90s + dew point temperatures close to 80 will make it feel like 110-115 across the southern half of Minnesota, the eastern Dakotas and much of Iowa. Source: NOAA's
NCEP.
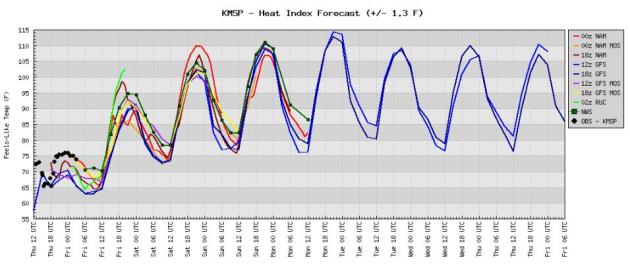 Hottest Air Of Summer In The Twin Cities?
 Check out the predicted heat index:
105-110 Saturday and Sunday, closer to 110-115 on Monday, no real relief until the very end of next week at the earliest. Take the heat seriously - I have a hunch next week is going to be a tough one (for almost everyone, but especially for people who work outside in the heat).
Is Corn Contributing To The Heatwave? How can the dew point be higher in Albert Lea than it is in New Orleans? Many (oppressive) summer days there is more moisture over the Upper Midwest than along the Gulf Coast, which is a bit counterintuitive, since the Gulf of Mexico is the SOURCE of most of our moisture during the summer months. Before I go any further I just want to point out that I am pro-corn. I love corn, always have, always will. This is, in no way, an attempt to disparage corn farmers. The reality is that corn "sweats", releasing vast amounts of water every night through a process known as "evapotranspiration." IN recent years with improving farming techniques corn farmers have been able to plant corn rows closer together, resulting in much higher yields per acre, but also releasing more water into the air during the late night hours. This process pumps more moisture into the atmosphere, resulting in higher dew point temperatures (and a much higher heat index by afternoon).
The Weather Channel has a good write-up about "sweaty corn" and how it can make it feel even more unbearable, especially downwind of the corn belt: "
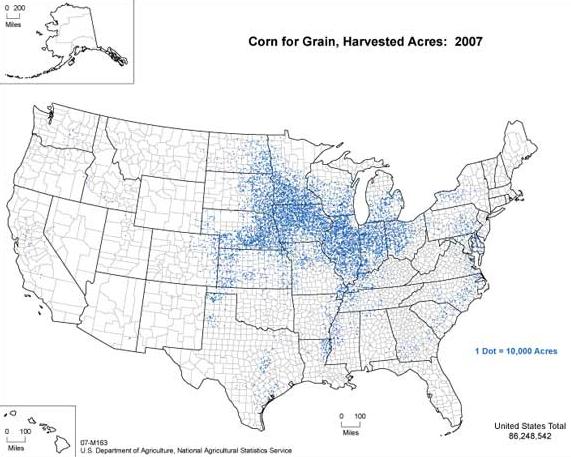
The United States Corn Belt is a region in the Midwest where corn is the chief harvested crop. The USDA map shows that the belt includes the states of South Dakota, North Dakota, Wisconsin, Nebraska, Iowa, Minnesota, Illinois, Indiana and Ohio. Evaporation of water from soil with high moisture content (due to passing thunderstorm complexes) and the transpiration of water from tens of thousands of acres of a mature corn crop contribute to an atmosphere that is sopping wet. When high pressure and consequently high heat builds over the Corn Belt region during the summer months, humidity levels simply go through the roof thanks to evapotranspiration. Dew point temperatures easily reach the 80s routinely. Suffice to say, a dew point value of 80 or higher is oppressive. Let's put it this way. An air temperature of 90 degrees and a dew point of 65 degrees makes it feel like it is 92 degrees. Not bad actually. But an air temperature of 90 degrees combined with a dew point of 82 degrees makes it feel like it is 111 degrees. That's a "feels like" temperature difference of nearly 20 degrees!"
Corn Belt. Corn for grain harvested acres. 1 dot = 10,000 acres. (Source:
agcensus.usda.gov). Source:
weather.com.
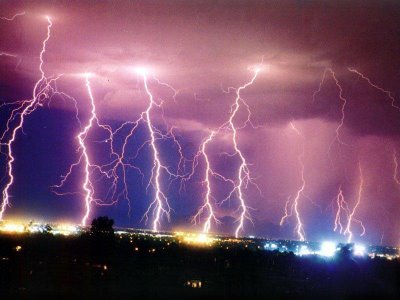
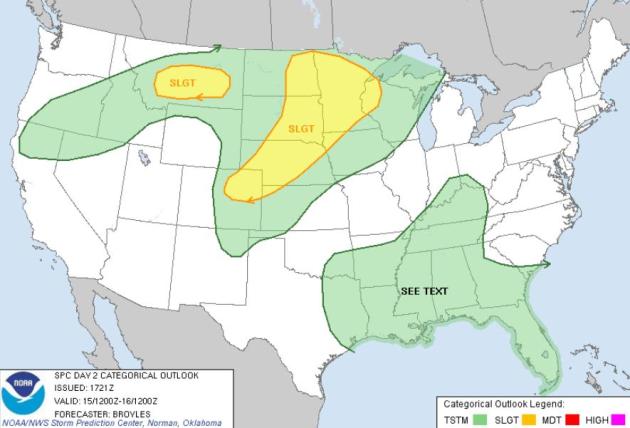 Friday Severe Threat
. The greatest risk of severe storms later today will come from Denver northeastward to Omaha, the eastern Dakotas and much of Minnesota - intense to severe storms forming on the northern edge of an expanding heatwave. Stay tuned for watches and warnings.
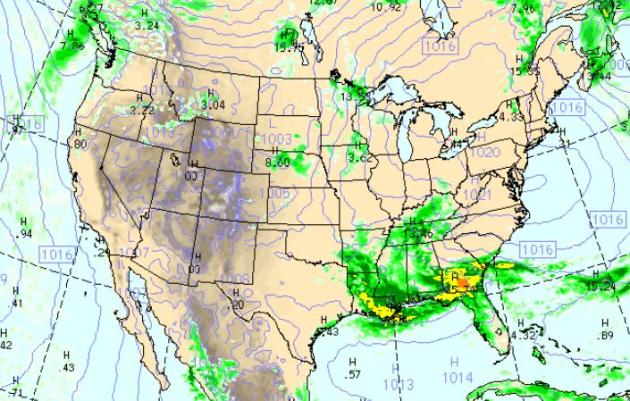 Weather Models. 1 pm today
, from the WRF/NAM
model. More heavy thunderstorms dropping beneficial rains over Dixie, with some 1-3" amounts from the parishes of Louisiana eastward into Georgia and the Florida panhandle. The rains are putting a dent in the drought, but farmers in Texas and Oklahoma continue to suffer through some of the worst heat and drought since the Dust Bowl years of the mid 1930s.
 Weather Models, 7 am Saturday.
 Strong/severe storms are forecast to rumble across Minnesota, more tropical downpours along the Gulf coast, lighter showers from Seattle to Portland - dry, relatively comfortable weather lingering over much of New England.
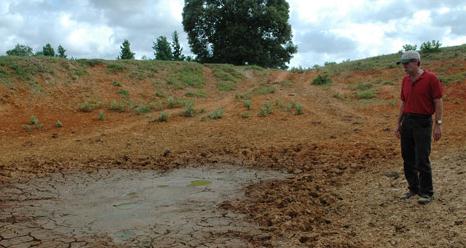
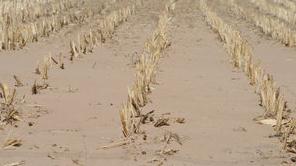
In Drought-Hit Kansas, Desparation Is The Only Thing Growing. Some are comparing the situation in western Kansas with the Dust Bowl years of the 1930s. It's that bad. The
Wichita Eagle has more details: "
ELKHART — Mary Coen apologizes for her dusty house. She tells a visitor not to look at the windowsill in her farmhouse living room where a layer of dust has settled from the last burst of wind. “The Good Lord hasn’t let it rain,” she says. This summer, it doesn’t take much for the wind to kick up sand in western Kansas. A 10 to 15 mph wind will cause the horizon to dim; at 30 to 40 mph, it darkens the sky and visibility is less than a 100 feet. Much of Morton County is in an exceptional drought, the driest rating, according to the U.S. Drought Monitor. Already it is drier than the driest years of the Dust Bowl. Since last September — 10 months ago — Morton County near Elkhart has received 2.99 inches of moisture. The normal average rainfall for that corner of Kansas is about 19 inches."
- Quivira National Wildlife Refuge’s Big Salt Marsh in Stafford County is dry and cracked. It smells of death from hundreds of rotting fish.
- The drought is so severe, it even caused the Kansas Legislature to ease some of the restrictions on western Kansas irrigators, acknowledging the drought is quickly eating up their yearly water allotments.
- Roads have been closed due to drifting sand, blocking access to gas and oil wells and causing some companies to shut the wells down temporarily.
- A 10 to 15 mph wind will cause the horizon to dim; at 30 to 40 mph, it darkens the sky and visibility is less than a 100 feet.
- Much of Morton County (most southwestern county in the state) is in an exceptional drought, the driest rating, according to the U.S. Drought Monitor. Already it is drier than the driest years of the Dust Bowl.
- Since last September — 10 months ago — Morton County near Elkhart has received 2.99 inches of moisture. The normal average rainfall for that corner of Kansas is about 19 inches.
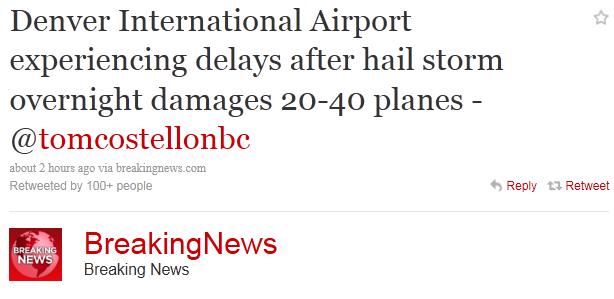
Denver, Colorado Hailstorm. This is prime time for hail, and the Front Range of Colorado has been hit unusually hard by "hailers" in recent weeks. Click
here to see video of Wednesday evening's fusilade of hail, courtesy of BNVN: "
Massive hail storm and heavy rains hit the Downtown Denver, CO area just after rush hour on Wednesday night. Credit: BNVN - Tony Laubach"
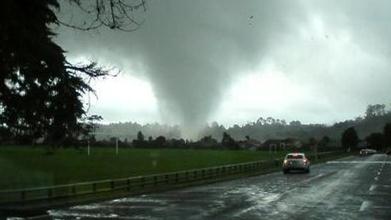
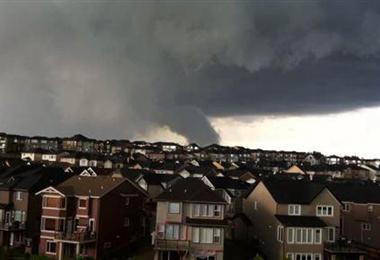 Calgary Tornado
. A (rare) tornado hit Calgary, Alberta late Wednesday. More details from the
Vancouver Sun. Here are a few details:
- Calgary saw its first tornado since 2009 last night.
- Environment Canada meteorologists are now saying a tornado briefly touched down.
- It is categorized as an F0, the smallest category of tornado, which has winds of 40 mph to 71 mph.
- This is the 9th tornado since 1970 in Calgary.
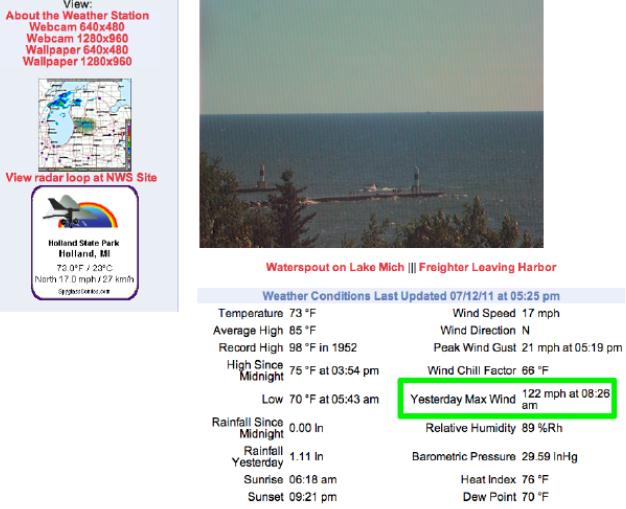
122 MPH Gust! The Spyglass Condo's near Holland, Michigan have a weather station that registered a 122 mph wind gust Monday morning. That's equivalent to a strong EF-2/weak EF-3 tornado. Details from
yfrog.com.
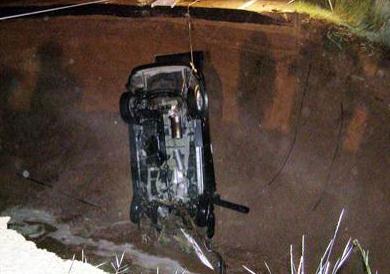 Huge Sinkhole Opens, Causing Fatal Utah Crash
. Recent flooding has created a series of deadly sinkholes in Utah, as reported by the AP and
MSNBC: "
SALT LAKE CITY — A 15-year-old girl is dead after heavy rains caused a huge sink hole to open on a northeastern Utah highway, swallowing one vehicle and causing her father's SUV to careen off the road. Authorities said the crash that killed Justine Barneck and injured her father, Michael Barneck, late Wednesday night happened when the road collapsed in front of them, leaving a patch of asphalt on the edge of the hole that the vehicle hit, causing the fatal accident. At about the same time, a second car actually went into the 40-foot-wide, 30-foot-deep hole, said Utah Highway Patrol Cpl. Todd Johnson. The driver of that vehicle, 37-year-old Helen Paulson, was hurt, but the extent of her injuries was not immediately clear."
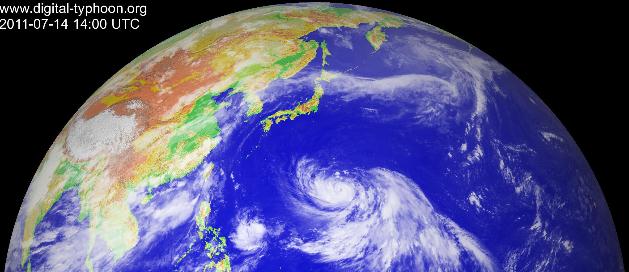
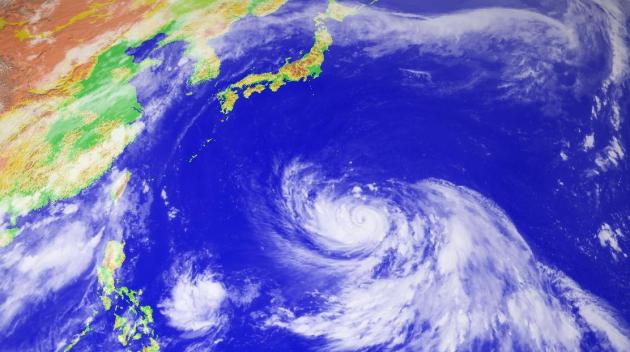
Latest On Typhoon Ma-On. The typhoon (same thing as a hurricane) is still forecast to hit Japan, probably in the vicinity of Osaka or Nagoya - metro Tokyo may be spared the highest winds and heaviest rains. More details:
- As of Thursday afternoon local time, the typhoon featured maximum sustained winds of 105 mph, with higher gusts.
- equivalent to a strong Category 2 hurricane
- Storm movement, towards the west on Thursday, is likely to become northwesterly or even northerly by the end of the week.
- Typhoon Ma-On forecast to reach super typhoon status early next week, make landfall in southern Japan shortly afterward
- Greater Tokyo is unlikely to feel the worst of the storm, no matter its ultimate track. Still, flooding rain and damaging winds could take place in the early to middle parts of the week.
- Likewise, in northeastern Honshu, at the site of the March tsunami and nuclear disasters, there is the potential for heavy rain, high winds and rough seas next week.
- Storms like this can unload 10-20 inches of rain
- danger for mudslides and flooding upon reaching Japan
 Record Number of People Dying Of Heatstroke In Japan
. Extreme heat has grippled much of Japan in recent weeks. A few details:
- Cases of heatstroke in Japan have hit record levels as people switch off air conditioners in the summer heat to save power after the nuclear crisis.
- At least 26 people have died this month alone.
- The average temperature in Japan this summer is nearly 7° higher than usual, with some centers sweltering in 100° heat.
- The country's disaster management agency says that since the start of this month more than 13,000 people have been rushed to hospital because of heatstroke.
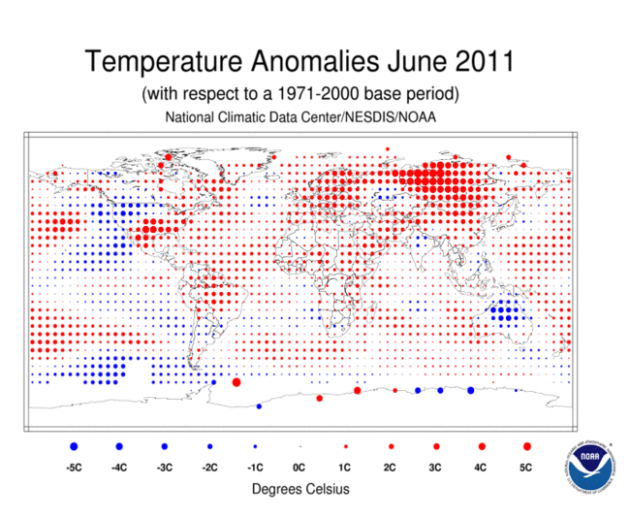
Global Temperatures Were 7th Warmest On Record For June. The nation's midsection baked, while unusually cool weather lingered over much of the north and west, temperatures FAR above average over much of Asia and Siberia.
NOAA has more details: "
The globe experienced the seventh warmest June since record keeping began in 1880. The Arctic sea ice extent was the second smallest extent for June on record. The monthly analysis from NOAA’s National Climatic Data Center is part of the suite of climate services NOAA provides government, business and community leaders so they can make informed decisions.
Global Temperature Highlights: June
- The combined global land and ocean average surface temperature for June 2011 was the seventh warmest on record at 60.94 F (16.08 C), which is 1.04 F (0.58 C) above the 20th century average of 59.9 F (15.5 C). The margin of error associated with this temperature is +/- 0.13 F (0.07 C).
- Separately, the global land surface temperature was 1.60 F (0.89 C) above the 20th century average of 55.9 F (13.3 C), which was the fourth warmest June on record. The margin of error is +/- 0.23 F (0.13 C). Warmer-than-average conditions occurred across most of Russia, Europe, and China, the Middle East, eastern Canada, Mexico, and the southern United States. Cooler-than-average regions included the northern and western United States, part of western Canada, and most of Australia.
The June global ocean surface temperature was 0.85 F (0.47 C) above the 20th century average of 61.5 F (16.4 C), making it the 10th warmest June on record. The margin of error is +/- 0.07 F (0.04 C). The warmth was most pronounced across the central north Pacific, equatorial west Pacific, the Labrador Sea, the equatorial Atlantic, and much of the mid-latitude southern oceans."
Preparing For The Upcoming Hurricane Season. Patch.com has some helpful tips for businesses along the Gulf and Atlantic coast, preparing for what will probably be a very busy hurricane season for the USA: "
This past winter and spring brought some unforeseen weather-related damage here in the Northeast. Significant flooding in the north, tornadoes in the central region and record snowfall in southern New England caused much damage and loss. However, one thing we can predict is the arrival of the Atlantic Hurricane Season as well as the likelihood of severe weather that comes with it. As a result, Acadia Insurance is reminding business owners to create or revisit their pre-storm and post-storm Emergency Action Plan (EAP). The National Oceanic and Atmospheric Administration (NOAA) currently predicts that there is a 65 percent chance of having an above normal 2011 Atlantic hurricane season with 12 to 18 named storms, 6 to 10 hurricanes and 3 to 6 major hurricanes. “Property planning is critical to preventing or minimizing loss during hurricane season,” said Christopher Streeter, Home Office Sr. Property Underwriting Lead, Acadia Insurance. “Therefore, an up-to-date EAP is essential to ensuring that a company’s response procedures are organized and well thought-out during workplace emergencies. Such formalized plans typically result in less severe injuries to employees as well as minimal business damage and loss.” Acadia recommends taking several steps before the storm, including setting up a “Go Box” for critical papers and information such as:
- Lists of all employees, key customers and clients along with their phone numbers and addresses
- Insurance policies and agent contact information
- Electronic data back-up
- Equipment, computer software/hardware, and furniture inventories
- A list of emergency vendors, such as plumbers and restoration contractors
- Copies of essential business policies, plans, and agreements
- Photographs of the business and equipment, both inside and out"
Father And Son At First/Last Shuttle Launch. This is pretty cool, a 30 year history of watching shuttle launches. The
link is here.
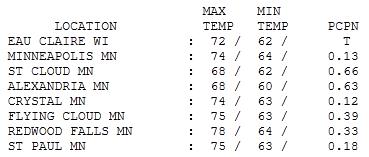 Last Semi-Comfortable Day In Sight
. With persistent clouds and morning/midday showers, temperatures were 5-10 degrees cooler than average, ranging from 68 at Alexandria and St. Cloud to 74 in the Twin Cities, 78 at Redwood Falls. More climate information
here, courtesy of the National Weather Service.
"Sweaty Corn"
Before I utter another word let me say how much I like corn. I'm very pro-corn - always have been. But corn "sweats" during the nighttime hours, releasing water into the air in a process known as "evapo-transpiration". That's why summer dew points can be higher in southern Minnesota than Louisiana, close to the source of most summer humidity, the Gulf of Mexico. Something is putting more water into the atmosphere.
If the dew point does hit 80 this weekend (as much water in the air as we ever see at this latitude) corn and other crops may be spiking our humidity levels, making it feel even worse out there. By Sunday the Heat Index is forecast to be in the 105-110 range; the risk of heat ailments as high as they ever get. Take it easy out there; find a cool lake or loiter in a store with a sturdy air conditioner.
I have a hunch this may be the hottest air of the summer; 90s from today thru most of next week, nighttime lows not dipping much below 80 in the downtowns. The Dog Days.
The approach of this inflamed air will destabilize the atmosphere; heavy/severe storms rumbling around the state into Saturday, maybe some 1-2+" rainfall amounts. Welcome to The Tropics (with lakes).
Global Warming "Influencing Weather Extremes". A story in the
New Zealand Herald: "
Human-influenced global warming has played a role in the severe weather events in New Zealand and abroad over the past year, says a visiting climate expert. Weather-related disasters in the past year range from a heatwave in Russia to flooding in Pakistan, China, India, and Queensland and drought in Brazil. New Zealand also broke temperature and rainfall records and experienced a deadly tornado in Auckland. Christchurch-born climate scientist Kevin Trenberth, now employed by the US National Centre for Atmospheric Research, said the effects of cumulative greenhouse gases building up in the atmosphere was most evident in rising ocean temperatures and ice melt. He calculated that the sea surface temperature has increased 0.55C since the 1970s. This meant the water vapour in the atmosphere immediately above the ocean increased by 4 per cent. A warmer, more moist environment was a breeding ground for storms and increased rainfall. "The environment in which all storms form now is different from 30 or 40 years ago because of climate change."
Here's an excerpt of an article in
Smithsonian Magazine: "
Whenever we get an especially cold winter or very bad snowstorm, climate change deniers fill our TV screens with their claims that the day’s weather proves that global warming is a joke. But we don’t see the opposite. There’s a severe drought in the southern United States and heat waves are hitting various parts of the country, but no one is screaming “climate change is real” because of them. Why? Cold spells, snowstorms, droughts, heat waves—these are all examples of weather, not climate. And weather and climate are not the same thing. “No climate scientist will tell you that a dry year is a result of climate change,” Barry Nelson, a senior policy analyst for the National Resource Defense Council’s water program recently told Salon. “What they will say is that the decade-long drought in the Southwest that we’ve seen is consistent with the patterns we’re likely to see in the future. The basic weather patterns are what climate change predicts.” Here’s how I explained it a couple years ago: In short, weather is a data point. Climate is a collection of data. You can think of it like the economy. I can tell you that the Dow is up 112.61 as I write this, at 9,284.22. This is the weather (partly sunny, 84 F). But it doesn’t tell you anything useful about the economy as the whole (like the weather conditions don’t tell you anything useful about climate). A graph of the Dow over the last year, showing a terrifying decline followed by a steady rise, begins to tell the story of the last year. But to get a true picture of the economy, we’ll need to look at lots of other bits of data, like consumer confidence, unemployment rates and durable goods orders. It’s complicated, messy and hard to understand. That’s climate."
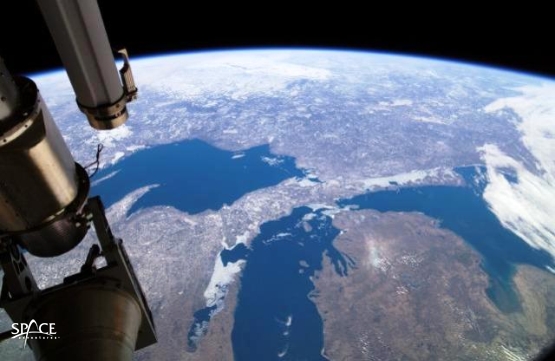
Climate Change Already Altering Great Lakes, Report Says. Here's a Star Tribune article, by way of the
Miami Herald: "
MINNEAPOLIS -- Isle Royale in Lake Superior used to be too cold for deer ticks. But not anymore. The ticks, which carry Lyme disease, have been found for the first time on the island off the coast of northern Minnesota. And by the end of the century, nesting loons may disappear altogether from most of the Great Lakes. Those are some of the findings of a new report on the impact of climate change on the Great Lakes' five largest national parks made public Wednesday by two environmental groups, the Natural Resources Defense Council and the Rocky Mountain Climate Organization. It was the latest in a series of studies they have conducted on the current and future effects of a warming global climate on national parks from California to Virginia. The report, the authors said, provides an early look at what's to come if the Republican-led Congress continues to thwart federal efforts to curb greenhouse gas emissions. Republicans this week tried and failed to repeal new standards for more energy efficient light bulbs, and are resisting the new federal rules regulating greenhouse gas emissions expected later this summer. They say the rules are unnecessary intrusions on freedom, and job killers. "We have an increasing partisan divide on this," said Stephen Saunders, president of the Rocky Mountain Climate Organization and a former national parks official with the Department of the Interior. "If people pay attention to how the places they know and love respond to climate change, I hope that makes people aware of what we should be doing differently." The authors analyzed a century's worth of temperature trends for the great lakes area drawn from two weather stations on Lake Michigan, and found that both show more rapid change than the global averages. The one near the Indiana Dunes National Lakeshore, near Chicago, showed that in the last decade average temperatures have increased by 1.6 degrees, and the one near Picture Rocks National Lakeshore in Michigan showed an average increase of 2.7 degrees."
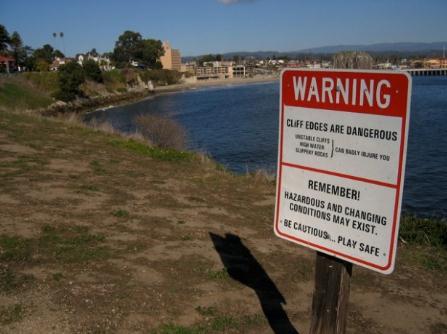
Climate Change Chipping Away At The (Pacific) Coast. Here's the story from
KQED-TV:
USGS: Warmer ocean temps portend more erosion along the West Coast. This week researchers at the US Geological Survey (USGS) issued a damage report that assesses how badly El Nino patterns tore up West Coast beaches during the winter of 2009-2010. Up and down the coast, the survey logged beach erosion 36% above average. The study's authors point to the intensity of the El Nino conditions during that time, as well as a geological shift in the region of warmer water. They say high water, heavy storms and warmer waters were the culprits. And they warn that with the changing climate, these events may become more common. "This little winter is a snapshot of what climate change may look like where we have baseline higher sea levels and more significant storms." said Patrick Barnard, a coastal geologist with the USGS in Santa Cruz."
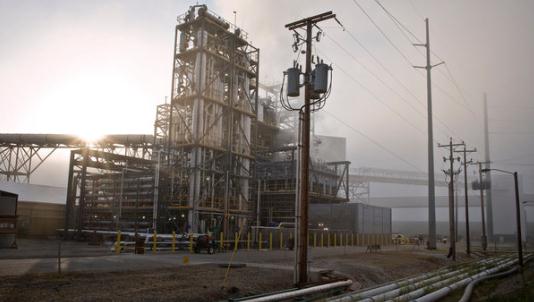
Utility Shelves Ambitious Plan To Limit Carbon. The
New York Times has the story (subscription may be required to read the full article): "
WASHINGTON — A major American utility is shelving the nation’s most prominent effort to capture carbon dioxide from an existing coal-burning power plant, dealing a severe blow to efforts to rein in emissions responsible for global warming. American Electric Power has decided to table plans to build a full-scale carbon-capture plant at Mountaineer, a 31-year-old coal-fired plant in West Virginia, where the company has successfully captured and buried carbon dioxide in a small pilot program for two years. The technology had been heralded as the quickest solution to help the coal industry weather tougher federal limits on greenhouse gas emissions. But Congressional inaction on climate change diminished the incentives that had spurred A.E.P. to take the leap."
Climate Change Reducing Ocean's Carbon Dioxide Uptake, New Analysis Shows. The details from
sciencedaily.com: "
ScienceDaily (July 11, 2011) — How deep is the ocean's capacity to buffer against climate change? As one of the planet's largest single carbon absorbers, the ocean takes up roughly one-third of all human carbon emissions, reducing atmospheric carbon dioxide and its associated global changes. But whether the ocean can continue mopping up human-produced carbon at the same rate is still up in the air. Previous studies on the topic have yielded conflicting results, says University of Wisconsin-Madison assistant professor Galen McKinley. In a new analysis published online July 10 in Nature Geoscience, McKinley and her colleagues identify a likely source of many of those inconsistencies and provide some of the first observational evidence that climate change is negatively impacting the ocean carbon sink. "The ocean is taking up less carbon because of the warming caused by the carbon in the atmosphere," says McKinley, an assistant professor of atmospheric and oceanic sciences and a member of the Center for Climatic Research in the Nelson Institute for Environmental Studies."
Too Much Life On Earth? Overpopulation is a weighty subject, but one that needs to be addressed - does the planet have enough resources to be able to support 9-11 billion people? Will we hit a wall in terms of energy consumption and subsequent carbon emissions? Here's an Op-Ed from the
New York Times: "
The specter of overpopulation was raised once more in 2008 by the decline in global food stocks and rapid deterioration of the environment. The figures are frightening — 218,000 more mouths to feed each day, 80 million more each year, a global population now close to 7 billion. But overpopulation is as much a question of culture as statistics, and has worried humanity for a long time. In the 4th century B.C., when the world had a population of less than 200 million, Plato and Aristotle recommended strict control of birth rates by the state. The populationists have long been at loggerheads with those who favor birth rate control. Populationists claim overpopulation is an illusion; Malthusians warn of dire consequences. For a long time no reliable statistics were available, and the debate was primarily philosophical, religious or political. Now there is plenty of data but the positions are still largely ideological or religious. The debate touches on fundamental questions regarding life and its value, hence the passion that it raises. The concept of overpopulation has a variable geometry, closely linked to the resources available. One might suppose that 40,000 years ago, when the entire world population was only half a million, there were no problems, yet group size in hunter-gatherer society was probably limited to between 25 and 50 by the amount of territory required to provide enough food — 10 to 25 square kilometers per person. A larger group would have had difficulty in finding enough to eat."
Hear Ye, Hear Ye: Monckton's Medieval Warming Tale Is Climate Heresy. From Australia's "
The Conversation": "
It is a thankless task to track the frequent mistakes Christopher Monckton makes as he misinterprets science, as his statements are frequently at odds with the very scientists whose work he cites. It is, however, necessary. In a recent lecture given at the University of Notre Dame in Australia (June 2011) represented by his document “The Climate of Freedom”, Monckton claims, “Dr. Craig Idso has collected papers by almost 1000 scientists worldwide, nearly all of which demonstrate the influence of the Medieval Warm Period (MWP) and show it was at least as warm as, and in most instances warmer than, the present.”
This claim by Monckton has two parts that are important to the discussion of climate change:
- Was the MWP global in extent and warmer than today?
- Does the presence of the MWP call into question human-caused global warming?
To be clear, the prevailing view amongst scientists is that the MWP was neither global nor warmer than present times. In fact, the National Academy of Sciences thoroughly investigated this issue and concluded, “the late 20th century warmth in the northern hemisphere was unprecedented during at least the last 1000 years."


No comments:
Post a Comment