24 F. average high for January 4.
9 F. high temperature one year ago, on January 4, 2011.
23 F. morning low on Wednesday (one year ago the wake-up temperature on January 4 was a brisk -5 F).
* 47 F. today's all-time record high, most recently in 1924. We stand a good chance of tying or breaking this record today.
10.3" snow so far this winter season in the Twin Cities metro.
44.6" snowfall as of January 4, 2011.

47.8% of USA was covered with snow/ice on January 4, 2011.
58.1% of the USA was coverer with snow/ice on January 4, 2010. Source: NOAA's NOHRSC and phillyweather.net.
2.8 to 1. Daily high temperature records exceeded daily low temperature records across the USA in 2011 by a factor of 2.8 to 1. Source: NCDC, National Climate Data Center.
4 of the last 6 months in the Twin Cities were the "Top 10" warmest months ever recorded: July, October, November and December made the Top 10 list for their respective months. Source: NOAA.
October thru December: warmest such period across Minnesota in 80 years. Source: MN Climate Office.
31 tornadoes reported in Minnesota during 2011. Average is 27 for the year, statewide.
1 tornado-related fatality reported in Minnesota last year - the tornado that hit Minneapolis on May 22 claimed one life.
Miami: 78.27 F. in 2011. Warmest year ever recorded. Previous record was 1990, with an average temperature of 78.12 F.
West Palm Beach: 77.62 F. Warmest year ever recorded. Previous record was 1990, with an average temperature of 77.45 F.
Hartford: 69.23" precipitation in 2011, the wettest year on record.
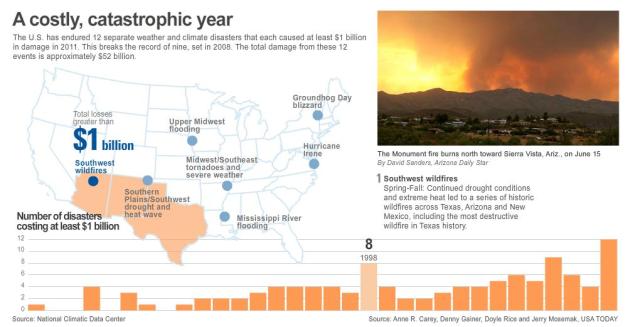
$380 billion: estimated cost of global natural disasters in 2011; most expensive year on record, according to Munich Re (story below from USA Today).
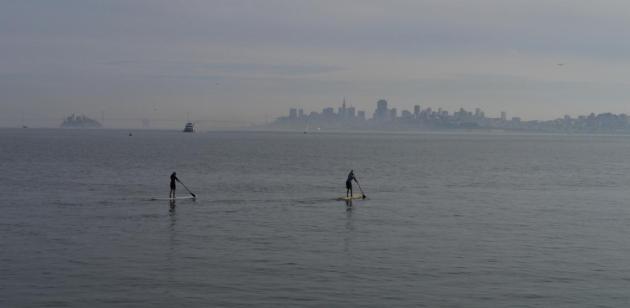
Unnaturally Nice. I just got home from a quick trip to San Francisco with my wife and youngest son, who is a senior at the U.S. Naval Academy. We couldn't believe our good luck, weatherwise: daytime highs consistently in the 60s; the mercury brushed 70 under a flawless sky during a visit to Stanford. Unreal. All the locals we talked to were thrilled, and a bit dazed. You see last winter at this time it wouldn't stop raining, with flooding in the city and record snows reported in the mountains as a parade of wild storms surged overhead. Hard to believe the weather can be so dramatically different from one year to the next, but a lot of people are scratching their heads in disbelief this "winter".
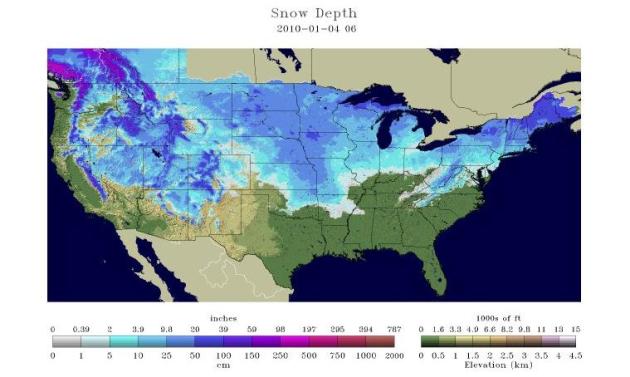
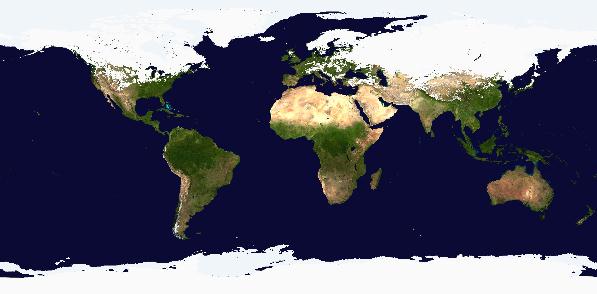
Snowcover on January 4, 2010. Data courtesy of NOAA and phillyweather.net.
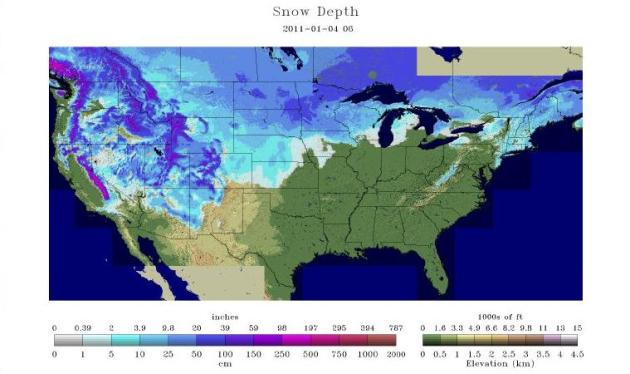
Snowcover on January 4, 2011. More than twice as much snow than this year - with much greater snow depths.
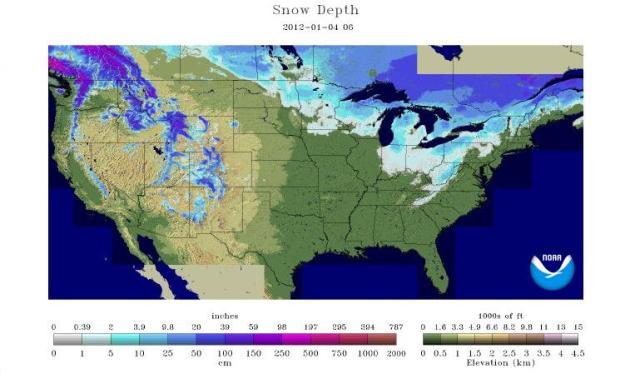
Snowcover on January 4, 2012. The National Snow-Cover Problem. Phillyweather.net has a very interesting story about the contrast in snowcover across the USA from the previous 2 years at this point in time. It's not only the aerial coverage of snowcover, but snow depth that is sorely lacking from coast to coast: "Anemic describes it best. And again, this is on a national level. The snow cover you see in the Great Lakes and Appalachians was barely there as of a few days ago. We're at 21.7% of the country covered in snow now. A couple days ago, we were sub-20%. While the aerial coverage certainly is a stark contrast to the last few winters, note some of the more striking changes...out west.....Califronia is hurting terribly this winter....snow water equivalent is at 19% of normal, over the entire Sierra!"
Wednesday Record Highs:
A RECORD HIGH TEMPERATURE OF 55 DEGREES WAS SET AT BISMARCK ND
TODAY. THIS BREAKS THE OLD RECORD OF 44 SET IN 2001.
A RECORD HIGH TEMPERATURE OF 50 DEGREES WAS SET AT WILLISTON ND
TODAY. THIS BREAKS THE OLD RECORD OF 48 SET IN 2008.
A RECORD HIGH TEMPERATURE OF 46 DEGREES WAS SET AT JAMESTOWN ND
TODAY. THIS BREAKS THE OLD RECORD OF 42 SET IN 2001.
A RECORD HIGH OF 49 DEGREES WAS SET AT SISSETON SD TODAY. THIS
BREAKS THE OLD RECORD OF 47 DEGREES SET IN 1987.
A RECORD HIGH OF 57 DEGREES WAS SET AT MOBRIDGE SD TODAY. THIS
BREAKS THE OLD RECORD OF 46 DEGREES SET IN 1964.
A RECORD HIGH OF 54 DEGREES WAS SET AT ABERDEEN SD TODAY. THIS
BREAKS THE OLD RECORD OF 47 DEGREES SET IN 1921.
A RECORD HIGH OF 47 DEGREES WAS SET AT WATERTOWN SD TODAY. THIS
BREAKS THE OLD RECORD OF 45 DEGREES SET IN 1987.
Review Of Minnesota Weather In 2011. The Minnesota State Climate Office has a good summary of another strange year of weather here in Minnesota: "However some places in southeastern Minnesota, including the Twin Cities have not seen the mercury dip below zero yet. Snowstorms were few and far between in the state, with northeastern Minnesota being clipped with some small snow events from time to time. The one significant snowfall over central and southern Minnesota happened on December 3-4 which dropped a swath of 2-5 inches over south central, south east and east central Minnesota. Fairmont saw 5 inches. A smaller event dropped 1-2 inches on December 16 over southeastern Minnesota. New Year’s Eve saw a rain and snow event over southern and central Minnesota that brought back a taste of winter. As 2011 drew to a close, concerns grew about the availability of soil moisture in the spring. It has been some time that central and southern Minnesota has been in a dry moisture situation over the winter months. Time will tell if the spring rains will come."
- December 2011 was yet another dry month across much of Minnesota. In many counties, it was the fifth consecutive month of precipitation shortfalls. Some drought-stricken counties in southern Minnesota received near-normal precipitation, but it was not nearly enough to mitigate very large moisture deficits built up during the autumn.
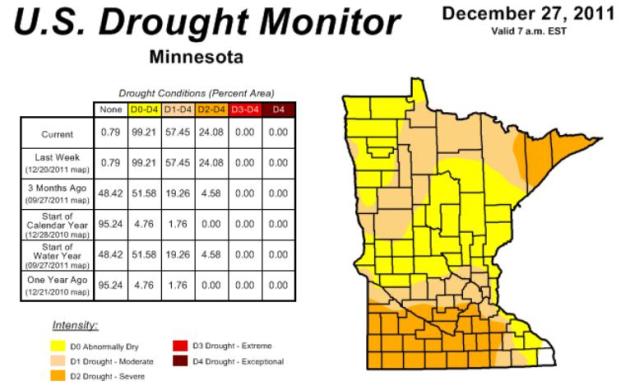
- The U. S. Drought Monitor depicts every Minnesota county as experiencing some level of drought. Large sections of north central and northeast Minnesota are said to be undergoing Severe Drought or Moderate Drought. The Drought Monitor also places a large portion of southern Minnesota in the Severe Drought or Moderate Drought categories.
- The present snow depth is well below the historical median in nearly every Minnesota county.
- Monthly mean temperatures for December 2011 were very warm, topping the historical average by six to twelve degrees across Minnesota. It was the third consecutive month of abnormally warm temperatures. The final quarter of 2011 was the warmest October through December period in 80 years.

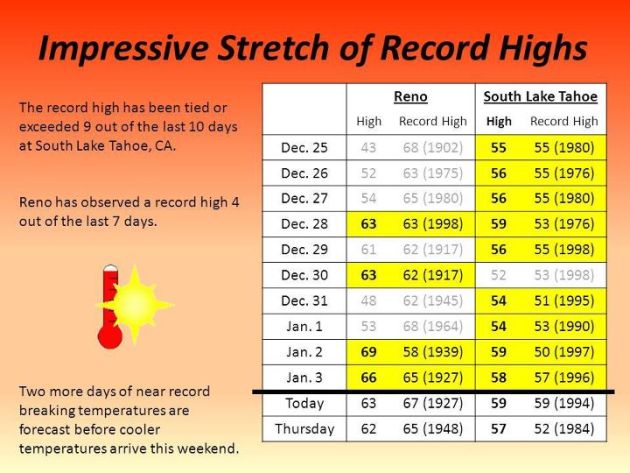
Waiting For Winter In Reno. From the Reno office of the National Weather Service (via Facebook): "A number of record high temperatures have been broken in the Reno area since Christmas Day. The record high has been tied or exceeded 9 out of the last 10 days at South Lake Tahoe, CA. At the Reno airport, a record high was observed 4 out of the last 7 days. Two more days of near record breaking temperatures are forecast before cooler temperatures arrive this weekend."
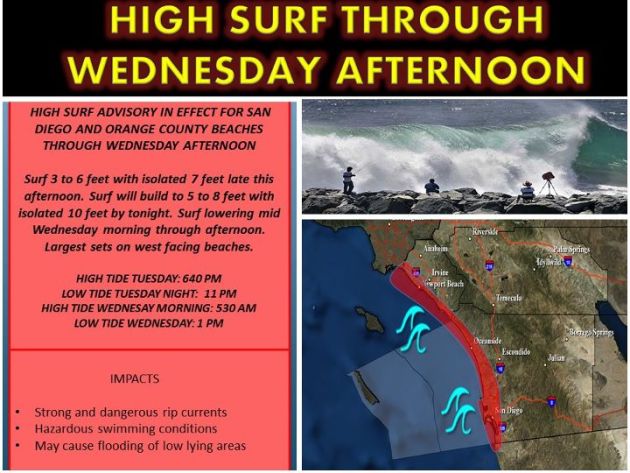
Surf's Up InSan Diego. 10 foot swells off the coast of La Jolla and Carlsbad? Surfers must be excited - evidence of big storms in the Gulf of Alaska traveling thousands of miles. Map courtesy of the San Diego office of the National Weather Service. "A storm system in the central north Pacific will generate large westerly swells through Wednesday morning over the San Diego coastal waters. Waves 3 to 6 feet are expected to develop this afternoon along west facing beaches, peaking at 5 to 8 feet with isolated sets to 10 feet overnight. Waves will decrease in magnitude mid-morning Wednesday through the afternoon. High surf is expected once again Thursday evening through Saturday."
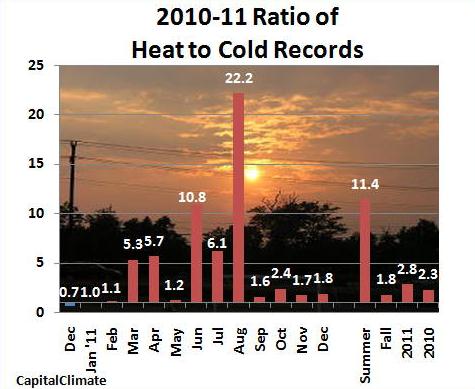
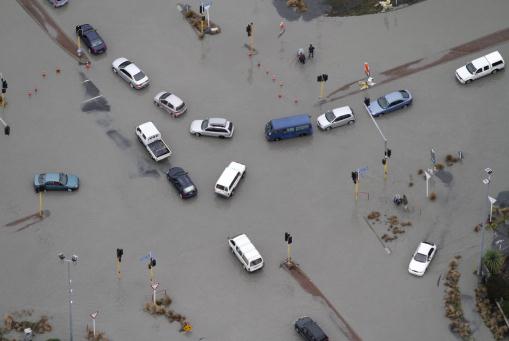
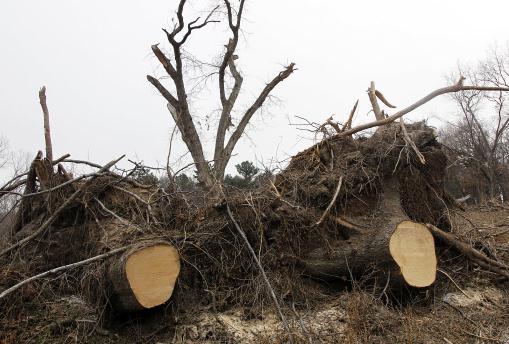
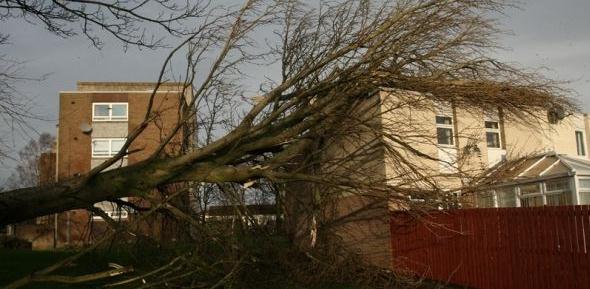
Photo credit above: "Cars are abandoned on a flooded street after a strong earthquake in suburban Christchurch, New Zealand, Tuesday, Feb. 22, 2011. The powerful earthquake collapsed buildings at the height of a busy workday killing at least 65 people and trapping dozens in one of the country's worst natural disasters. (AP Photo/New Zealand Herald, Mark Mitchell) NEW ZEALAND OUT, AUSTRALIA OUT."
Estimated Snow Cover Across USA As Of January 2 (source: NOAA's NOHRSC):
2012: 19%
2011: 48%
2012: 58%
2009: 38%
2008: 47%
2007: 41%


Paul's Conservation Minnesota Outlook for the Twin Cities and all of Minnesota:
TODAY: A touch of March in the air. Mild sun. Winds: SW 10-15. High: 46 (average high is 24). 50s are likely over southwestern MN, even a shot at 60 near Marshall and Windom.
THURSDAY NIGHT: Clear to partly cloudy, unusually mild - risk of a meteor shower. Low: 34
FRIDAY: Fading sun, balmy for January. Turning slightly cooler later in the day. High: 41
SATURDAY: Intervals of sun, a bit cooler - still well above average. Low: 24. High: 34
SUNDAY: Plenty of sun, still dry. Low: 23. High: 36
MONDAY: What month is this again? Mild sun. Low: 22. High: near 40
TUESDAY: Lingering sun, snow mostly gone. Low: 25. High: 42
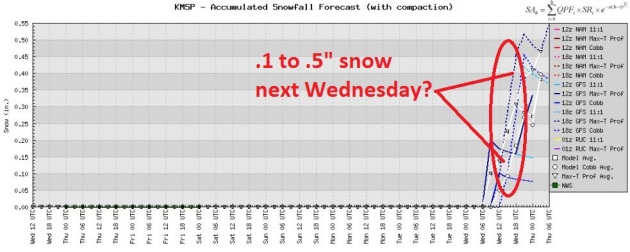
WEDNESDAY: Windy, colder. Flurries likely - dusting of snow? Low: 20. High: 26
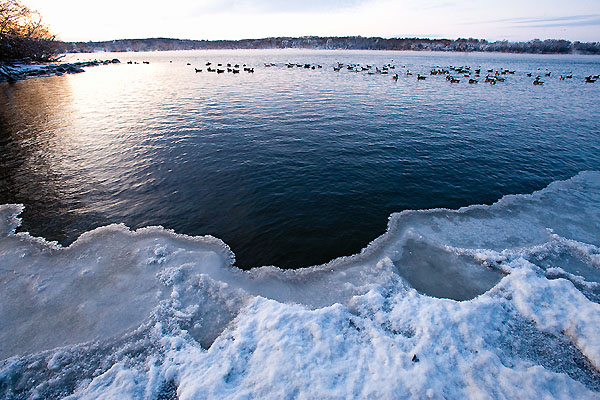
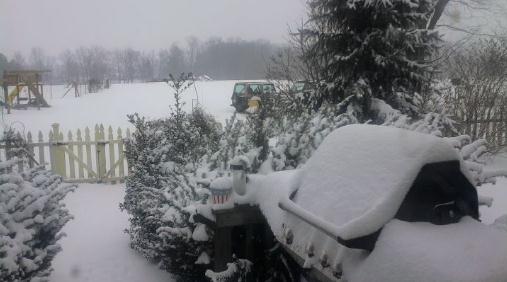
Reluctant Snowbirds
"January brings the snow, makes our feet and fingers glow" said Sara Coleridge. In theory, yes. Welcome to the coldest, snowiest month of the year in Minnesota, on average. This is the month that (allegedly) tests our collective souls; the month that separates the (snow) men from the snow birds, right? On paper, yes.
So far we've picked up a quarter as much snow as last winter, to date (10.3 vs 44.6 inches). According to the MN State Climate Office every county in the state is experiencing some level of drought. October thru December was the warmest period statewide in 80 years.
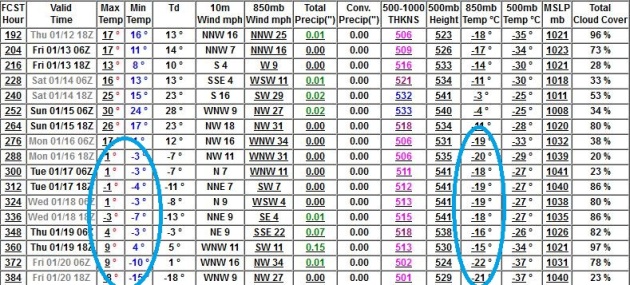
What's it going to take for a real storm? A fresh outbreak of bitter air. Although the first significant cold spell of winter is possible after January 17 I still don't see any major storms, or sustained subzero weather looking out 2-3 weeks. Beyond that the crystal ball gets murky, but keep in mind that average temperatures begin to rise again by Feb. 1.
Any snow in your yard will start to melt today as the mercury reaches the mid 40s - 20 degrees above average. Some thermometers over southwest and west central Minnesota will soar into the 50s; a rare January 60 degree high is not out of the question.
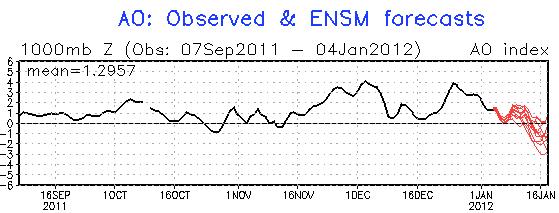
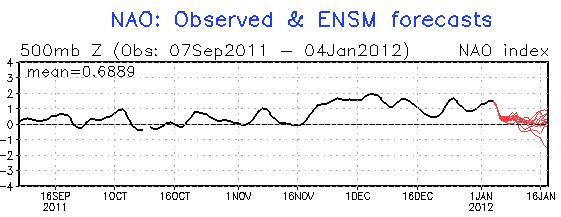
Until the AO and NAO (Arctic and North American Oscillations) go negative and powerful westerly winds subside, it'll be tough getting bitter air or snow into Minnesota.
In January. Surreal eh?
Top Climate Change Stories Of 2011. Andrew Freedman of the Washington Post's Capital Weather Gang has a very good summary of the top climate stories of last year. Here's an excerpt: "For Earth’s climate system, 2011 was an extraordinarily turbulent year. The United States saw a series of record-busting extremes, from a devastating tornado season to an epic drought in a vital agricultural region. The fusillade of extreme events kept global warming in the public conversation even as it slipped to the bottom of the public’s list of concerns in the face of a grim economy, and as “climate” became a four-letter word in Washington.
1. Advances in understanding global warming and extreme weather Two studies published in February in the journal Nature made it a lot clearer that manmade global warming is already playing a tangible role in influencing some types of extreme weather events. One study, led by researchers with Environment Canada, analyzed heavy rainfall events recorded at more than 6,000 sites across the Northern Hemisphere, and found that the growing amount of heat-trapping gases in the atmosphere have likely increased the frequency of heavy precipitation events across this region."
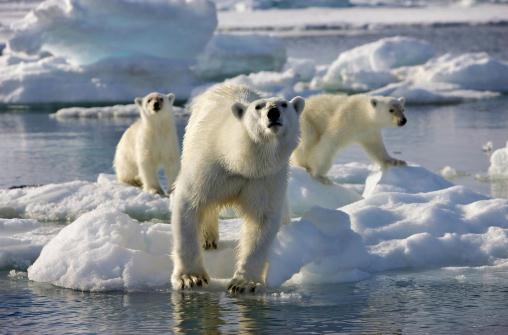
Photo credit above: "In this undated image released by Discovery Channel, a mother polar bear and two cubs are shown during the filming of Discovery Channel's documentary series "Frozen Planet," premiering March 18, 2012. The series will encompass seven episodes including a program on climate change hosted by David Attenborough. (AP Photo/Discovery Channel, Chadden Hunter)."


San Francisco Bay. I snapped this photo a few minutes after take-off from SFO at an altitude of 10,000 feet - downtown San Francisco near the center of the photo, Oakland in the foreground, Marin County to the upper right. It felt more like early October than early January when we left. No complaints, although the locals I talked to were very worried about what a dry, storm-free winter might mean for future water supplies.
I read your blogs everyday! Thanks for the info.
ReplyDelete