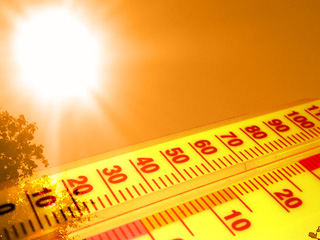
78 F. average high for June 12.
68 F. high temperature on June 12, 2011.
.96" rain predicted by Saturday morning at KMSP (00z NAM model).
Thursday: wettest day of the next 3 days.
Dew Point Forecast (NAM model):
55 F. Today
65 F. Thursday
66 F. Friday
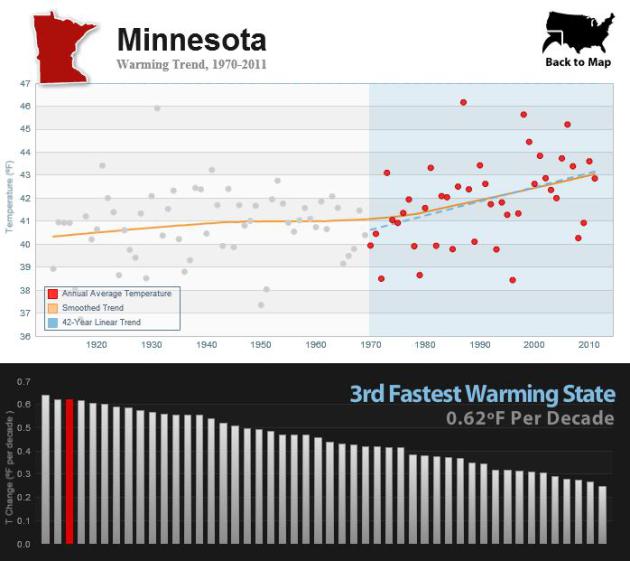
Minnesota: 3rd fastest warming state in the USA. The full story from Climate Central below.
El Nino Watch issued by CPC, NOAA's Climate Prediction Center, meaning a significant probability of a warm phase of the Pacific within 6 months. Details below from Bloomberg.
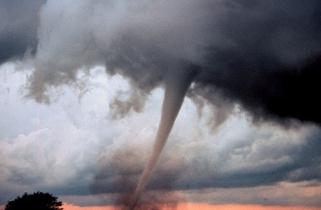
122 tornadoes touched down on America in May, fewest since accurate records began in 1954. Details below. Photo: NOAA.
0 tornado-related fatalities across the USA in May.
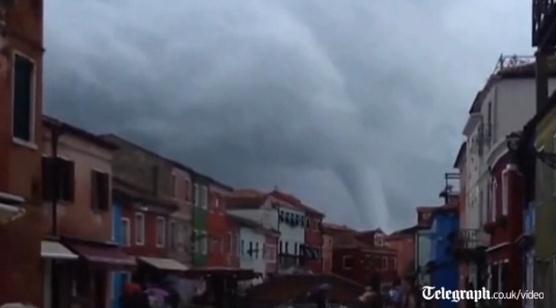
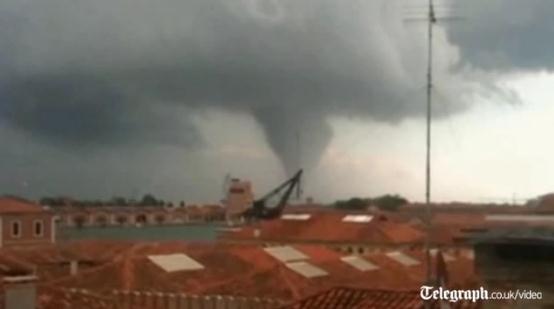
Tornadoes In Unusual Places: Venice, Italy. The Telegraph has more details (and amazing video) from the freakish tornado that swept across Venice on Tuesday: "The tornado roared through Sant’Erasmo island in Venice’s lagoon on Tuesday, ripping the roofs off at least 12 buildings, media reports said. A funnel cloud was clearly visible from the centre of the town and from its canals, Youreporter and Venice Municipality video showed. The tornado caused major damage in several islands off the Venice lagoon, including Sant’Elena and Certosa islands, where many trees were uprooted, reports said. Dozens of small sailing ships were smashed in the port of Sant’Elena. No injuries were reported, the Municipality of Venice said."
"Record and near-record warmth dominated the eastern two-thirds of the nation during spring," according to the National Climatic Data Center (NCDC) report. "Thirty-one states were record warm for the season. Only Oregon and Washington had spring temperatures near normal." - from a USA Today article; details below.

2.7% of America's electricity came from renewable sources in 2011. Details below.
$257 billion: amount of money spent on renewable energy worldwide in 2011, a new record. Solar made up over half of that amount, according to a Washington Post article; full details below.
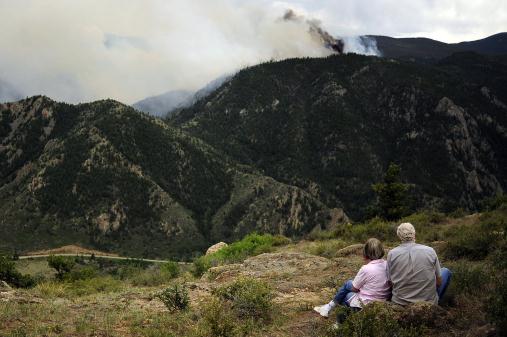
"In the long run, we found what most fear - increasing fire activity across large areas of the planet," lead author Max Moritz of the University of California-Berkeley." - from a Chicago Tribune/Reuters story below.
Photo credit: "Art and Carrol Newburn watch from Glacier View Meadows as the High Park fire burns west of Fort Collins, Colo., on Tuesday, June 12, 2012. The fire has now burned more than 40,000 acres, encompassing more than 65 square miles." (AP Photo/The Denver Post, Aaron Ontiveroz).
27 days above 100 F. so far this year in Phoenix. During an average year Phoenix experiences 109 days above 100!
2.13" rain in Charleston, South Carolina Tuesday, a new all-time rainfall record for June 12.
May Warmth Helps Shatter Spring Temperature Records. 39online.com has the story: "According to data released Thursday by the National Oceanic and Atmospheric Administration, U.S. temperatures have been high enough to make it the warmest spring on record, the warmest year-to-date and the warmest 12-month period as well. “This warmth is an example of what we would expect to see more often in a warming world. Understanding that the United States and the rest of the planet are warming along with preparing for eventualities like this is one way our nation can become climate-smart,” Deke Arndt, chief of the climate monitoring branch, National Climatic Data Center says..."
USA Had Warmest March - May On Record. Here's an excerpt from a story at USA Today: "The surreal heat that enveloped much of the USA this spring turned out to be the warmest ever recorded in U.S. history — by an eye-opening margin, scientists report. Coming on the heels of the fourth-warmest winter on record in the USA, nature and the economy were thrown off rhythm, as jobs, retail sales, crops and bugs sprouted outside their normal cycles. Though the calendar says we're still in spring, climatologists define spring as the months of March, April and May; weather records go back to 1895."
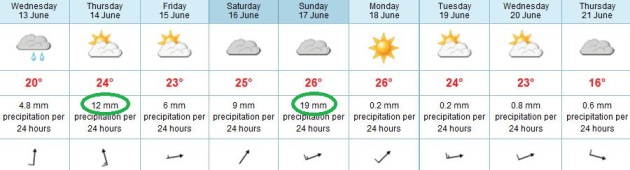
Trying To Pin Down Wettest Days. People ask me "Paul, I have a grad party between 2 pm and 5 pm Saturday. Will it rain at my house?" My answer: probably. Count on it and be pleasantly surprised if the storms hold off. If you don't rent the tent you provide a tempting target for Mother Nature, who has a twisted sense of humor. Right now the ECMWF model is suggesting that Thursday and Sunday will bring the most widespread T-storms and the heaviest rains.
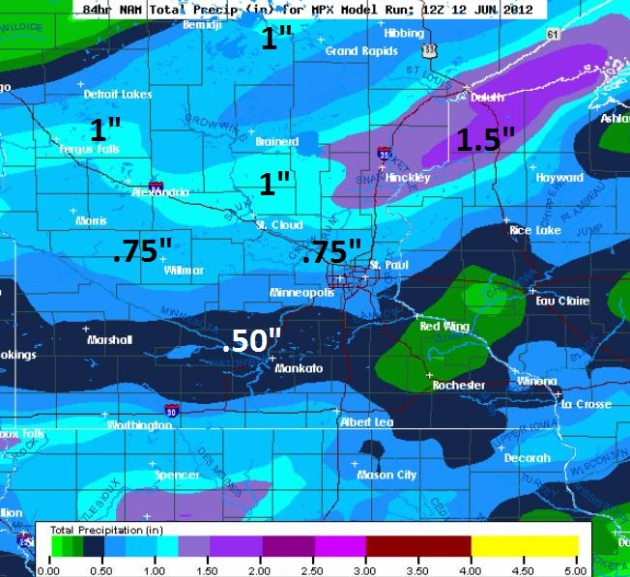
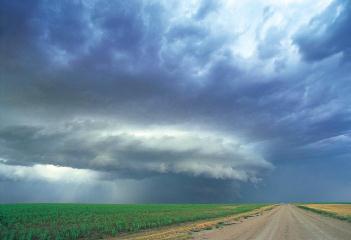
No Need To Water Anytime Soon. The 84-hour NAM model prints out the heaviest rainfall amounts (.75" to 1.5") over parts of central and northern Minnesota by Saturday morning. Map above: weathercaster.com.
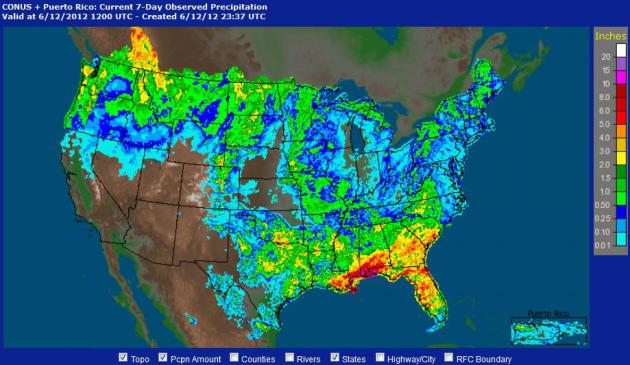
Week's Worth Of Rain. NOAA has an interactive map that shows rain for the last 24 hours, the last week, or a year into the past.
U.S. Issues El Nino Watch That May Affect Atlantic Storms. El Nino warming phases of the Pacific correlate with milder, drier winters for Minnesota - too early to panic (or celebrate). Details from Bloomberg: "An El Nino may form in the Pacific Ocean within six months, potentially crimping the number of Atlantic hurricanes while bringing rain to the drought-stricken U.S. South and drier weather in Asia. An El Nino watch was issued by the U.S. Climate Prediction Center in Camp Springs, Maryland, today because “there is a 50 percent chance” that the central Pacific will warm before the end of the year. The formation of an El Nino, a warming of the Pacific, can have major impact on U.S. weather and on energy and agriculture markets. The most immediate would be on the Atlantic hurricane season, which can produce threats to orange crops in Florida, the second-largest producer behind Brazil, and to energy production in the Gulf of Mexico."
* full details from CPC about the likelihood of an El Nino pattern returning to equatorial Pacific waters is here.
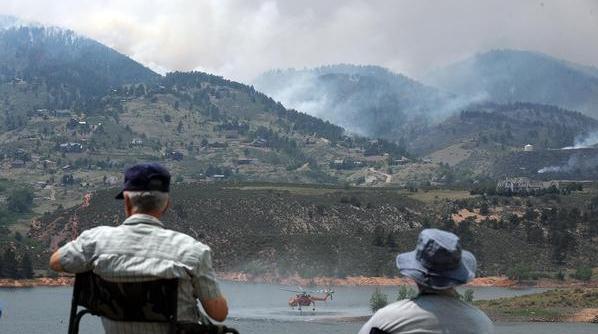
Photo credit above: "Evacuees of the High Park Fire view firefighting efforts from across Horsetooth Reservoir Monday afternoon." (Steve Nehf, The Denver Post)
Rains Worse Than Past Hurricanes For Some In Pensacola. 22" of rain - from a system that isn't a tropical storm or hurricane? Amazing. More from staugustine.com: "PENSACOLA — After surveying the damage Monday, Willie Betts said he’d gone through several hurricanes during his 25 years at Forest Creek Apartments but had never before been flooded out until a massive rainfall over the weekend. The 200-unit, low-income complex sustained the most serious damage from thunderstorms in the Pensacola area. The heavy rains also washed out a couple bridges and left hundreds, including Betts, at least temporarily homeless. Even 2004’s Hurricane Ivan, the most severe storm to strike Pensacola in about 70 years, didn’t flood his apartment although it did inundate some in lower-lying sections of the complex, Betts said."
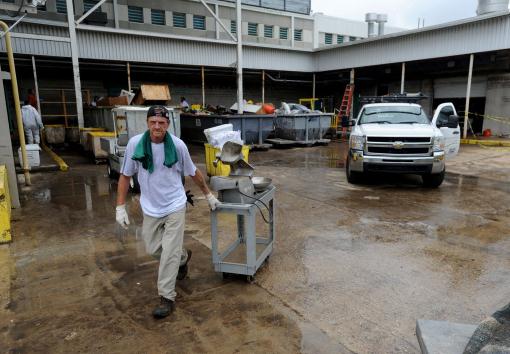
Photo credit above: "Workers clean up and throw out food from the Escambia County Jail, Monday, June 11, 2012, in Pensacola, Fla., after this weekend's heavy rain submerged the jail's basement. Floodwaters damaged the kitchen area, computer server room, muster and training area, as well as the laundry facility." (AP Photo/The Pensacola News Journal, Ben Twingley)
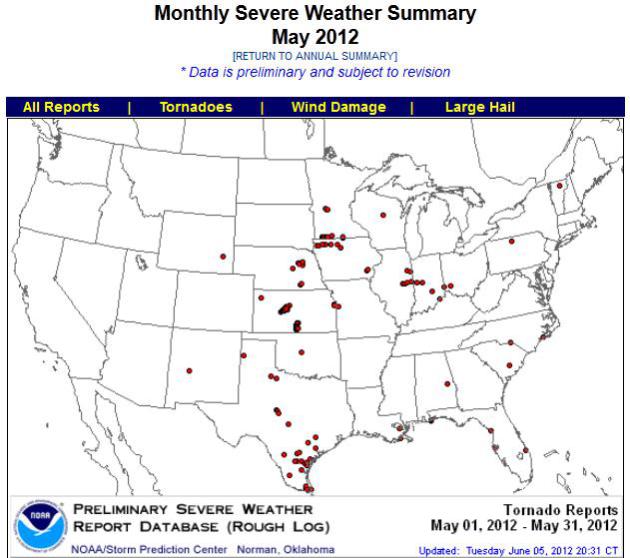
May 2012 Tornadoes : No Deaths Reported, NOAA Numbers Show. This is an amazing development, in light of the number of tornadoes that touched down last month. It's a testament to NOAA Doppler technology, timely warnings, TV meteorologists on the air narrating tornado outbreaks, and good 'ol fashioned luck. OurAmazingPlanet and Huffington Post have the details: "After 2011, one of the deadliest tornado years on record, 2012 is setting some tornado records worth celebrating: For the first time in seven years, tornadoes didn't kill a single person in the month of May. The month is typically a prime time for deadly twisters; the last time the month passed without a single tornado fatality was in 2005, according to numbers from the National Oceanic and Atmospheric Administration. The cheery figures reflect the remarkably low number of tornadoes that struck in May 2012, said Harold Brooks, a research meteorologist at NOAA's National Severe Storms Laboratory in Norman, Okla. "At the moment, it appears that this May had the lowest number of tornadoes since the time relatively good records began, in 1954," Brooks told OurAmazingPlanet."
* map above showing May tornado touchdowns courtesy of NOAA SPC.
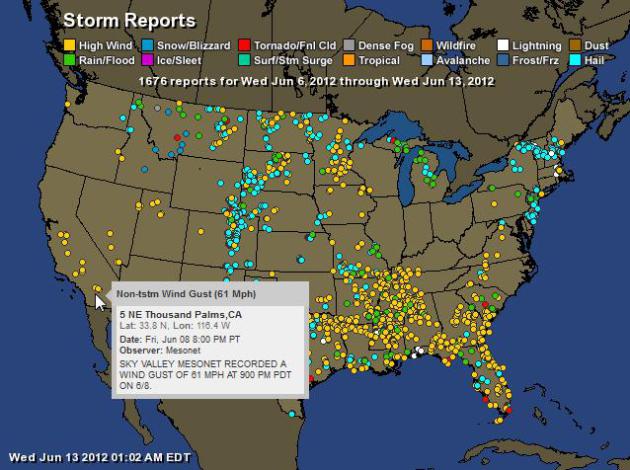
7 Day's Worth Of Storm Reports. Data from NOAA, interactive map courtesy of Ham Weather. Details:
| Total Storm Reports: | 1676 |
| Wind: | 801 |
| Rain: | 167 |
| Snow/Blizzard: | 9 |
| Tornado: | 41 |
| Fog: | 1 |
| Hail: | 625 |
| Lightning: | 17 |
| 14: | 1 |
| 16: | 2 |
| Tides: | 12 |

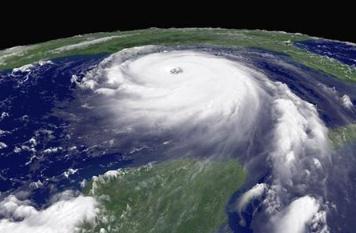
7 Unusual Tips For Hurricane Preparedness. Not something Minnesotans have to worry about (one of the few things), but many of us have friends and family living in Hurricane Alley. Utica's Observer-Dispatch has the story; here's an excerpt: "(ARA) - With hurricane season underway, those in the South and East are encouraged to revisit their hurricane preparedness plans. While stocking up on essential items - like food and water - and making necessary fixes - like boarding windows - are automatic actions for most, here are a few unique hurricane preparedness tips that homeowners might not normally think of.
* Buy a local/state map: Whether you are waiting out the storm or are forced to evacuate, a local and/or state map is essential. When the power goes out, your GPS might not be fully charged or fully functional, so a map will ease many headaches when either finding the quickest way out of town or getting around closed/blocked roads.
* Do your laundry and dishes ahead of time: Having all of your clothes, towels and dishes clean and ready to go will not only give you more resources during the storm, but you also won't have to worry about finding a place to wash them since you will have lots of clean ones on hand."
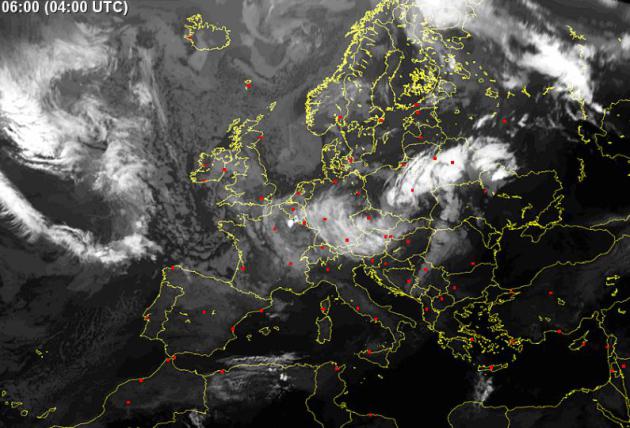
Flash Floods Cause Chaos As Britain Hit By Stormy Weather. Here's an excerpt from The Telegraph: "The sudden deluge in the first month of summer wreaked havoc in many areas, flooding homes, forcing schools and major roads to close and disrupting a hospital. On Tuesday morning, there was no sign that conditions were easing as authorities issued seven flood warnings - the second highest level of alert - across parts of London, the South East and East Anglia." Image: sat24.com.
Photo credit above: "Flooding is predicted for many areas of England and Wales." Photograph: David Cheskin/PA
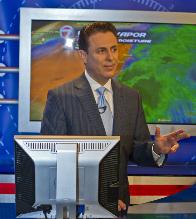
Photo credit above: "WSVN-Fox 7 meteorologist Phil Ferro." WSVN
Navy Pushes Global And Hurricane Forecast Improvements. Here's an interesting article from The Office of Naval Research and WeatherBug: "The U.S. Navy, with a fleet operating in every ocean of the world and a team of forecasters and field observers supporting them, is researching the links between the ocean and weather patterns around the world. The Navy focuses much of its weather-related research on tropical cyclones that form around the world, including hurricanes that develop in the southern Atlantic Ocean, Caribbean Sea and Gulf of Mexico. One promising real-time, high-resolution Navy computer forecast model has demonstrated better skill at forecasting storm track and strength than other computer model approaches currently utilized by the National Oceanic and Atmospheric Administration`s National Hurricane Center. "There is a concerted effort to link various atmospheric and oceanic models together to attain more accurate weather forecasts," said Dan Eleuterio, a program officer at the Office of Naval Research."
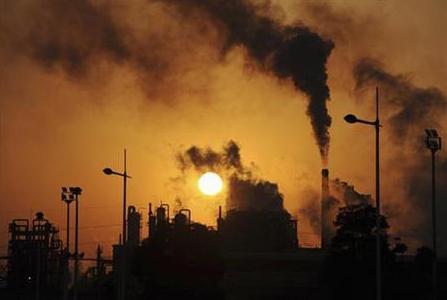
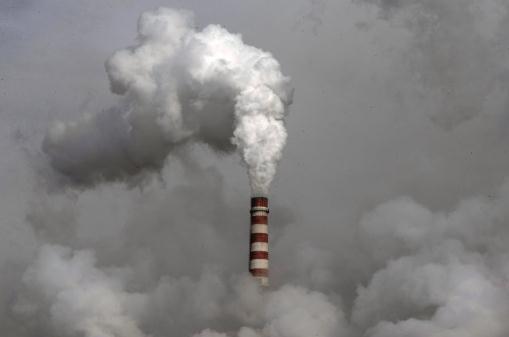
Air Pollution Increases Risk Of Repeated Cardiac Events. I'm appreciating Minnesota's (relatively) clean air more and more with each passing day (and story). Here's an excerpt of an article at Red Orbit that made be do a double-take: "In the study, cardiac patients who lived in areas with high pollution had a 40 percent higher chance of having a second heart attack as compared to patients who lived in places with low air pollution. The findings were presented at the San Diego Epidemiological Meeting of the American Heart Association in March and the Annual Meeting of the Israeli Heart Society in April."

- Pain and an increase in relative humidity during the previous day (P=0.004)"
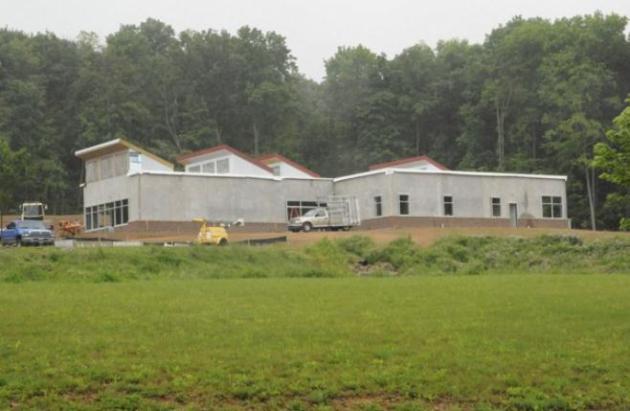
Photo credit above: Cumberland Times-News/Steven Bittner/Associated Press - "In this June 5, 2012 photo, construction continues on the Sustainable Energy Research Facility (SERF), a completely off-grid green building, at Frostburg State University in Frostburg, Md. The building will generate its own electricity from solar and wind power."
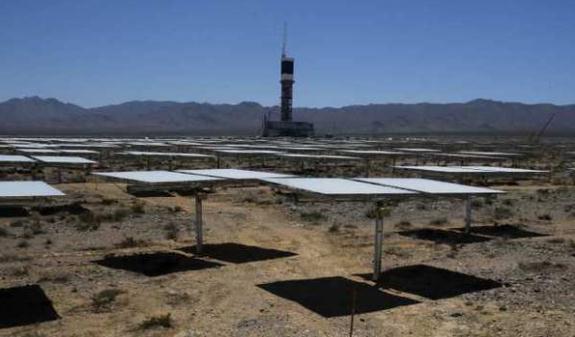
U.S. Still Lags Behind Other Nations In Share Of Renewable Energy. You don't think the entrenched fossil fuel industry has anything to do with this, do you? Details from The L.A. Times: "The U.S. still lagged behind other nations in 2011 in the share of energy it gets from renewable sources, in spite of a more than 300% increase in funding for green power projects over the last decade. That's the finding of a report released Monday by the Natural Resources Defense Council, which looked at green power efforts in both advanced and emerging economies around the world. European countries still have massive debt programs, double-dip recessions and fragile banking systems, but the NRDC found that those problems haven't stopped them from getting much higher percentages of their total energy production from renewable sources."
Photo credit above: "A solar electric power generating system collects energy In Ivanpah, Calif. Among nations, only China spent more than the U.S. on renewable energy projects in 2011." (Mark Boster / Los Angeles Times / May 22, 2012)


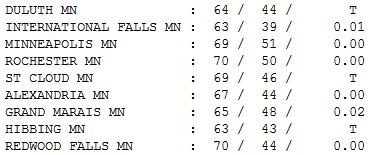
Fresh Air. I hope you had a chance to enjoy yesterday's touch of autumn, highs mostly in the 60s with dew points dipping into the 30s - like something you'd expect to see in late September or early October. Highs ranged from 63 at Hibbing and International Falls to 69 St. Cloud and the Twin Cities, 70 reported at Rochester and Redwood Falls.
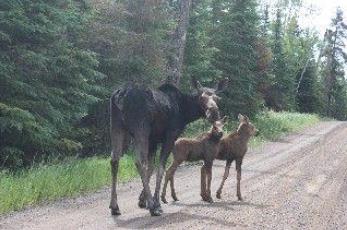
Baby Moose. Voyageur Canoe Outfitters provided this photo and explanation, via Facebook, of a mamma moose and her new cubs near Grand Marais: "New kids on the block- Voyageur's block anyway. Welcome baby moose!" http://ow.ly/i/GVRD
Paul's Conservation Minnesota Outlook for the Twin Cities and all of Minnesota:
TODAY: More clouds, passing shower or T-shower. Winds: SE 10-20. High: 74
WEDNESDAY NIGHT: More humid with a risk of a T-storm. Low: 61
THURSDAY: Wettest day. Muggy and unsettled. Heavier T-storms likely, a few downpours. Dew point: 65. High: 84
FRIDAY: Steamy sun, stray T-storm possible. Dew point: 67. Low: 68. High: 89
SATURDAY: Peeks of sun - tropical with heavy T-storms in the area. Dew point: 70. Winds: S 10-15. Low: 69. High: 87
FATHER'S DAY: Partly sunny and sticky - more strong T-storms. Dew point: 68. Winds: SW 10. Low: 70. High: 90
MONDAY: Heavy T-storms likely, heavy rain potential. Low: 69. High: 85
TUESDAY: Slightly cooler, showers up north. Low: 67. High: 82
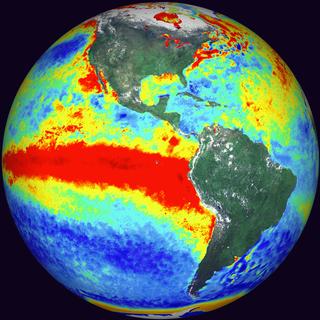
El Nino Watch
Yesterday Climate Central released a
comprehensive report, showing that 45 states have warmed significantly since
1912. Minnesota is the third fastest warming state in the USA, right behind
Arizona and Michigan. "The speed of warming across the lower
48 more than tripled, from 0.127°F per decade over the 100-year period, to
0.435°F per decade since 1970" the report says - details on the
blog.
Speaking of warming, NOAA's Climate Prediction Center has
issued an "El Nino Watch", meaning a high probability of a warming
phase of the Pacific within 6 months. These El Nino events correlate with warmer, drier winters for Minnesota. We'll see. Another
mild winter? Shocking news. Keep in mind last winter was the 4th warmest
on record for the USA, in spite of a moderate La Nina cooling phase. It
doesn't seem to matter whether we're in a La Nina (cooling) or El Nino
(warming) phase - it just keeps on warming, and the warming is
accelerating. If pointing that fact out makes me an "alarmist" then so
be it. The trends are a bit alarming.
May brought the fewest tornadoes nationwide
since accurate records were started back in 1954 (only 122) - with no fatalities reported. Good news indeed.
Our
September vacation is winding down. The arrival of warm, sticky air sets off a
stray shower today, heavier T-storms Thursday (wettest day in sight). We may see 90 by Friday.
Father's Day Weekend? T-storms
are likely Saturday and Sunday (a few hours of hard rain possible each day). Highs range from 85-90 F. 1-3" of rain may fall by Monday.
No need to
water anytime soon!
Climate Stories...
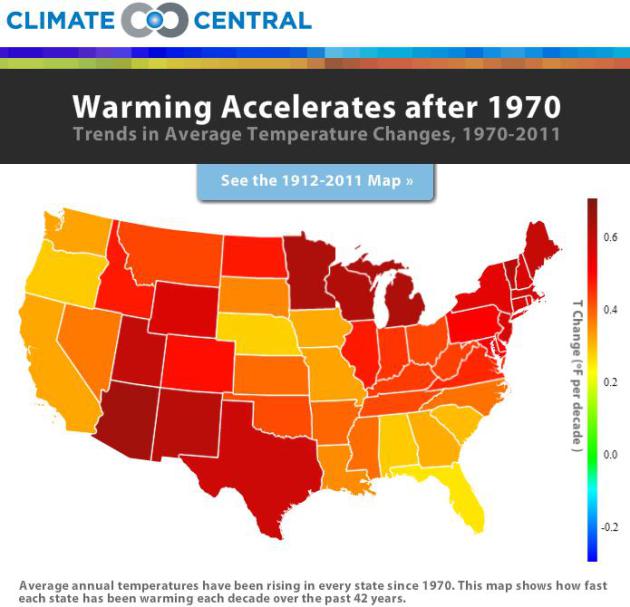
- Over the past 100 years, the top 10 states warmed 60 times faster than the bottom 10 (0.26°F per decade vs. 0.004°F per decade), when looking at average mean temperatures. During this timeframe, 45 states showed warming trends, although 21 were not statistically significant. Three states experienced a slight cooling trend.
- Since 1970, warming began accelerating everywhere. The speed of warming across the lower 48 more than tripled, from 0.127°F per decade over the 100-year period, to 0.435°F per decade since 1970, while the gap between the fast and slowly warming states narrowed significantly; the 10 fastest warming states heated up just twice as fast, not 60 times as fast as the 10 slowest warming states (0.60°F vs. 0.30°F per decade). Over the past 42 years 17 states warmed more than half a degree F per decade."
Global Warming - Yawn. How Bad Could It Possibly Get? Here's an excerpt from an article in Australia's Canberra Times: "...The scientific consensus is that we are still on track for 3 degrees of warming by 2100, but that's just warming caused by human greenhouse-gas emissions. The problem is that +3 degrees is well past the point where the major feedbacks kick in: natural phenomena triggered by our warming, like melting permafrost and the loss of Arctic sea-ice cover, that will add to the heating and that we cannot turn off. The trigger is actually around 2 degrees higher average global temperature. After that we lose control of the process: ending our own carbon-dioxide emissions would no longer be enough to stop the warming. We may end up trapped on an escalator heading up to +6 degrees with no way of getting off. And +6 degrees gives you the mass extinction."
File Photo credit above: (AP Photo/Andy Wong)
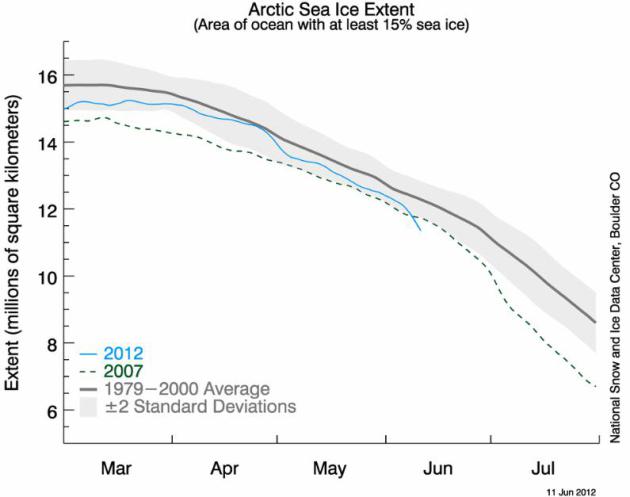
Alarming Trends. Latest data shows 2012 to be on track for the least Arctic ice on record, possibly breaking the old record (green dashed line) set in 2007. Source: NOAA's NSIDC.org.
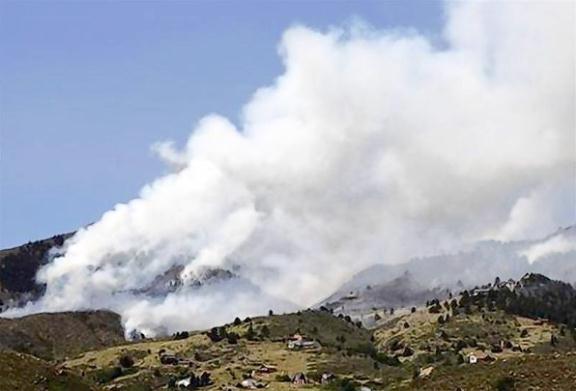
Photo credit above: "A huge plume of smoke rises from Colorado's High Park Fire, with dozens of homes visible in the foreground about 15 miles northwest of Fort Collins (June 12, 2012)." Chicago Tribune/Reuters.
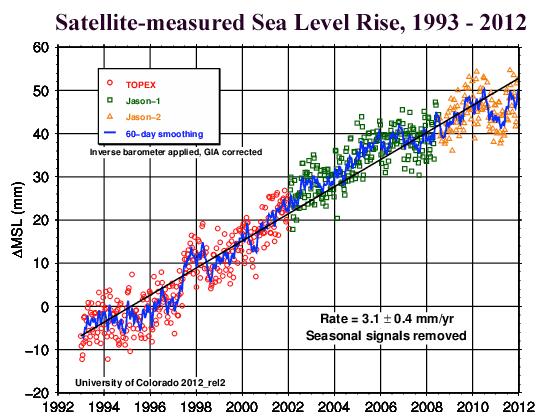
Image credit above: "Global sea level rise from 1992 - April 2012, as measured by three satellite instruments (TOPEX, Jason-1, and Jason-2.) Sea level rise has been relatively constant at about 3.1 mm per year (1.2 inches per decade) during this time period. The big downward dip during 2010 is due to the fact that year had a record amount of precipitation over land areas. By 2011, that precipitation had run-off into the oceans, bringing sea level back up again." Image credit: University of Colorado Sea Level Research Group. Courtesy: Weather Underground.
No comments:
Post a Comment