84 F. average high for July 7.
87 F. high temperature a year ago; July 7, 2011.
+12.6 F. The first week of July is running more than 12 F. above average at KMSP.
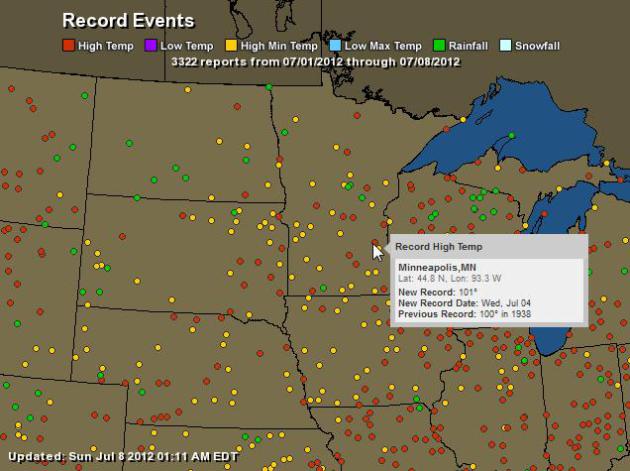
3,215 record highs, nationwide, in June.
13 counties in northeastern Minnesota declared Federal Disaster Areas. $108 million in damage to public property. Source: Star Tribune.
94 F. average temperature for the entire day, Saturday, at Washington Reagan Airport, averaging all 24 hours.
106 F. for one minute at DCA, Washington Reagan Airport Saturday, tying the all-time record for hottest reading ever observed in our nation's capital. Source: Capital Weather Gang.
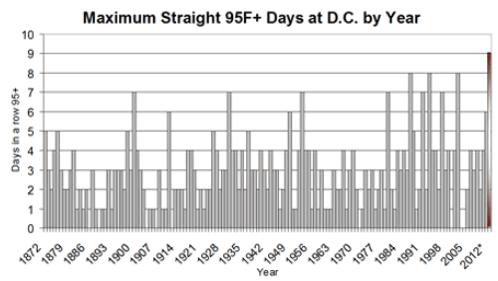
Graphic credit above: "Number of consecutive days at or above 95 degrees in Washington, D.C. since 1872." (Ian Livingston)
"The earliest reported reading of 100 F. in a calendar day was recorded yesterday, July 6, 2012...just before 12 pm noon EDT, or 11 am Eastern Standard Time. Previously the earliest record of a 100 F. reading in Washington D.C. was August 21, 1930 at noon EST, or 1 pm EDT. The most number of consecutive hours of 100 F or better in Washington is 7 hours. This has occurred twice...once on July 21, 1930 from noon to 6 pm EST...the other was yesterday, July 6, 2012 from noon to 6 pm EDT.

5:40 pm update: The
weather observer at National Airport reports the temperature did hit 106
F. for one minute. That would have tied D.C.'s all-time high, but it
has to last for at least 3 minutes to count. So today's
official high will go down as 105 F, breaking the previous July 7 record
of 102 F. in 2010. Also, Dulles tied its record high for the date with a
high of 101 F, while BWI broke its record high for the date with a high
of 103 F.
8:25 pm update: It's likely we've
established at least two additional records today at Reagan National. 1)
Highest low temperature for the date of 82, two degrees above the old
record of 80 from 2010 (assuming it doesn't drop below that before
midnight). 2). Highest average temperature for any calendar day on record (all-time) of 94 F.
wow.
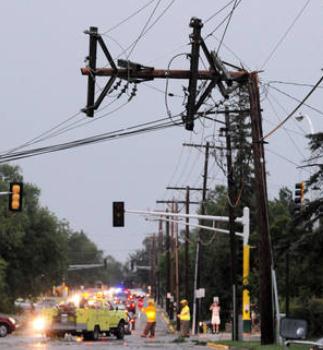
Photo credit above: Monte Draper/AP. "A
power pole is bent after severe storms hit the Bemidji, Minn., area on
Tuesday, knocking down thousands of trees and causing extensive damage
to utility lines. Thousands of customers were left without power."


Today's highlighted question is a good one: how do we (as meteorologists) grade ourselves? How does "verification" really work? Every meteorologist, to some degree or another, uses their own metrics to evaluate what they believe to be an accurate forecast. If you're withing 2-3 F. of the predicted temperature, that usually fits the definition of an accurate forecast. Precipitation is much trickier, especially in summer. If the forecast calls for "partly sunny with isolated thundershowers" and it doesn't rain at your house, but a town 10 miles away gets dumped on, is that an accurate forecast? All weather is local. Everyone cares about their home, their neighborhood, but during a typical summer afternoon it may only rain on 10-30% of the state.
"I read your narrative in the
StarTribune June 22, 2012 weather column. You stated that the national
accuracy for a 24-hour forecast is 87%. This prompted me to reach back
and read a paper I wrote in Feb 1999 that looked at a small slice of
weather data for the previous year. That paper was written in response
to similar accuracy questions I had at the time. I still have the same
questions today. For instance, what weather variable(s) does the 87%
refer to? - high temperatures, low temperatures, humidity (dew factor),
sun, wind, rain, etc?. Under what parameters is the accuracy
calculated?
I have attached the paper (Weather.docx) and and some supporting graphs (hi_lo_tm.xlsx) based on the data I collected. I know you are a very busy man, but I hope you will find time to read the paper and comment on my questions above."
Thank You,
Warren Banks
I have attached the paper (Weather.docx) and and some supporting graphs (hi_lo_tm.xlsx) based on the data I collected. I know you are a very busy man, but I hope you will find time to read the paper and comment on my questions above."
Thank You,
Warren Banks
Warren - thanks for your note and
the work you put into the white paper/spread sheet. The 87% number is
the generally agreed upon metric for 24 hour accuracy (averaging all
forecasts, NOAA and private sector). I can't find a paper or link to
support that number, but I've heard it batted around now for nearly 30
years - and (interestingly) ithat 87% number hasn't improved during that
period, in spite of (significant) gains for Day 2-7. I forwarded your
question to the local NWS office in Chanhassen and here is their
response:
In the past, verification was only done for specific points, and could be misleading on how the overall forecasts were performing across the entire area. For temperatures, a common metro we use to judge our accuracy is the measure of the percentage of the entire forecast area (evaluated at each grid point) for which the error is <3 degrees F. As an example, over the past 30 days, our forecasts (MPX) for our area for low temperature the following night (i.e. the forecast issued today for tomorrow night) have had an overall error of <3 degrees F for 70.1% of the area, with 0% having an error >10 F.
For the day seven forecast, over the past 30 days, the area with error of <3 F was 34.2% and the error of >10 degrees F was 11.7% These are just quick examples, but should give you some idea of things we commonly look at to quickly assess our accuracy with respect to temperatures. For the probability of precipitation, the thing we consider most frequently is the "reliability" metric, which essentially provides information on what percenage of the time a given probability occurs. Perfectly calibrated POP's would result in a situation when measurable precipitation occurs 20% of the time that 20% POPs are forecast, 50% of the time 50% POPs are forecast, and 100% of the time 100% POPs are forecast."
Tom Hulquist, NOAA (Twin Cities office)


1. You admire characters more for trying than for their successes.
2. Remember that what's interesting to an audience can be very different from what's fun to do as a writer."

"Those who win are producers, not consumers. The first thing you do each morning should be active, not passive– no Facebook, no email. Whatever you choose should put you in a state of mind for the rest of the day. Choose carefully.
The goals others set for you are usually wrong. The people who give them to you seem well meaning, and they have more experience, too. But your heart will guide you better than anyone. Find internal markers to know if what you’re doing is right.
If you do two things at once, one of them is getting done wrong. No matter how wrong you think this is, or how many exceptions you think there are… I sincerely doubt it."

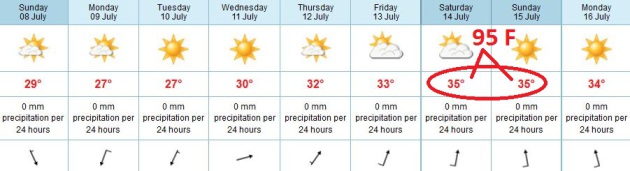
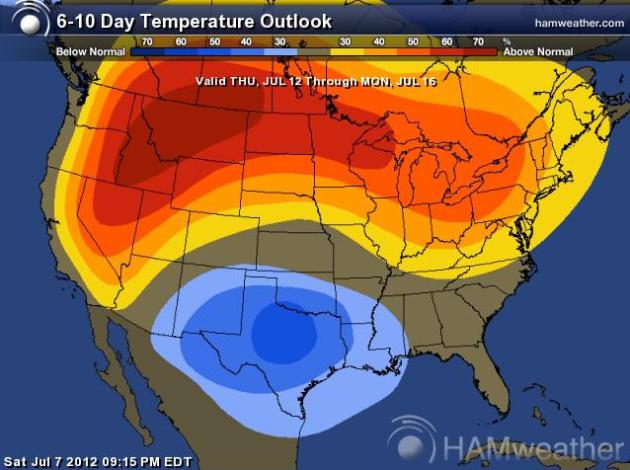
Paul's Conservation Minnesota Outlook for the Twin Cities and all of Minnesota:
TODAY: Plenty of warm sun - slight chance of an isolated shower up north late. Winds: NW 10-15. High: 88
SUNDAY NIGHT: Partly cloudy. Low: 64
MONDAY: Sunny, pleasant breeze. Dew point: 58. High: 85
TUESDAY: Warm sun, still dry. Dew point: 59. Low: 63. High: 86
WEDNESDAY: Hazy-blue sky, warmer. Low: 65. High: 88
THURSDAY: Partly sunny, sticky again. Dew point: 65. Low: 68. High: near 90
FRIDAY: Intervals of hazy sun, humid. Dew point: 68. Low: 70. High: 92
SATURDAY: Partly sunny and hot. Lake-worthy. Dew point: 70. Low: 72. High: 95

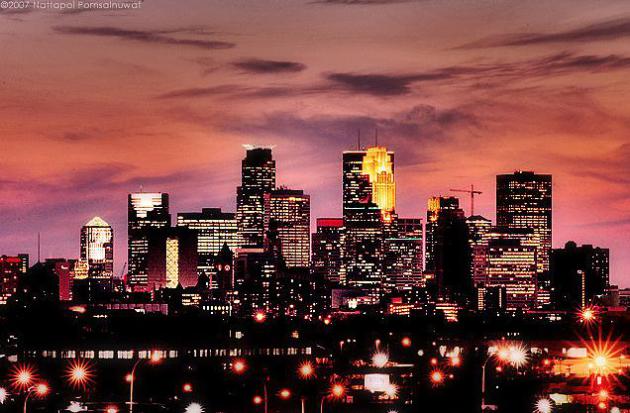
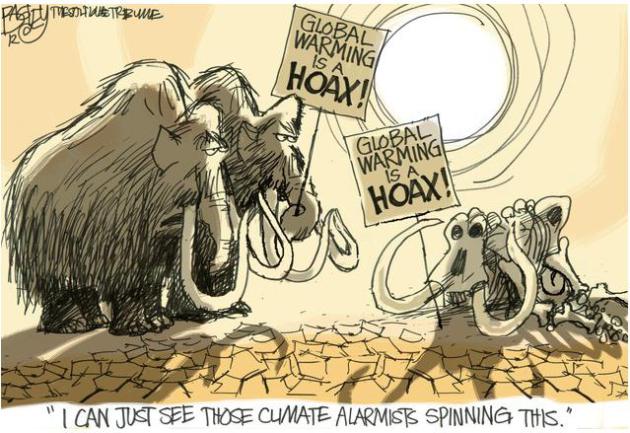
A Summer to Remember
This is the summer where 85 F became a "cool front".
Even some of my most skeptical friends are
beginning to have second thoughts about a warming atmosphere. They may
not believe peer-reviewed papers from climate scientists but they tend
to believe their own eyes.
How do you separate day to day changes in
weather from longer term climate trends? The sky overhead is running a
low-grade fever, and we can diagnose the symptoms: at least 240 ALL
TIME record highs in just the last 2 weeks, 2,346 record highs in the
last week, record low Arctic ice, 7 times more record highs than record
lows since January 1. 2012 will probably be the warmest year ever
recorded. The previous records: 2010 (warmest) and 2011 (second
warmest). Coming after the warmest winter.
The pace of records seems to be accelerating.
I sense we're only seeing the tip of the
iceberg; a chronic, low-grade climate emergency that will turbocharge
droughts, spike rainfall rates, and take our breath away.
Literally.
The climate scientists were right.
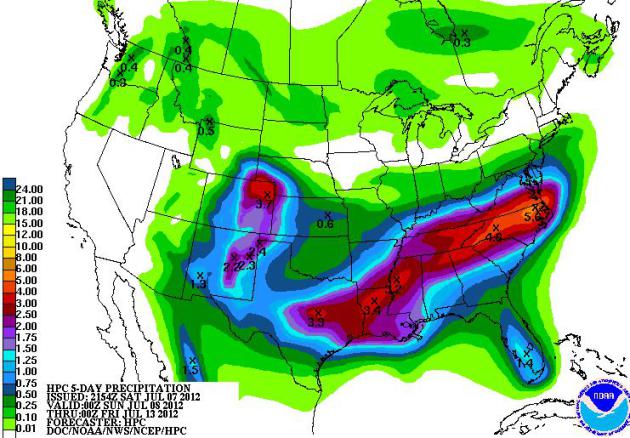
A stray T-shower may pop later today up north,
but this week looks unusually dry - no widespread, organized showers or
T-storms are in sight through the end of the week. 90 F returns by
Thursday; maybe mid-90s by next weekend?
Welcome to a long, hot summer.
October anyone?
* photo credit above: investmentwatchblog.com.

Heat waves and climate change
As heat-trapping emissions from burning coal and gas and destroying tropical forests continue to pile up in the atmosphere, the Earth’s average temperature increases and with it, the likelihood that extreme heat events will occur.
Over the last decade, the United States has set twice as many record highs as record lows. Because warmer air can hold more moisture, heat indices, which measure what it actually feels like to be outside, are also increasing. Meanwhile, the number of extreme heat events globally has increased and in the United States, there has been an increase in high-humidity heat waves characterized by high nighttime temperatures.
Cities are particularly vulnerable to extreme heat, in part, because dark, heat-absorbing asphalt and heat-trapping buildings are so prevalent. Over the past fifty years, smaller cities have seen extreme heat events increase by an average of almost six days per year, while larger cities have seen an increase of about 15 days.
Future projections of extreme heat nationally
According to a U.S. government scientific assessment, dramatically reducing emissions would limit average warming in the United States to between 4 and 7 degrees Fahrenheit by the end of the century. But staying on a business as usual path would lock in 7 to 11 degrees of warming. The assessment projected that staying on our current path would make extreme heat events that occurred just once every twenty years in the past happen every other year or annually throughout the country by the end of the century.
Over the very long term, higher temperatures could make it very difficult, if not impossible, for people to tolerate the outdoor heat during the hottest months of the years in many parts of the world. The emissions choices we make today will determine whether or not such scenarios will remain on the table.
Extreme heat is an economic and public health threat
People’s health is most at risk from basic heat stress, which can result in hospitalizations and death. Extreme heat is also a catalyst for increased ground-level ozone pollution -- or smog -- which can cause breathing problems and exacerbate asthma.
Heat also can drive spikes in energy demand as people crank up their air conditioners. During the 2011 heat wave, peak power prices in affected areas jumped from $100 per megawatt hour to $350. Such increases translate to hefty electricity bills for consumers. Additionally, heat stresses electricity grids, lowering their efficiency and increasing equipment failures.
When it comes to agriculture, extreme heat can dampen productivity for crops and cattle. Extreme heat can drag down yields for corn, soybean, wheat and cotton. For livestock, extreme heat can sap milk production as much as fifty percent, lower the rate at which livestock gain weight, and greatly reduce reproduction rates.
North America was hit hard in 2011, with the kind of heat wave that is more likely in a changing climate
For the United States, 2011 was the hottest summer since the Dust Bowl. Forty-two states had above-normal temperatures for the summer months and 4 states broke records for extreme summer heat. During a July heat wave, the National Weather Service had issued heat alerts for areas home to approximately 141 million people.
The National Climatic Data Center estimates that the combination of heat, wildfires and drought in the Southwest and Southern Plains resulted in $12 billion worth of damage, including damage to agricultural and livestock production.
Preparing for a future of heat stress
Americans can build resilience to climate change consequences and take aggressive measures to reduce our carbon emissions and the risks of climate change. Because a certain amount of climate change is already locked in for the next few decades, we will have to cope with the impacts of extreme heat on our daily lives, our health and on our economy. Preventative public health measures and local preparedness are critical for protecting public health and saving lives. But in order to effectively prepare for the impacts of climate change, we need a comprehensive national strategy to create climate-resilient communities and reduce the emissions that are driving climate change.
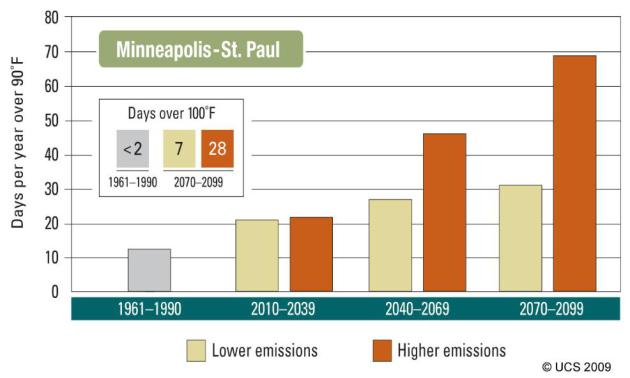
Extreme heat projections for select Midwest States and Cities
Confronting Climate Change in the U.S. Midwest, a 2009 UCS analysis, included heat projections for nine Midwest cities based on two future emissions scenarios. The analysis also included projections for how the summer-time climates of two states – Illinois and Michigan – would “migrate.” Below are summaries of that information and links to relevant charts and graphics.
By the end of the century, under a lower-emissions scenario Illinois’s summer-time climate is projected to be more like Arkansas and Louisiana’s while under a higher-emissions scenario it would more closely resemble Texas. Illinois “migrating state” map.
By the end of the century, under a lower-emissions scenario, Michigan’s summer-time climate is projected to resemble Tennessee, Missouri and Arkansas’ climate. Under a higher-emissions scenario, it would be more like Oklahoma’s. Michigan “migrating state” map.
Chicago:
Historically, Chicago has experienced an average of 15 days per summer over 90 and about 2 days per year over 100. Under the higher-emissions scenario, Chicago could experience more than 70 days above 90°F toward the end of the century and 30 days over 100. Under the lower-emissions scenario, the city would experience less than 40 days over 90 and 8 days over 100, on average.
Cincinnati:
Historically, Cincinnati has experienced an average of more than 18 days per summer with highs over 90 and less than 2 days over 100. Under the higher-emissions scenario, Cincinnati is projected to experience more than 85 days over 90°F—nearly the entire summer—and 29 days over 100 by the end of the century. Under the lower-emissions scenario, Cincinnati would experience less than 50 days over 90 and 8 days over 100, on average.
Cleveland:
Historically, Cleveland has experienced an average of 9 days per summer with highs over 90 and less than 1 day over 100. Under the higher-emissions scenario, Cleveland is projected to experience more than 60 days over 90 and 21 days over 100. Under the lower-emissions scenario, Cleveland would experience less than 30 days over 90 and 5 days over 100, on average.
Des Moines:
Historically, Des Moines has experienced an average of 22 days per summer over 90 and less than 2 days over 100. Under the higher-emissions scenario, Des Moines could experience more than 85 days above 90°F toward the end of the century and more than 30 days over 100. Under the lower-emissions scenario, the city would experience less than 50 days over 90 and only 9 days over 100, on average.
Detroit:
Historically, Detroit has experienced an average of 10 days per summer over 90 and less than 1 day over 100. Under the higher-emissions scenario, Detroit could experience almost 65 days per summer with highs above 90°F toward the end of the century and 23 days above 100. Under the lower emissions scenario, the city would experience less than 30 days above 90 and 5 days over 100, on average.
Indianapolis:
Historically, Indianapolis has experienced an average of 17 days per summer over 90 and less than 1 day over 100. Under the higher-emissions scenario, Indianapolis could experience over 80 days above 90°F toward the end of the century and 28 days over 100. Under the lower-emissions scenario, the city would experience 40 days over 90 and 7 days over 100, on average.
Milwaukee:
Historically, Milwaukee has experienced an average of 9 days per summer over 90 and less than 1 day per year over 100. Under the higher-emissions scenario, Milwaukee could experience more than 55 days per summer with highs above 90°F toward the end of the century and 22 days over 100. Under the lower-emissions scenario, the city would experience less than 30 days over 90 and 5 days over 100, on average.

Historically, Minneapolis/St. Paul has experienced an average of 12 days per summer over 90 and less than 2 days over 100. Under the higher-emissions scenario, the Twin Cities could experience nearly 70 days above 90°F toward the end of the century and 28 days over 100. Under the lower-emissions scenario, the Twin Cities would experience a little more than 30 days over 90 and 7 days over 100, on average.
St. Louis:
Historically, St. Louis has experienced an average of 36 days per summer above 90 degrees and less than 3 days over 100. Under the higher-emissions scenario, St. Louis could experience 105 days above 90°F toward the end of the century and 43 days above 100. Under the lower-emissions scenario, the city would experience a little more than 60 days over 90 and 11 days over 100, on average.
Aaron Huertas
Press Secretary, Union of Concerned Scientists
Washington D.C.
No comments:
Post a Comment