88 F. high Wednesday in the Twin Cities.
84 F. average high on July 11.
88 F. high temperature on July 11, 2011.
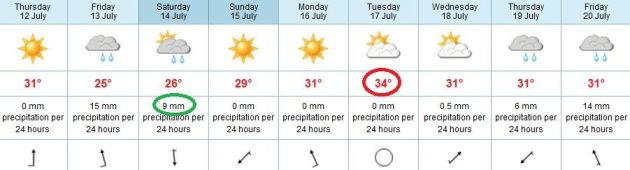
.31" predicted rainfall for MSP (NAM model). The best chance of showers and T-storms: Friday evening/night.
July 13: historically the hottest day of the year in
the Twin Cities. Average high temperatures plateau at 84 F. from July 6
to July 21. Data:
Minnesota Climatology Working Group.
June 25: last day the Twin Cities experienced a below-average high temperature (77 F.)
European Model. Low 90s are likely today, slightly
cooler (muggier) weather Friday and Saturday with scattered T-storms. A
couple hours of rain are possible Saturday - Sunday looks like the
sunnier, drier, hotter day of the weekend. The ECMWF is hinting at mid
90s by next Tuesday, highs near 90 nearly every day from today through
next Friday.
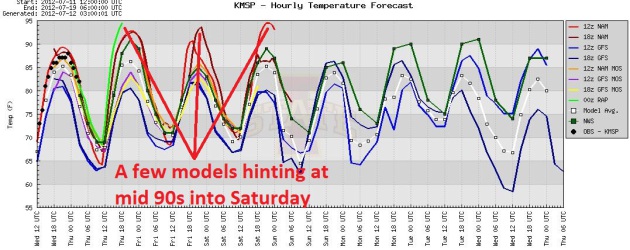
High Bust Potential. I'm saying low 90s today, a
slight cooling trend Friday and Saturday (accounting for more clouds and
a few T-storms nearby). But the latest computer ensemble is suggesting
that I may be too conservative with my temperature forecast. More than
one model is suggesting low to mid 90s each of the next 3 days. They may
be right - all the (American) models have been consistently busting in
recent weeks - actual temperatures have been 3-6 F. warmer than
predicted by the NAM, RAP and GFS. 90s are likely today; if the sun
stays out for a few hours Friday and Saturday (very possible) we could
top 90 those days as well. The big difference: by Friday and Saturday
dew points will approach or surpass 70, making it feel sauna-like again.
Ugh.
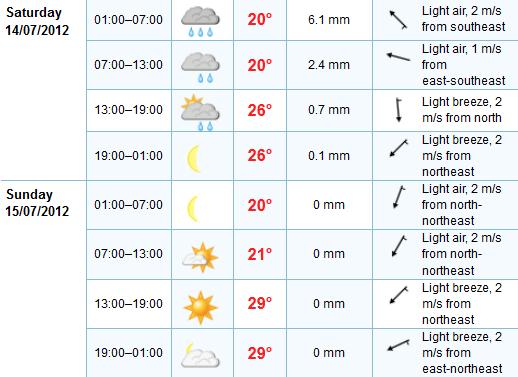
Weekend Details. The ECMWF suggests the best chance
of showers and T-storms will come Saturday morning and midday, enough
afternoon sun for highs in the upper 80s. The sun should be out most of
the day Sunday with highs ranging from 88 to 92 F.
An Olympic-Size Wash-Out? The extended forecast for London calls for more rain and potential flooding. Details below.
"
Presently we’re breaking high temperature records much
more frequently than by chance. And, by some estimates, the ratio of
that exceedance of breaking highs compared to what you would expect by
chance would lead to us say to that there’s about an 80 percent chance
that the record high you experienced was due to climate change.” - from a Washington Post story focused on climate change increasing the odds of extreme weather, including severe heat waves.
"
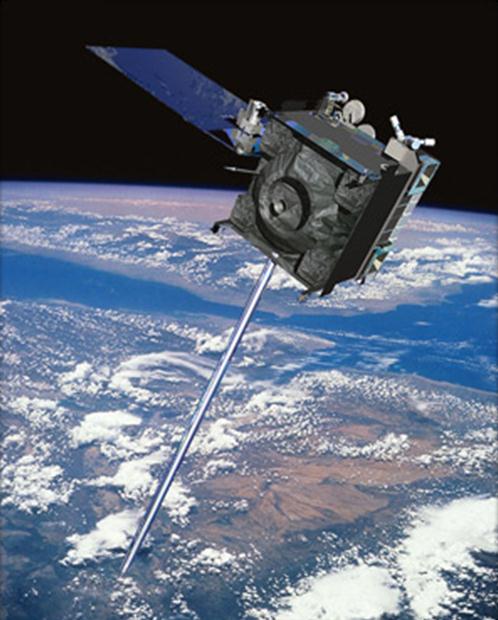
Meteorologist Jeff Masters puts it this
way: “These are ridiculously long odds, and it is highly unlikely that
the extremity of the heat during the past 13 months could have
occurred without a warming climate.” - from a Washington Post story, details below. Image above: NASA.
"
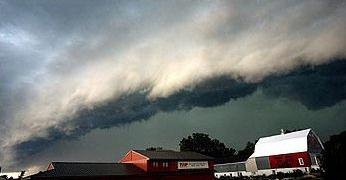
As Michael Oppenheimer,
a Princeton University climate scientist and the lead author of the
report, said: “A hotter, moister atmosphere is an atmosphere primed to
trigger disasters.” - from a New York Times story; details below. Photo: NOAA.
"Our weather is the
brush stroke that makes up the bigger, grander picture of our climate.
To fully understand and comprehend the climate, one must see the
totality of events and look beyond a speck in time and space to see the
grand scale." - from an editorial at Tulsa World; details below.
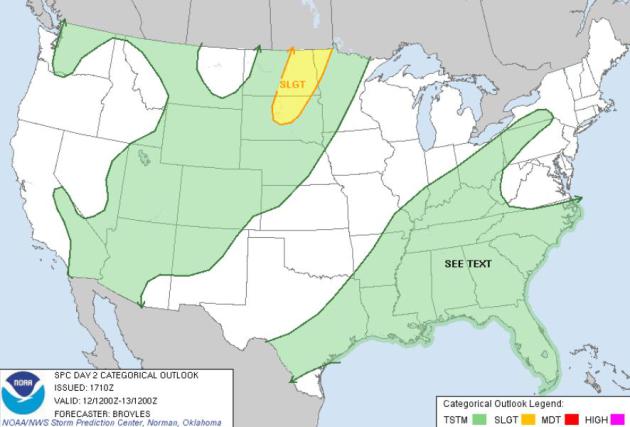
Thursday Severe Risk. A few storms over the Dakotas
and Minnesota's Red River Valley may exceed severe limits (1"+ hail
and/or wind gusts over 58 mph wind gusts). Map courtesy of SPC.
Heating Up. Here's an excerpt of an Op-Ed at
The New York Times: "
Many
politicians and a vocal minority of scientists dispute such
predictions as alarmist. What they cannot dispute are the numbers.
According to the National Oceanic and Atmospheric Administration, the 11 years from 2001-11 rank among the 13 warmest globally
since record-keeping began 132 years ago. The average temperature in
the contiguous United States for the first six months of this year, the National Climatic Data Center reported on Monday, were the hottest recorded since 1895."
NASA Scientist: 80% Chance Recent Heat Records Due To Climate Change. Fun with statistics and probabilities. The Washington Post's meteorologist Jason Samenow conducted an
interview with NOAA's Martin Hoerling; here's an excerpt of the transcript (video after the link): "
What
Hoerling had to say about climate change and record-setting
temperatures was fascinating. He makes a compelling case that
human-caused climate change isn’t causing heat waves, but - in many
instances - adding to their intensity. Consider these excerpts from his
commentary, about 34-38 minutes into the 60 minute panel discussion.
“....the globally averaged temperature of the planet has risen beyond
any doubt beyond where you would expect ... with natural variability
alone..... On the heat wave story. Sometimes you’ll see ‘that heat wave
was due to climate change’ That’s not a very accurate statement, not a
very helpful statement. But it’s not entirely untrue either.”
Graphic credit above:
Above: Google hangout to discuss
climate change and severe weather. Stanford Professor Noah Diffenbaugh
is joined by Harold Brooks of the NOAA National Severe Storms Lab,
Martin Hoerling of the NOAA Earth System Research Lab, Angela Fritz of
Weather Underground, Dave Metz of the FM3 opinion research firm, and
Jason Samenow of the Washington Post.
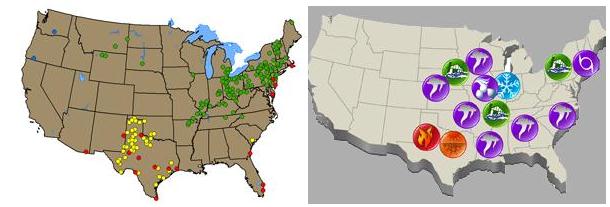
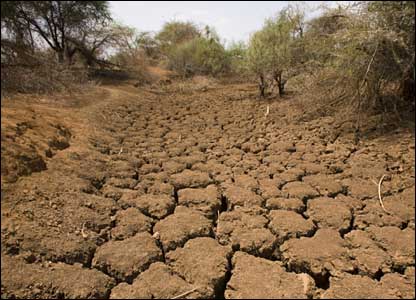
Historic Texas/Oklahoma Drought of 2011: 20 Times More Likely To Occur Due To Man-Made Greenhouse Gases. Here's a recap of 2011 across the USA from
NOAA,
including details of the (record) 14 separate billion dollar weather
disasters. Amazingly, 2012 may wind up even more extreme: "
According
to NOAA scientists, 2011 was a record-breaking year for climate
extremes, as much of the United States faced historic levels of heat,
precipitation, flooding and severe weather, while La Niña events at
both ends of the year impacted weather patterns at home and around the
world."
Caption upper left: "
Selected Annual Climate Records for
2011 - Green dots show the wettest, yellow dots the driest, red dots
the warmest and blue dots the coolest records."
Caption upper right: "
From extreme drought, heat
waves and floods to unprecedented tornado outbreaks, hurricanes,
wildfires and winter storms, a record 14 weather and climate disasters
in 2011 each caused $1 billion or more in damages — and most
regrettably, loss of human lives and property."
Global Warming Tied To Risk Of Weather Extremes.
More on how researchers came to the conclusion that manmade greenhouse
gases are increasing the intensity of weather extremes, including
drought, heatwaves and flash floods, from
ABC News; here's an excerpt: "...
But
beyond that, the scientists wondered, would global warming affect the
chances of such an event happening? To find out, they studied computer
climate simulations for La Nina years, focusing on Texas. They compared
the outcome of three such years in the 1960s with that of 2008. They
used 2008 because their deadline for the study didn't allow enough time
to generate thousands of new simulations with fresh data from 2011.
The two years were similar in having a La Nina and in amounts of
greenhouse gases in the air."
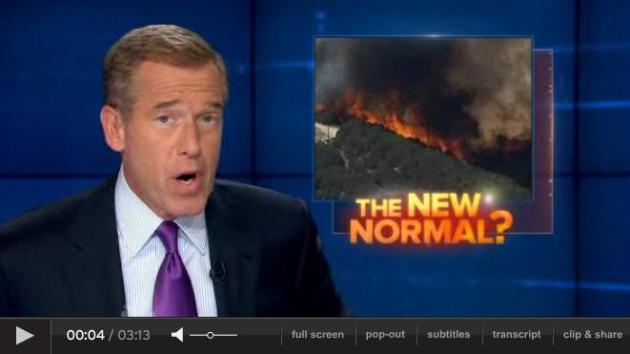
The New Normal? Brian Williams had a recap of the new studies on the NBC Nightly News Tuesday - the video is
here.
Climate Change, Extreme Weather Linked In Studies Examining Texas Drought And U.K. Heat. Another angle from Reuters and
Huffington Post: "....
Every
weather event that happens now takes place in the context of a
changing global environment," Deputy NOAA Administrator Kathryn
Sullivan said in a statement. "This annual report provides scientists
and citizens alike with an analysis of what has happened so we can all
prepare for what is to come." Beyond measuring what happened in 2011, the
international team of scientists aimed to start answering a question
weather-watchers have been asking for years: can climate change be
shown to be responsible for specific weather events? The climate
experts acknowledged that event attribution science, as it is called,
is in its early stages. "Currently, attribution of single extreme events to
anthropogenic climate change remains challenging," Peterson, Stott and
other scientists wrote in a study published in the Bulletin of the
American Meteorological Society."
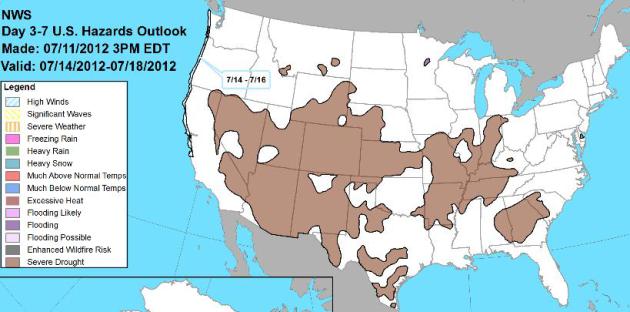
Severe Drought. 56% of America is suffering through
drought; farmers in the Ohio Valley are comparing this dry spell to
1988. God-willing it won't get that bad. All the brown-shaded areas are
suffering from severe drought. Map courtesy of
NOAA.
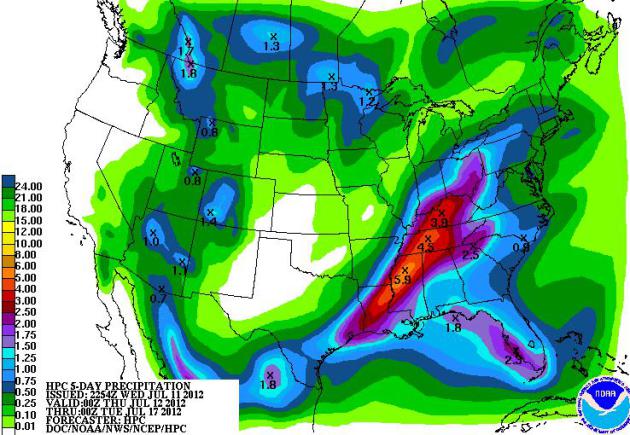
QPF. NOAA HPC's
5-day rainfall prediction
shows some 3-6" amounts from Louisiana into the Ohio Valley, helping
with the drought conditions. Dry weather is likely for the southern
Plains and the far west - some .5 to 1" amounts possible across far
northern Minnesota and northwestern Wisconsin.
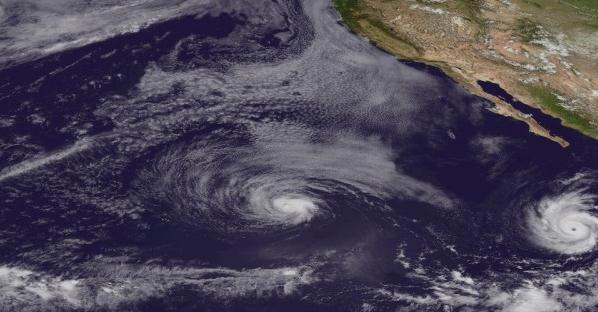
View From Space: Hurricanes Daniel And Emilia.
Earthsky.org
has a terrific article about weather satellites; how they've
revolutionized the tracking and prediction of hurricanes from space.
Just think, before the first (Tiros 1) weather satellite launched in
1961 hurricane forecasters relied on ship reports to have any inkling
where these 500 mile wide storms were located! Here's an excerpt:
"
Question: What’s better than looking at satellite imagery of powerful hurricanes?
Answer: Knowing they are harmless storms that will not affect
anyone. The 2012 Eastern Pacific hurricane season has been heating up
lately as areas of low pressure have been developing this past week. Two named storms have already formed and peaked in intensity:
Hurricane Daniel and Hurricane Emilia. Hurricane Daniel, the third
hurricane of the 2012 eastern Pacific hurricane season, generated over
this weekend and peaked in intensity with sustained winds of 115 miles
per hour. Hurricane Emilia, which formed into the fourth hurricane of
the 2012 Eastern Pacific Hurricane season on July 9, 2012, became much
stronger with sustained winds of 140 mph (Category 4 storm). Check out
these amazing satellite images taken by NASA of these violent, yet
harmless storms."
Image credit above: "
Visible satellite imagery from NOAA showing twin storms in the eastern Pacific Ocean: Daniel and Emilia." Image Credit: NOAA.
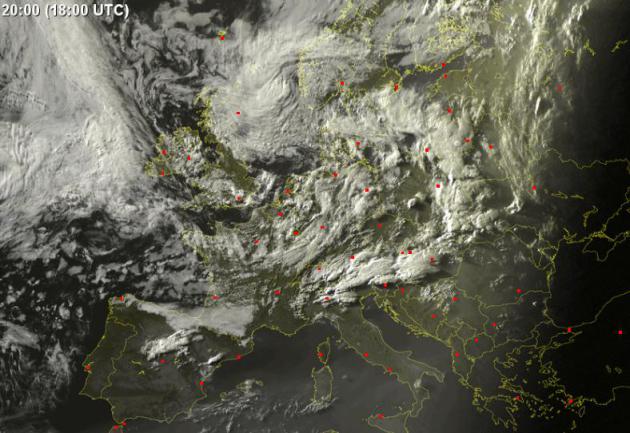
Further Flood Misery Expected As Torrential Rain Forecast For Sodden U.K.
No, this doesn't bode well for The Olympics, but I believe in miracles.
Is Mother Nature a sports fan? We're about to find out. Here's an
excerpt from
The Guardian: "
Britain's
rain-sodden summer shows no sign of mending its miserable ways, with
another day of thunderstorms and torrential downpours expected on
Wednesday. Forecasters are predicting that up to 15mm of rain could fall
in an hour in some places as the period of unseasonably wet weather that has brought flooding
up and down the country drags on. The Environment Agency has three
flood warnings – one in the south-west and two in the Midlands – and 26
flood alerts in place across England, while the Met Office has issued
an amber warning of rain for south-eastern areas of Scotland and yellow
warnings across large swaths of southern and northern England."
* visible satellite image above courtesy of
sat24.com.
Atmospheric Art. Check out the swirls in a maritime
cloud formation downwind of a small island chain in the Pacific - and
the "glory", a rainbow-like effect running from top to bottom across the
satellite image. Details from
NASA MODIS: "
A layer of stratocumulus clouds over the Pacific Ocean served as
the backdrop for this rainbow-like optical phenomenon known as a glory.
Glories generally appear as concentric rings of color in front of mist
or fog. They form when water droplets within clouds scatter sunlight
back toward a source of illumination (in this case the Sun). The
Moderate Resolution Imaging Spectroradiometer (MODIS) on NASA’s Terra
satellite acquired the image on June 21, 2012. The glory can be seen
running in a north to south arc above the clouds west of the swirling
von karman vortices that trail through the clouds on the lee side of
Guadalupe Island. The image was saturation-enhanced to make the glory
effect more visible."
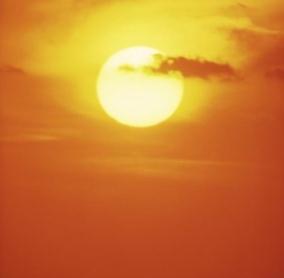
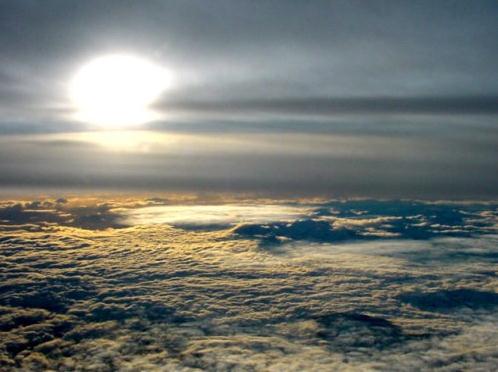
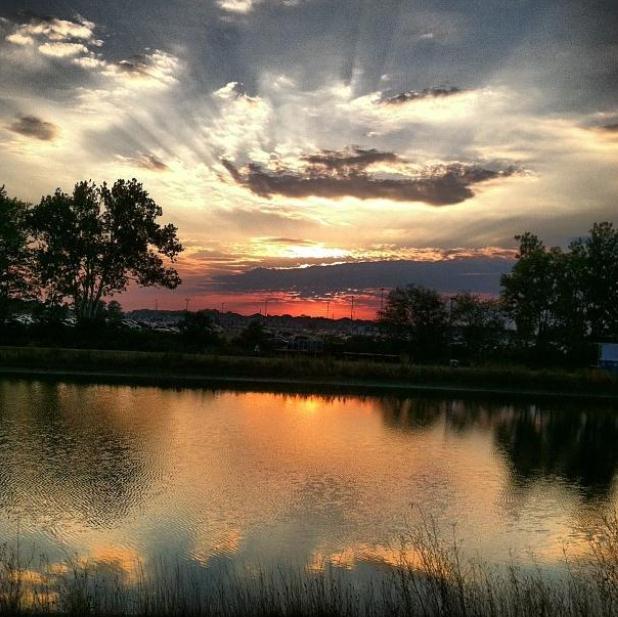
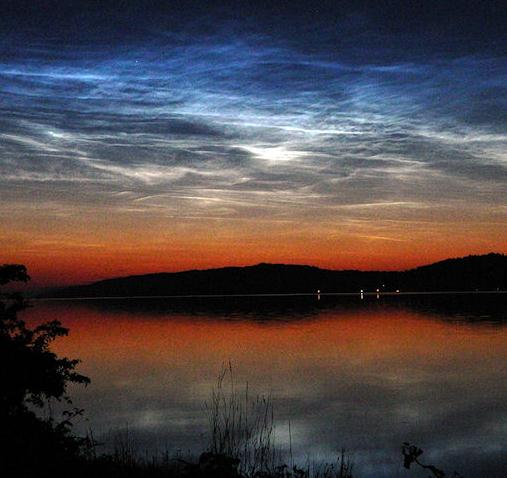
Photo Of The Day. Thanks to Danny Kurily who snapped this terrific sunset shot in Noblesville, Indiana.
Is The Web Driving Us Mad? The short answer is yes.
An emphatic yes. Be honest - do you know anyone who isn't drowning in
data? But wait, a tweet just came in I need to respond to, and
here...um...let me respond to this insightful FB post. I just checked my
latest e-mails (I get a visceral thrill when there's nothing new in my
In-Box)...sorry...here is an excerpt from a must-read article at
Newsweek, reprinted at
The Daily Beast: "...
Questions
about the Internet’s deleterious effects on the mind are at least as
old as hyperlinks. But even among Web skeptics, the idea that a new
technology might influence how we think and feel—let alone contribute
to a great American crack-up—was considered silly and naive, like
waving a cane at electric light or blaming the television for kids
these days. Instead, the Internet was seen as just another medium, a
delivery system, not a diabolical machine. It made people happier and
more productive. And where was the proof otherwise? Now, however, the
proof is starting to pile up. The first good, peer-reviewed research is
emerging, and the picture is much gloomier than the trumpet blasts of
Web utopians have allowed. The current incarnation of the
Internet—portable, social, accelerated, and all-pervasive—may be making
us not just dumber or lonelier but more depressed and anxious, prone
to obsessive-compulsive and attention-deficit disorders, even outright
psychotic. Our digitized minds can scan like those of drug addicts, and normal people are breaking down in sad and seemingly new ways."
American's Confidence In TV News At All-Time Low. Some humbling news for the TV news industry; here's an excerpt from
TVSpy: "
Americans’ confidence in television news has never been lower, according to a new Gallup poll.
Only 21% of adults polled expressed a great deal or quite a lot of
confidence in TV news. That’s the lowest percentage ever registered by
Gallup since the organization began tracking confidence in TV news in
1993. Last year, the figure was 27%. Gallup conducted its annual survey
on confidence in U.S. institutions in early June and the organization
points out that the latest findings preceded the erroneous initial reports from CNN and Fox News about the U.S. Supreme Court’s recent health care ruling."
Hybrid Series iPhone Case Features Removable USB Drive. For the iPhone (addict) who has (almost) everything; details from
gizmag.com: "
A
lot of people like the idea of being able to carry things like photo
or video files with them on their iPhone, but depending on what
capacity model they have, may not necessarily want to take up memory on
the phone with those files. That’s where ego & company’s Hybrid
Series USB Case comes into play – it’s a case for the iPhone 4 and 4S,
with a built-in USB Flash drive. The scratch-resistant case protects
against dings and drops, while still offering access to all of the
phone’s ports and controls (it is not waterproof). Integrated into the
back of it, however, is a removable USB Flash drive. These are
available in 4, 8 or 16 GB capacities."
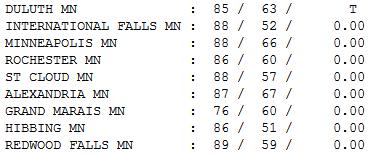
Blue Sky Wednesday. With dew points in the mid 50s
it still felt OK out there yesterday, highs ranging from 76 at Grand
Marais to 88 St. Cloud and the Twin Cities, 89 Redwood Falls. A trace of
rain fell at Duluth.
Paul's Conservation Minnesota Outlook for the Twin Cities and all of Minnesota:
TODAY: Hot sun, more humid. Dew point: 60. Winds: South 10-15. High: 92
THURSDAY NIGHT: Partly cloudy and mild. Low: 69
FRIDAY: Sticky, few T-storms by afternoon. Dew point: 66. High: 88
FRIDAY NIGHT: Best chance of showers and T-storms, some heavy. Low: 70
SATURDAY: Hazy sun, muggy. Isolated T-storm possible, especially early. Dew point: 70. Winds: SE 8-13. High: 89
SUNDAY: Sunny and hot. Dew point: 72. Winds: S 10+ Low: 72. High: 92
MONDAY: Another sauna. Steamy sun, even hotter. Low: 73. High: 94
TUESDAY: Hottest day in sight. Feels like 105. Murky sun. Low: 74. High: 96
WEDNESDAY: Very slight relief. Still toasty - slight chance of T-storms. Low: 72. High: 92
More Data Points
I'm reassured that a majority of Americans still respond to logic, reason, and facts on the ground.
No, every disaster can't be blamed on a warming
atmosphere. But a recent study suggests that the historic 2011 heat wave
over Texas was 20 times more likely to occur because of a backdrop of
elevated greenhouse gas levels.
Separating
out weather from larger, longer-scale climate shifts is proving
challenging, but we need to step back and look at the big picture: a 10"
(1-in-500-year) flood in Duluth, while the Corn Belt shrivels in
drought reminiscient of 1988. Is this all a grand coincidence?
"Our weather is the brush stroke that makes
up the bigger, grander picture of our climate. To fully understand and
comprehend the climate, one must see the totality of events and look
beyond a speck in time and space to see the grand scale", said Jerry Wofford, in an editorial at Tulsa World. Well said.
Our only chance of rain comes Friday into
Saturday morning from a few random T-storms firing along another steamy
warm frontal boundary; a better chance of widespread storms late next
week. Get used to 90+ temperatures, in fact the ECMWF is hinting at mid
to upper 90s early next week.
30 days above 90F. this summer? The hottest summer since 1988?
Probably.
Climate Stories...
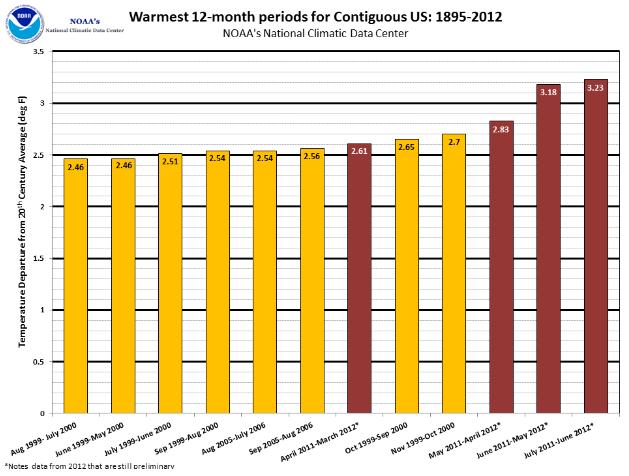
NCDC: Record U.S. Heat Unlikely To Be Random Fluke. More details from
The Washington Post: "
As hundreds of local temperature records have been smashed from
Atlanta to Colorado Springs, there’s been lots of discussion about
whether the recent molten weather can be “blamed” on global warming.
Isn’t it at least possible this heat wave is just a random outburst? Or
are we really seeing the effects of all that carbon dioxide humans have
put into the atmosphere. Perhaps a chart can help clarify matters. The
National Climatic Data Center has just released its “State of the
Climate” report
for June 2012. The last 12-month period on the mainland United States,
it notes, were the warmest on record. What’s notable, however, is that
every single one of the last 13 months were in the top third for their
historical distribution–i.e., April 2012 was in the top third for
warmest Aprils, etc. “The odds of this occurring randomly,” notes NCDC,
“is 1 in 1,594,323.” (Note: This might be a bit high; see the update
below.)"
Graphic above: NOAA NCDC.
Warm 2011 Shows Climate Change Despite La Nina. It
was a real meteorological head-scratcher: 2011 was unusually warm, in
spite of a cool phase in the Pacific, a full-blown (moderate) La Nina
event.
Bloomberg Businessweek has more details: "
Last
year was among the 15 warmest since record keeping began in the late
19th century, despite a La Nina weather pattern that should have cooled
global temperatures, according to an annual climate assessment. La
Nina’s failure to cause significantly cooler global temperatures is one
of many indications of long-term climate warming, according to the U.S.
National Oceanic and Atmospheric Administration’s State of the Climate
report compiled by 378 scientists from 48 nations. La Nina was
responsible for droughts in eastern Africa and North America, the
scientists reported."
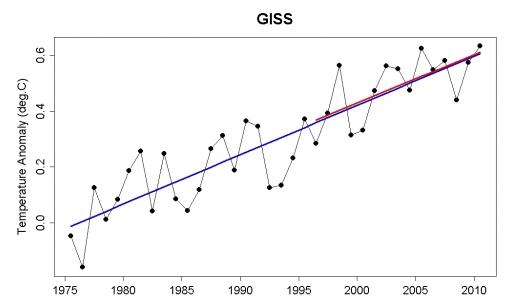
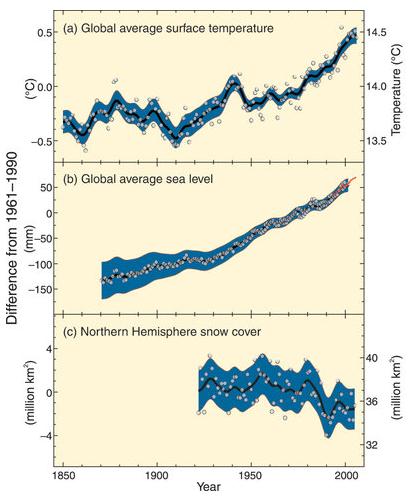
Why Climate Change Is Real. Here's an excerpt of an editorial from Jerry Wofford at
Tulsa World
that really resonated wiith me, focusing on the need to step back and
look at the big picture (an orchestra with many of the instruments
playing out of tune these days): "....
Tulsa
has experienced the warmest January to June period in recorded
history. Monumental droughts gripped the state during last summer’s
again brutal heat wave. Nationwide, what you see is more of the same.
A lot of use of the term "warm." While it may be easy to point to
those and a slew of other events as evidence of climate change, like I
said earlier, it’s not the full picture. Heidi Cullen is the chief
climatologist for Climate Central, an independent, nonprofit research
organization that focuses on climate science and collaborates with
various national news organizations. She put it to me this way during an interview I had with her last year:
"It's trying to help
people understand that climate is like this big orchestra where you
have all these different instruments playing. It's this complex
orchestra, within the background now, we can measure and we can see
that there is this steady drumbeat of warming - a trend as opposed to a
cycle - imprinted on the background of this chaotic orchestra. What
scientists are trying to untangle is how does our fingerprint on that
complex system, how does it push it in any direction."
Graphic credit above: "
These
graphs from the Intergovernmental Panel on Climate Change show the
global temperature averages compared to the 1961-1990 average."
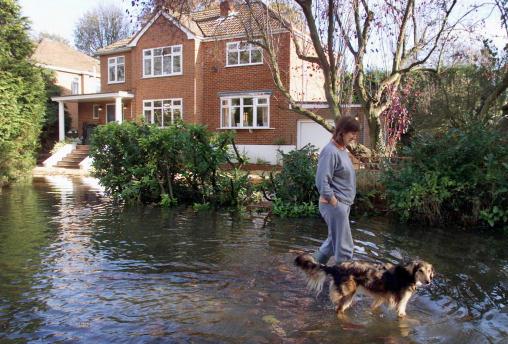
England Flood Risk To Rise Fourfold By 2035: Report.
Reuters has the story; here's an excerpt: "
The
risk of flooding for many English homes and businesses could increase
fourfold by 2035 if more action to deal with the impact of climate
change is not taken, government advisers said on Wednesday. As
severe floods continue to batter parts of Britain after the wettest
June since records began, around one in seven homes and businesses face
some kind of flood risk, the climate advisers said.
Around 160,000 properties would be at risk by 2035 if better planning
and more investment was made in flood defenses, compared with 610,000
at risk if no action was taken, they said."
London file photo above: AFP PHOTO / Adrian Dennis.
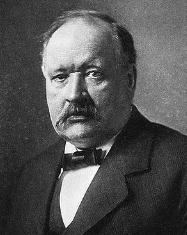
The Basic Science Of Climate Change Is Undeniable. Here's a snippet of a story at
Forbes: "
It’s
not hard to have heat on the brain this summer, especially here in the
United States. Since the government began keeping records in 1895, this June
was the hottest June – 2 degrees Fahrenheit above the 20th Century
average. The past six months have been the hottest first half of the
year on record since 1895, and for the 12 month period ending June 30th,
it was also the hottest year on record since the United States began
keeping records. Given that this followed a record warm winter and that
the last decade has seen a tie for the hottest year on record, climate
change has once again become a topic of debate. That being the case, I
thought I might review what’s often lost in discussions of climate
change: the basic chemistry that underlies what we know about how it
works."
Photo credit above: "
Swedish chemist Svante Arrhenius."
Can Somebody, Please, Help George Will Understand Climate? Here's an excerpt from
The Los Angeles Times: "
George
Will seems like a smart guy, so it's a little mystifying why he cannot
seem to understand the difference between weather and climate --
concepts that with a little education, the average third-grader could
easily grasp. Could it be that he's not trying? In an appearance on
ABC's "This Week," Will dismissed the notion
that the heat wave plaguing the nation has anything to do with climate
change. "How do we explain the heat? One word: summer," Will said,
asserting that current record-setting temperatures in the U.S. are
nothing unusual. "Come the winter there will be a cold snap, lots of
snow, and the same guys, like [Washington Post
columnist] E.J. [Dionne], will start lecturing us. There's a
difference between weather and climate. I agree with that. We're having
some hot weather. Get over it."
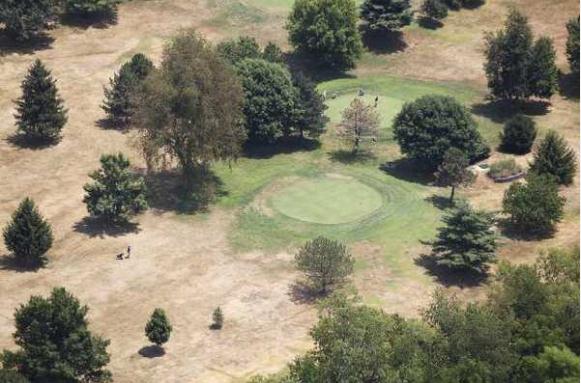
Photo credit above: "
The greens are easy to spot at a
Lexington, Ky., golf course, as record-breaking heat fuels droughts
across the U.S. -- and conservatives pretend climate change isn't
happening."
(Charles Bertram / MCT / July 6, 2012)


No comments:
Post a Comment