62 F. average high for October 8.
83 F. high on October 8, 2011.
Trace of rain reported Monday in the Twin Cities.
Freeze possible Wednesday morning, likely Friday morning.
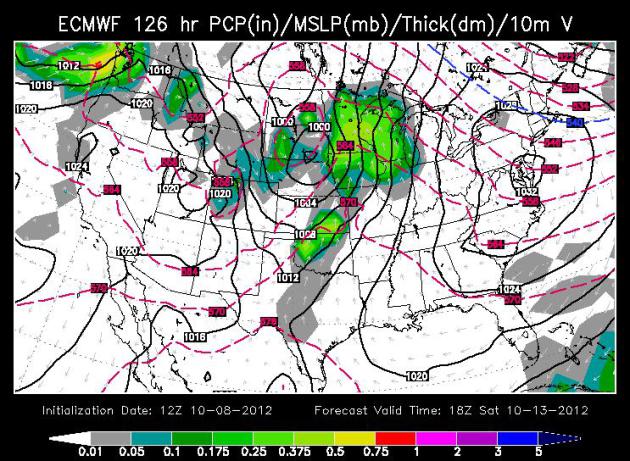
Saturday: the most rain since mid-August? It's the first chance of steady/heavy rain in many weeks.


* the Vancouver Sun has more details on the highest, fastest free-fall in history here.
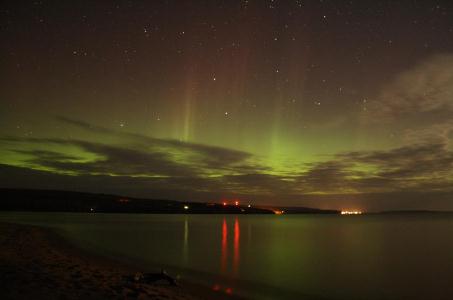
* NASA has more on the enhanced aurora potential here.
Paul:
"Here is a question that I have, that you may or may not want to share with the public.
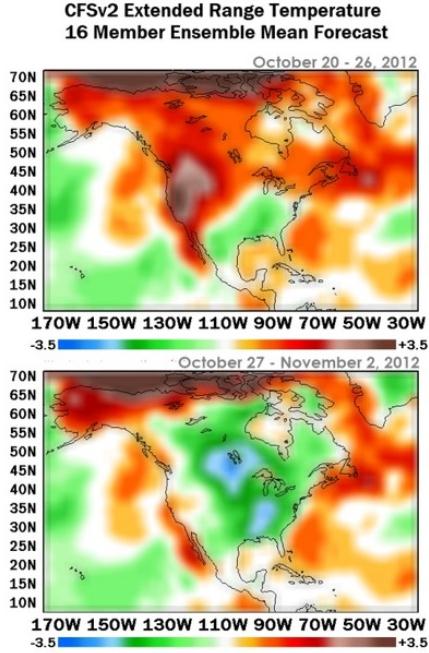
It seems to me that EL Nino is struggling to gain a foot hold , so it looks like that signal may turn out to be a very weak to neutral ENSO for this winter season. What has gotten my attention is the signal that we are seeing in the north central Pacific ocean.. The waters were warming in that area causing a cold pool of water to set up near the coast of North America.. Now it looks like the Sea surface temps in the central northern Pacific are starting to cool, could that bing in warmer waters just of the coast of the NW USA.? In other words I am talking about the PDO.....I think it could be the major driver for our winter forecast."
Thanks,
Randy Peterson
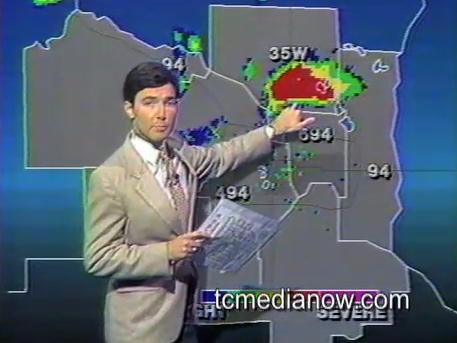
* heavily retouched photo (what WAS that roadkill on my head?) courtesy of KARE-11 and tcmedianow.com.
Larry: "I will have the
finished winter forecast out around October 18th. Looking for a tepid
Modoki El Nino, trending back to a neutral ENSO in February. Deep cold
pool near and below Aleutians, warm SST intrusion along immediate West
Coast and just below Greenland are pushing me toward a warm West, cold
Central, changeable to mild East alignment. Should be a good winter for
the (Twin) Cities."
* I nudged Larry (gently) about what he meant by a "good winter" for the cities:
Paul: Holy Batman! 80-90"?
Larry does a great job, and part of me hopes he's right. I'd be thrilled
with 100" snow and 20-30 F all winter. If only. At this point I
wouldn't rule anything out, but I'll wash and wax Dave Dahl's car if we
get 90" of snow. Based on a (weak) El Nino nudging the storm track over
the southern USA and a pervasive drought that doesn't show any immediate
signs of letting go, I'm leaning toward 40-45" for the winter. Better
than last winter, but not as snowy as 2010-2011. Stay tuned. I'll stock
up on some high-quality automotive wax, just in case.
Hi,
"I thought Paul would like a copy of the photo below for his column. Later."
Terry Guy
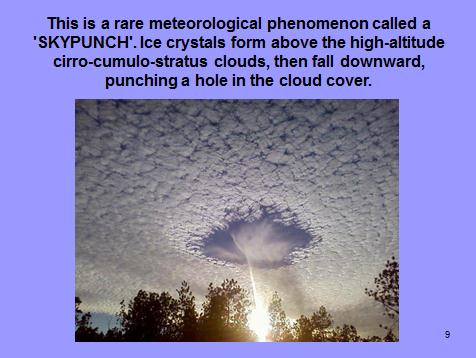
"Strictly speaking there is no scientific term for the apparition, and what exactly it is has been the subject of much meteorological speculation. One hypothesis is that the hole is made by falling ice-crystals that could have come from the exhaust of a passing aircraft. It is possible the air was at just the right temperature and with just the right moisture content so that the falling crystals could absorb water from the air and grow. The moisture removed from the air could have increased the evaporation of the cloud's water droplets, which then disappeared to produce the dramatic hole. The wispy clouds seen below the hole may be heavier ice-crystals that have fallen from the hole, evaporating (the correct term is subliming) before they reach the ground. It's called a fallstreak hole."
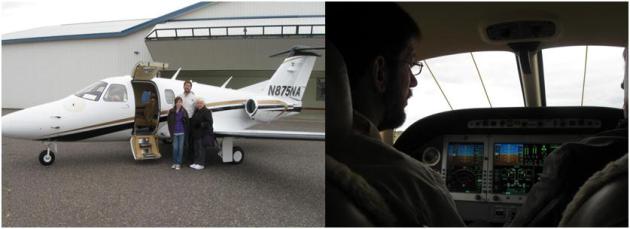
"Attached are a couple of pictures from my Jet demo flight this past weekend. The Eclipse Jet is part of a new line of small jet aircraft called Very Light Jets (V.L.J's). The Eclipse Jet has a cruise speed of just over 400 mph, but can take off and land at under 100 mph. The relatively slow take off and landing speed makes it possible for someone like me (with very little flying experience) to actually fly a jet. It also makes it possible to takeoff and land at smaller regional airports like the one in Blaine (where these photos were taken) or even smaller. This jet also uses the latest in airframe, engine, and avionics technology to make it the most efficient, easy to fly, and safest jet available. The Eclipse has a max seating capacity of 6 people (including the pilot). Most other VLJ's that I am aware of only have 4 seats."
Jay Gustafson - Director of IT
Media Logic Group
Jay - I'm
slobbering all of my laptop, and for good reason. That's one beautiful
aircraft. At close to $2.5 million I wouldn't exactly call it
affordable, but the capabilities seem to rival jets 2-5 times more
expensive. Very impressive, and made in America! More information on the
Eclipse 550 here. Corporate jet? Keep dreaming...


Paul's Conservation Minnesota Outlook for the Twin Cities and all of Minnesota (and western Wisconsin):
TODAY: Mostly cloudy, windy and cooler with light showers and sprinkles. Winds: NW 15-25. High: 52
TUESDAY NIGHT: Gradual clearing, frost/freeze expected late. Low: 30
WEDNESDAY: Frosty start. Bright sunshine, still cooler than average. High: 53
THURSDAY: Next clipper, clouds & sun. Brisk. Low: 39. High: 51
FRIDAY: Sunny, turning breezy. Low: 30. High: 53
SATURDAY: Steady, soaking rain. Cool & raw. Low: 39. High: 48
SUNDAY: Drier day. Soggy start, skies brighten PM hours. Low: 44. High: 55
MONDAY: Sunshine, milder breeze. Low: 42. High: near 60
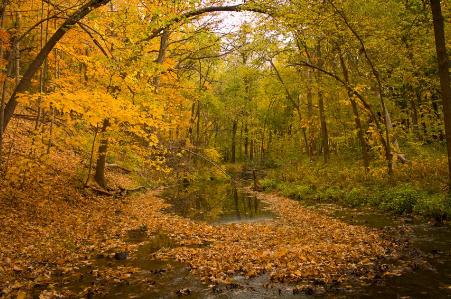
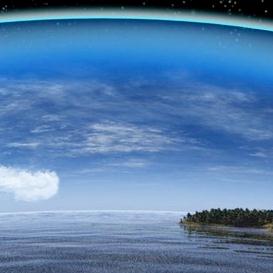
* photo above courtesy of Shad Van Matre.
Winter Hassle Factor
I've been babbling about the Hassle Factor since
the 80s, when I loitered in KARE-11's backyard. It's an attempt to
predict rush hour conditions, based on snow, ice, wind chill, etc.
The question keeps bubbling to the surface:
"what's the Winter Hassle Factor"? Colder with some snow. I know it's
vague, but I stand by that prediction. Snow lovers may be happy to hear
from Larry Cosgrove, an old college buddy, who now specializes in
long-range weather for utilities. He's predicting the main storm track
from the western Gulf to the Appalachians, but overall a "good winter"
for snow lovers. How good?
"At this point I would go with 80 to 90 inches
in MSP, with most occurring late November through January and a mild
February as the +ENSO wanes" Cosgrove e-mailed me yesterday.
Yikes! Average is 55 inches. I'll be amazed (and
greatful) if we pick up 45 inches this winter, based on our ongoing
drought. Time will tell. Details of Larry's prediction above in the "Ask
Paul" section.
The maps are looking a little more encouraging
for moisture. Sprinkles (even a few flurries tonight) give way to dry
weather into Friday. Significant rain is expected Saturday, the most
since mid-August.
Heavy jackets this week; 60s return next week.
No "sticking snow" shaping up the next 2 weeks.
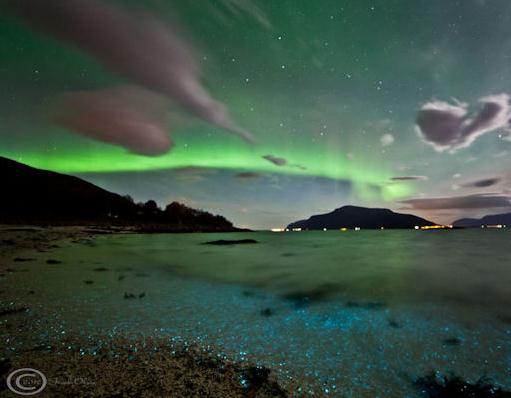
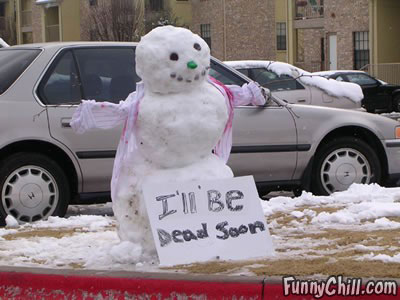
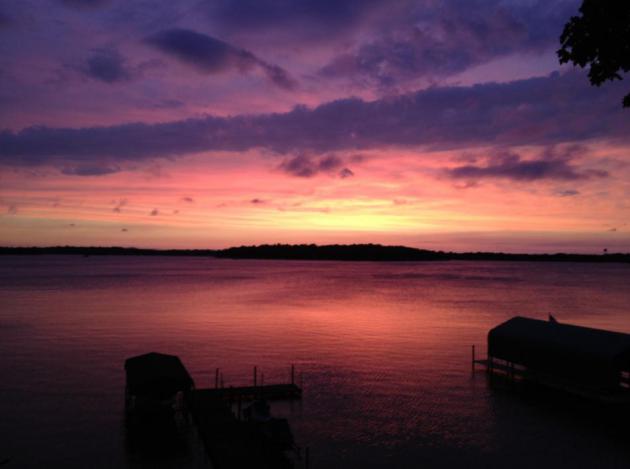
* photo above courtesy of funnychill.com.
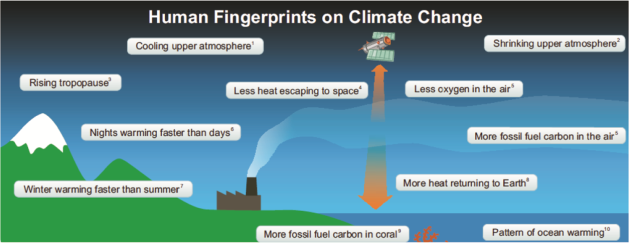
Climate Stories...
"Many laws protecting environmental quality
have promoted liberty by securing property against the destructive
trespass of pollution." - Ronald Reagan

1). Maintain safe and reliable energy supply to developed countries, where demand is leveling off and infrastructure is aging."
Most of the observed warming during the latter half of the 20th century is very likely (greater than 90% probability) to be attributed to human activities. - 2007 IPCC conclusion
Natural causes alone cannot explain the observed changes.
"The science is real - we can't embrace ignorance."
"Many Americans are rightfully concerned about the fiscal debt we're handing down to tour kids, which proves we can still focus on future problems and issues. Buut when it comes to environmental debt, triggered by a steady build-up of greenhouse gases, many of these same people are silent. There is a serious disconnect."
"What do people want to be remembered for? The money they accumulated during their careers? How much stuff they have? Or the world they left behind?"
* no such thing as "settled science" or "perfect science". The science is continually evolving as new data comes in and new hypotheses are formed, tested, validated or discarded.
* based on the evidence at hand scientists try to reach consensus.
" media "balance" on climate policy is appropriate - but on climate science?

How do we know that greenhouse gases trigger warming?
* Basic physics.
* Observations
* Modeling
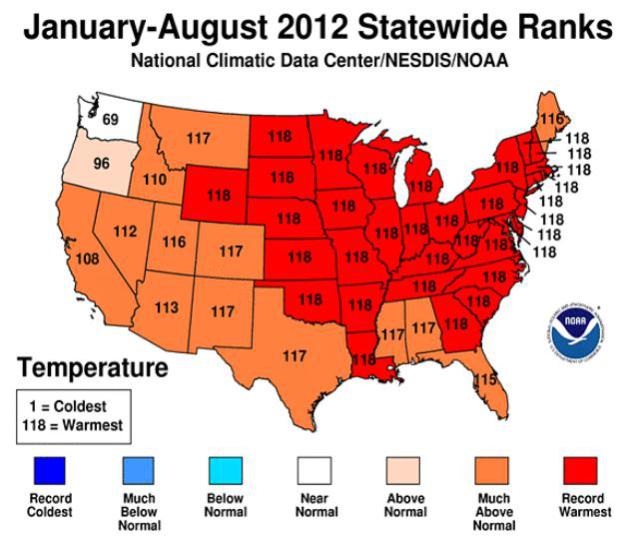
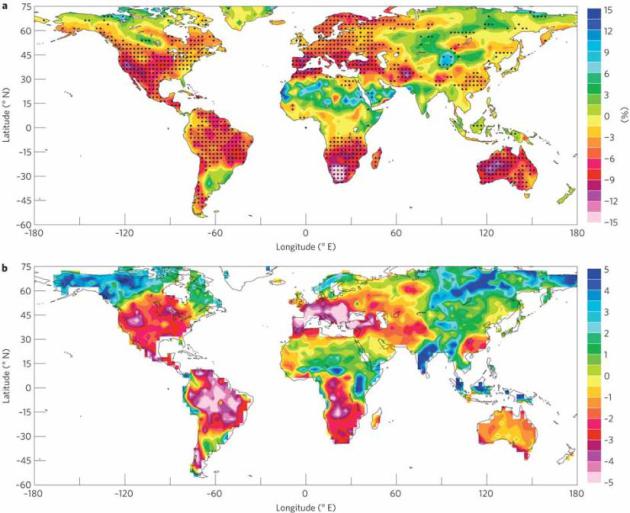
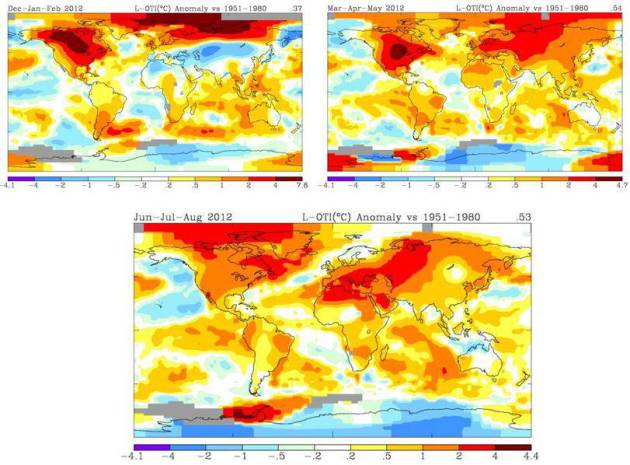
* map above courtesy of NOAA NCDC (118 means hottest on record).
"Human-caused warming (AGW) will increase the probability of warmer weather, but internal variability will always be a powerful factor from year to year."
97% Why do (only) 97% of published, climate scientists agree that humans are largely responsible for most of the warming since the latter half of the 20th century? "Scientists do not all have identical thresholds for accepting hypotheses."
Climate Policy: "Your opinion counts just as much as mine."
Important Drivers With Climate Change:
1). Natural variability.
2). Land use/landscape changes.
3). AGW (human-caused warming linked to the burning of fossil fuels and deforestation)
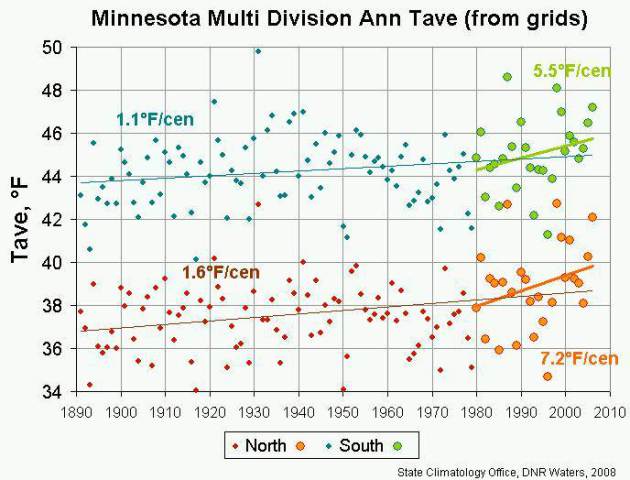
"The persistence and amplitude of the warming signal during winter is stronger in Minnesota."
Brainerd: new 30-year rolling weather averages show a 3.8 F. warming for January low temperatures.
* increased freeze/thaw cycle (more damaged roads)
* longer growing and construction season.
* changes in animal migration, hibernation and foraging.
* longer exposure times to mold and allergens
* later nitrogen applications (soil temperatures too high)
* more rapid breakdown of crop residues.
* change in the depth/duration of soil and lake freezing.
* fewer adverse-weather days.
Temperature signal during the summer is modest in Minnesota.
Based on cooling degree days: 2012 is the 3rd warmest on record.
Slight increase in 70-degree dew point days.
* first 80-degree dew point reported at Voyageur's State Park. Historically this is unprecedented.
"Most of our heat waves since the 1980s have been driven not by air temperature, but by excessive dew points."
* new insects/pathogens.
* efficacy of herbicides.
* warm water issues (algae blooms).
* heat-related health care implications (MS, COPD, obesity.
* increased livestock stress.
* shorline management.
* storm sewer runoff.
* influence on fisheries.
There are 1,500 volunteer weather observers in the state of Minnesota (I did not know that).
Trends: springs and falls are trending wetter. Eastern Minnesota is trending wetter with time.
10-30% increase in "normal precipitation".
Bipolar Weather Regime:
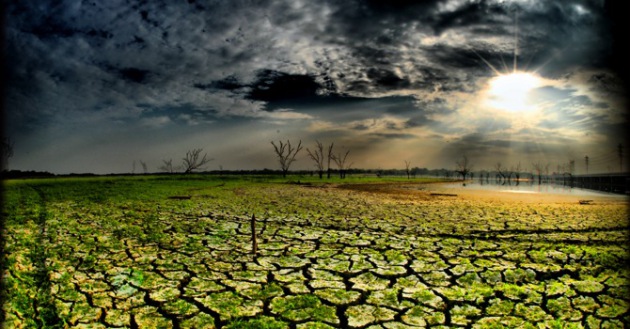
Severe drought has been reported somewhere in Minnesota every summer since 2005.
Greg Zandlo report: three separate 1-in-1,000 year flood events in southern Minnesota since September, 2004.
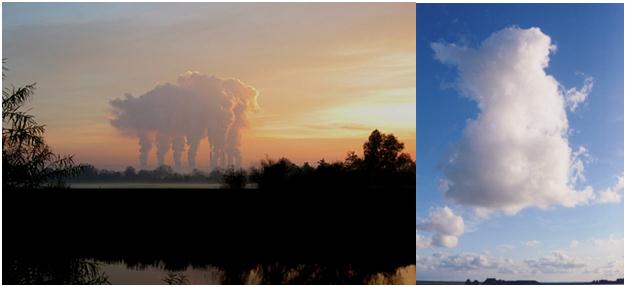
Cloud credits: "pig", courtesy of Cloud Appreciation Society, "rabbit" photo here.

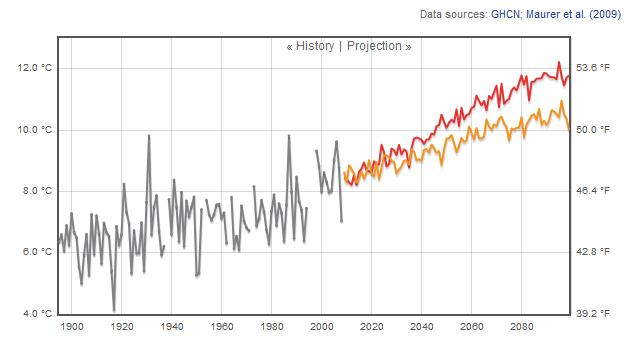
Minnesota: 3rd fastest-warming state in the USA (Climate Central)
* 4-6 F. warming by 2100
* minimum winter temperatures (nighttime lows) forecast to warm the most.
* increase in winter cloudcover over time.
* 20% reduction in snowfall by 2100 (more rain and mixed precipitation during winter months).
* current average winter snowfall at MSP: 55" forecast to be one foot less by 2100.
* Overall increase in precipitation forecast for eastern Minnesota and Wisconsin.
Consensus on sea level rise by 2100: around 1 meter, or 3 feet.
Hurricane damage is doubling every 20 years.
Models suggest fewer hurricanes in a warmer world, but more extreme (Category 3+) storms.
Florida/Bahamas may be most at risk.
Warming oceans: odds of a San Diego/Los Angeles hurricane are increasing. Mediterranean Sea forecast to become warm enough to support hurricane activity.
2012: ten separate billion-dollar weather disasters, second only to 2011.
$20 billion in severe storm damage so far in 2012, much of it from the massive derecho that swept across the Ohio Valley into the Mid Atlantic region - the most damaging/deadly on record
Flood control systems: designed for 20th century storms.
Top 10 Most expensive disasters since 1980: 6 out of the top 10 were hurricanes, 3 were droughts.
1988 heat wave and drought: 7,500 Americans died (!) with a damage estimate of $78 billion.
"During the last 7 years we've broken pretty much every kind of weather record there is, from heat to tornadoes to floods..."
"All the volcanoes of the world produuce less greenhouse gas emissions than the state of Florida".
Greenhouse gas levels higher now than they've been in 800,000 years.
No atmospheric blanket of gases to trap warmth: Earth's temperature would be closer to 0 F, not 59 F.
CO2 increasing at the rate of 2 ppm/year, or about .5% every year.
Twin Cities: 16 months/row of warmer than average temperatures. Odds of flipping 20 consecutive "heads" is roughly 1 in 1 million.
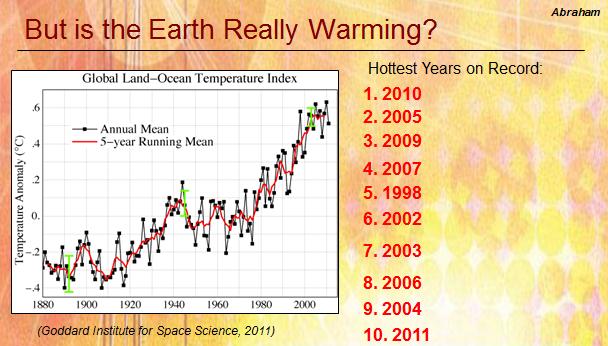
331 months/row of global temperatures warmer than the 20th century average.
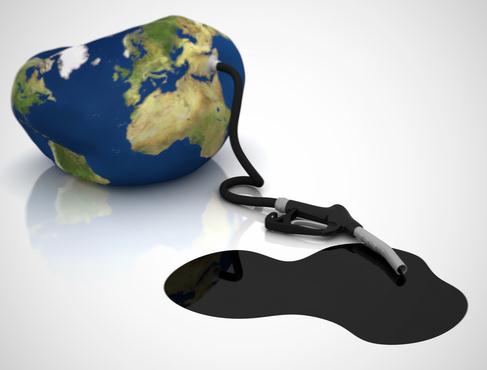
"Mitigating climate change will require a level of sustained innovation and American reinvention that will propel the USA into a new competitive paradigm. This is our Energy Moonshot Moment. To remain competitive on a global stage we have to develop new ways to grow our energy infrastructure, jobs and GDP that aren't totally reliant on fossil fuels."
No comments:
Post a Comment