61 F. high in the Twin Cities Monday.
59 F. average high for October 15.
60 F. high on October 15, 2011.
Trace of rain fell Monday evening.
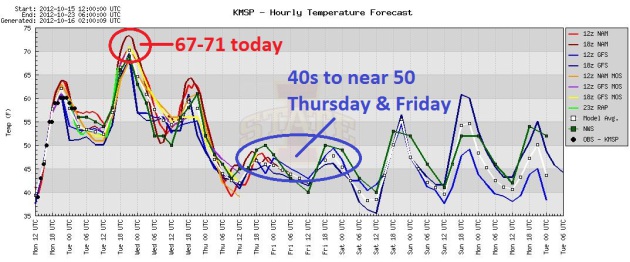
Upper 60s to near 70 today, 25 degrees cooler by Thursday.
GFS model hinting at rain/snow the last weekend of October (27-28). It's too early to get more specific than that.
Winter Buzz. Colder and snowier than last winter for
Minnesota and Wisconsin, but not as snowy as 2010-2011 - and still
trending milder than average overall. With a lingering drought I suspect
most of the snow that falls will be from late December into early
March. More details below. Image credit
here.
Another Temperature Tumble. Best to get your
leaf-raking done today, if possible. The combination of a little rain
Wednesday and Thursday, accompanied by a 25 degree temperature drop will
make it fairly unpleasant to do much outside later this week. Some
moderation is likely by the weekend. Graph above: Iowa State.
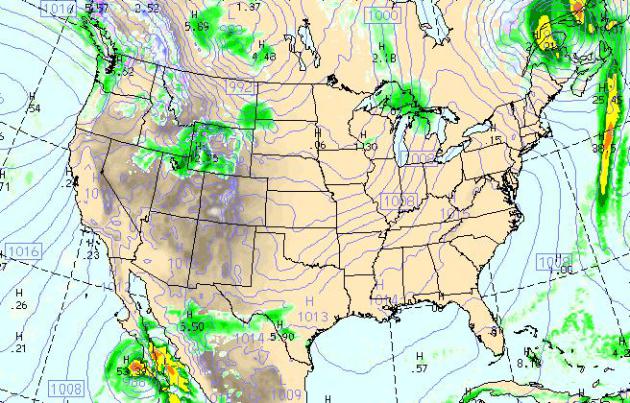
Today's Weather Map. The WRF model, valid 4 pm
today, shows showery rains over the Great Lakes, dry weather across much
of the USA. The outer bands from Hurricane Paul will be soaking Baja
Mexico, including Cabo San Lucas, which may see some 5"+ rains and flash
flooding.
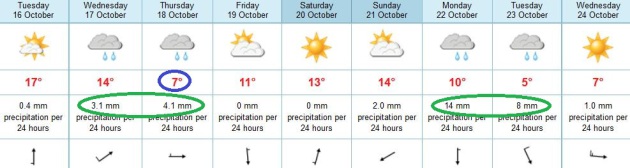
Two Chances For Rain. The ECMWF prints out a litlte
rain Wednesday and Thursday, potentially heavier amounts early next
week. Thursday appears to the chilliest day in sight, highs recovering
well into the 50s next weekend.
"
When bubbles collect in the center of your coffee cup, expect
fair weather; if they adhere to the rim, expect rain; if there's no
fixed position, the weather will be changeable." - Farmer's Almanac. Get me to Caribou, stat! Image credit
here.
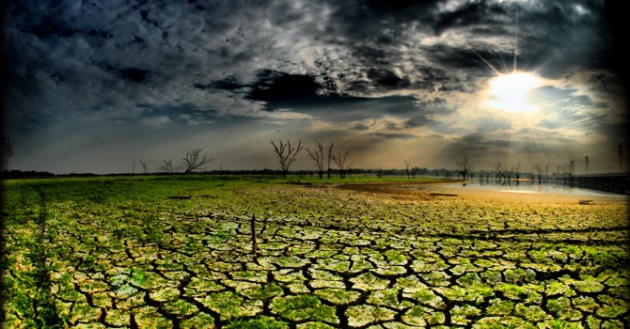
"...
This year’s U.S. drought was the most severe since 1954,
according to the Palmer Drought Index, which has measured such weather
phenomena since 1895. The hot, dry conditions pushed estimates for the
country’s corn harvest to the lowest level in six years and the
projected average cash price to an all-time high. August was the 330th
consecutive month in which temperatures worldwide topped the
20th-century average, the U.S. National Climatic Data Center said last
month." - excerpt of a Bloomberg Businessweek article on agricultural shifts taking place across the USA; details and links below.
"...
China attracted $52.2 billion in new (renewable energy)
investments in 2011, the largest sum of any country. This accounted for
nearly 60 percent of the total new investments in developing countries
and more than 20 percent of the global total. In terms of the pace of
growth, however, the United States scored an impressive 57 percent
growth in investment over 2010 levels, outpacing all countries except
India’s 62 percent. Overall, the United States ranks second in total
national renewable energy investment at $50.8 billion, followed by
Germany at $31 billion." - details from Worldwatch Institute below.
Fast-Forward Seasons. I love this animation, courtesy of eirikso.com and
cheezburger.com. Very nice.
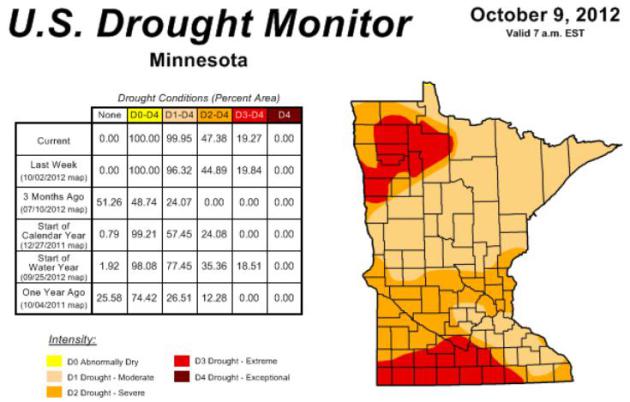
Drought Update. Here's the very latest from
The Minnesota Climatology Working Group - stating the obvious (which I've become quite good at): the drought is getting worse: "T
he U. S. Drought Monitor,
released on October 11 places portions of northwestern, southwestern,
and south central Minnesota in the Extreme Drought category (map at right).
Nearly one-half of Minnesota is in Extreme Drought or Severe Drought.
The remainder of Minnesota falls in the Moderate Drought category.
Topsoil moisture across 86 percent of Minnesota's landscape is said to be Short or Very Short.
Stream flow measurements at reporting stations in the driest areas of the state rank below the 10th percentile when compared with historical data for the date.
Minnesota's drought situation is the result of abnormally dry weather over three distinct time periods.
In some communities, precipitation deficits amplified the drought
situation during each of these spells of dry weather. In other
communities, dry periods were interrupted by wet weather, only to have precipitation shortfalls degrade the situation yet again."
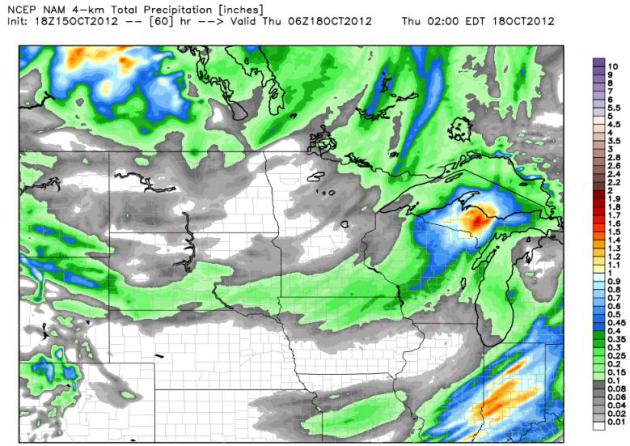
Drop In The Bucket. The latest 4 km. NAM model only
prints out .15 to .30" rain for the metro and much of southern Minnesota
by Thursday at 1 am. The U.P. of Michigan: over 1" of rain.
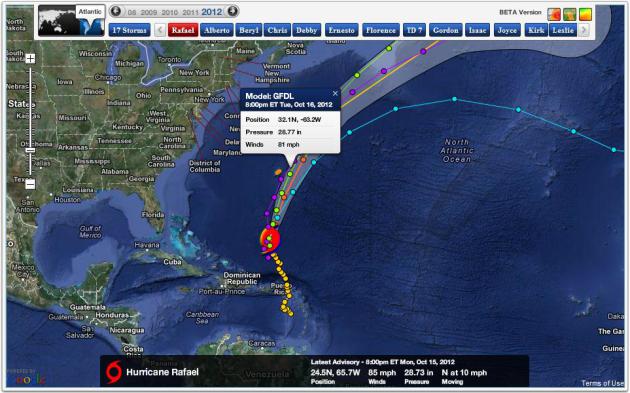
Close Call for Bermuda. "Rafael" is a Category 1
hurricane, expected to pass just east of Bermuda tonight. Tropical Storm
Warnings are posted for the island, which will experience 4-8" rains
and a 2-5 foot storm surge. Map: NHC and Ham Weather.
Corn Belt Shifts North With Climate As Kansas Crop Dies. Here's a clip from a story at
Bloomberg Businessweek: "...
While
farmers nationwide planted the most corn this year since 1937, growers
in Kansas sowed the fewest acres in three years, instead turning to
less-thirsty crops such as wheat, sorghum and even triticale, a
wheat-rye mix popular in Poland. Meanwhile, corn acreage in Manitoba, a
Canadian province about 700 miles north of Kansas, has nearly doubled
over the past decade due to weather changes and higher prices. Shifts
such as these reflect a view among food producers that this summer’s
drought in the U.S. -- the worst in half a century -- isn’t a random
disaster. It’s a glimpse of a future altered by climate change that will
affect worldwide production..."
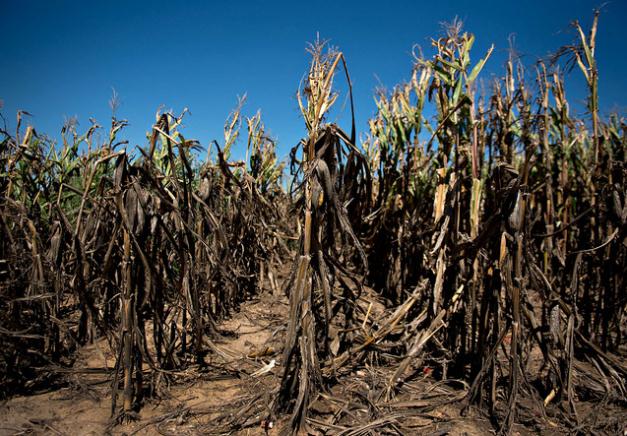
Photo credit above: "
Shifts such as these reflect a view
among food producers that this summer’s drought in the U.S. -- the
worst in half a century -- isn’t a random disaster. It’s a glimpse of a
future altered by climate change that will affect worldwide production." Photographer: Daniel Acker/Bloomberg
"Ask Paul". Weather (and climate) related Q&A:
Susie - although I don't see any accumulating snow thru early next week;
I'm fairly convinced we'll see something closer to a "real winter." 22"
of snow last winter in the metro - it was a Memphis-like winter, and the
odds of two easy (wimpy) winters, back to back, are slim to nil.
Although I expect the drought to linger into December I suspect we'll
see at least 40" of snow this winter, maybe more - but most of it will
come the latter half of winter. Last winter was the 3rd warmest on
record for Minnesota. Although temperatures will probably be (slightly)
warmer than average, based on a weak El Nino, it'll be significantly
colder than last winter, so any snow that does fall will have a better
chance of sticking around. That's my gut, more gut feel than science.
Not as snowy and savage as 2010-2011, but not as meager as last winter. A
step in the right direction...?
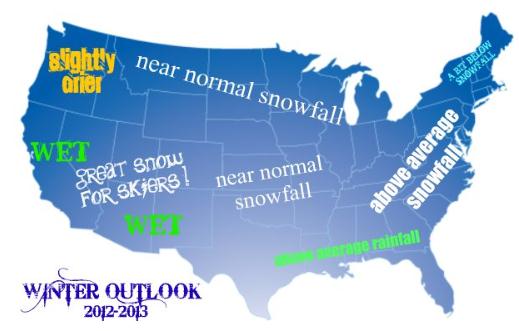
Winter Precipitation Outlook. Based on a mild El
Nino the storm track should favor more rain and snow from the Desert
Southwest and Deep South up the Eastern Seaboard. The map above is
courtesy of Rob Guarino, who is an ace forecaster in the Delaware
Valley, and penned an impressive overview of the factors influencing
this upcoming winter at
liveweatherblogs.com. It's definitely worth a look.
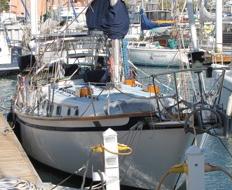
"
Good morning. I am presently in Santa Rosalia, Mexico on a 42
foot sailboat. We, of course, are watching Paul closely. I pose to you
the above question ("When a tropical storm becomes a hurricane, does it
move faster?") and would have you give me any general information
I might use in the future about hurricane avoidance in the future. Thank
you very much."
Kim P. Philley
SV Philosophy
Kim - first of all, I definitely picked the wrong career path. I want
to be on a 42 foot sailboat off the coast of Mexico, hurricane or no
hurricane. Good for you. As for your question, what matters isn't
"hurricane vs. tropical storm", but the latitude. The farther away you
get from the equator and tropics, the stronger the influence of jet
stream steering winds, and the faster a tropical system will move, in
general. So there's no direct correlation that I'm aware of that
stipulates hurricanes move faster than tropical storms. 95% of all
hurricanes move toward the north in the Northern Hemisphere, so they
will speed up over time as they track away from the equator, and get
swept up within stronger steering winds.
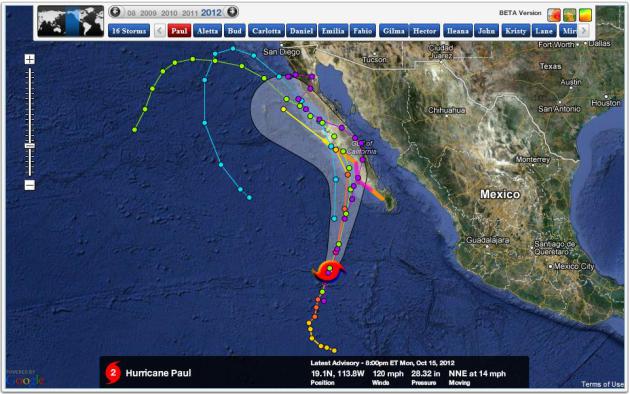
Hurricane Paul. I feel a little guilty tracking
"Paul" - which I swore would never make it past the Virgin Islands. The
Category 2-3 storm is forecast to spare Cabo San Lucas, weaking into a
Category 1 hurricane before coming ashore over Baja Mexico. Map: NHC and
Ham Weather. More on Hurricane Paul from
CNN.
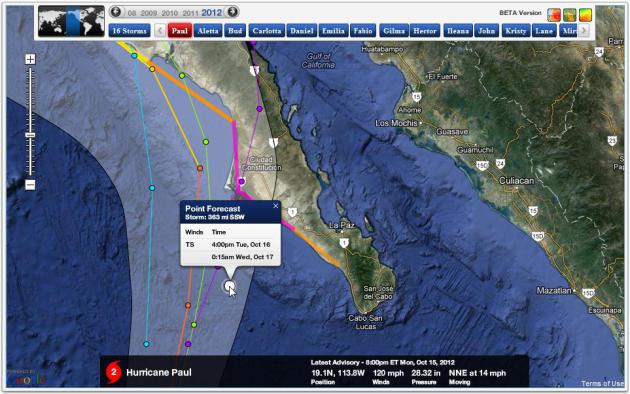
Cabo: Dodging A Bullet. Our Ham Weather software
shows tropical storm force winds reaching the southern tip of Baja
Mexico by 4 pm this afternoon, lingering for at least 8-9 hours - Paul
passing 100-150 miles west of Cabo.
Paul,
"It
is obvious that you believe in global warming and I am curious what you
think about this article and new data that is coming out? I for one
believe we need to continue to reduce all types of pollution, but I am
afraid we have gone to far in our push to reduce greenhouse gas
emissions."
James R. Gagne
Excelsior, MN 55331
Hi James - Thanks for the e-mail and for keeping an open mind. First,
maybe it's subtle semantics, but this isn't a matter of "believing"
anything. It's
acknowledging a tidal wave of data from published
climate scientists that confirm the atmosphere is warming. Some of this
warming may, in fact, be natural, but it comes at a time when greenhouse
gases have increased by 39% worldwide.
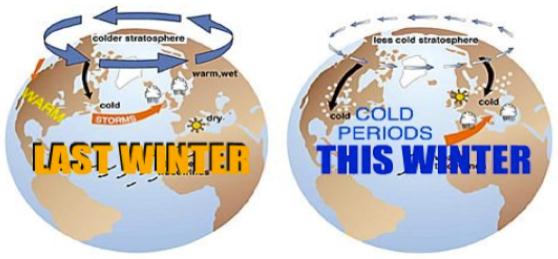
I was initially skeptical in the late 80s and early 90s, but after
seeing things on my weather maps I couldn't explain via "natural weather
extremes" and digging into peer-reviewed science, I came to acknowledge
what 97% of published, peer-reviewed climate scientists were reporting:
there's probably a link between man-made pollutants and the warming
we're seeing in the lower atmosphere. If it was the sun, the upper and
lower atmosphere would both be warming, but we're observing a cooling
trend in the upper atmosphere (stratosphere), while most of the warming
is coming at night, consistent with greenhouse gases re-radiating
warmth.
I disagree with your assertion about regulating greenhouse gases.
"Clean coal" is an oxymoron; unless coal-fired plants bury or sequester
greenhouse gas emissions (which no plant is doing right now) it's still
the dirtiest form of energy. Natural gas is much cleaner, and power
plants are already moving in this direction to save their customers
money. We need to take advantage of our natural resources, yes, but a
total dependence on fossil fuels will leave a legacy for our kids and
grandkids, who will inherit a warmer, drier, stormier atmosphere.
They're going to wonder why we were so short-sighted in not developing
alternative, cleaner ways to power our economy. America's competitive
advantage may also depend on our ability to innovate beyond carbon-based
fuels. China and Europe aren't waiting around - they're moving
aggressively beyond carbon. We need to be doing the same in the USA, not
betting the farm on carbon.
As for the "no warming since 1998" meme - every climate scientist
I've talked to says it's a blatant manipulation of the data. 1998 was a
record El Nino year, warm Pacific Ocean water which added additional
warmth to the atmosphere worldwide and spiked the numbers to some
degree. You can cherry-pick specific beginning and ending dates to prove
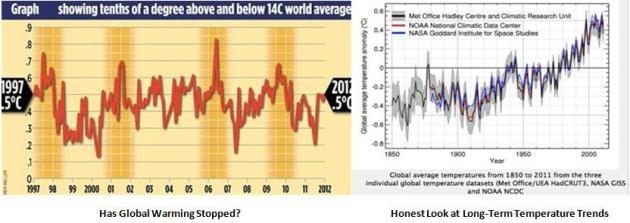
almost anything, but an honest look at the trends shows that warming
has continued.
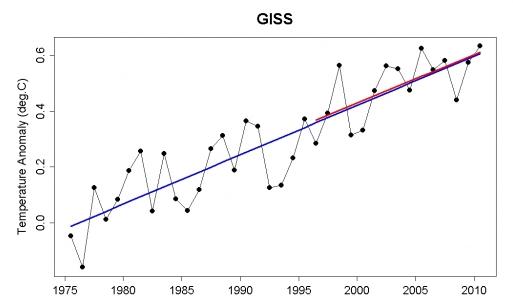
Temperatures rarely move in a straight line; they zig and zag. What's
important is the trend over time, and as you can see from the NASA GISS
graph (above) that trend is ever upward.
* Fullfact.org examines the "global warming stopped 16 years ago meme"
here.
* The Texas state climatologist examines "The Danger Of Looking For Patterns In Short Time Series" in the
Houston Chronice.
10 Charts That Make It Clear The Planet Just Keeps Warming.
Think Progress weighs in; here's an excerpt: "
Perhaps you thought that the whole “planet isn’t warming” meme was killed by this summer’s bombshell Koch-funded study.
After all, it found ”global warming is real,” “on the high end” and
“essentially all” due to carbon pollution. Sadly, denial springs
eternal. Long-debunked denier David Rose has an article
in the Daily Mail, “Global warming stopped 16 years ago, reveals Met
Office report quietly released … and here is the chart to prove it.” The
piece is so misleading, even the UK Met Office felt a need to instantly
debunk it with a blog post that included this chart."
"Global Warming Stopped 16 Years Ago"? That was the headline that appeared in the U.K.
Daily Mail
over the weekend. The reality is something different altogether. It
all comes down to cherry-picking which years you choose to graph, and
taking an (honest) look at the real trends. Here's a response from the
U.K. Met Office: "...
The
linear trend from August 1997 (in the middle of an exceptionally
strong El Nino) to August 2012 (coming at the tail end of a double-dip
La Nina) is about 0.03°C/decade, amounting to a temperature increase of
0.05°C over that period, but equally we could calculate the linear
trend from 1999, during the subsequent La Nina, and show a more
substantial warming. As we’ve stressed before, choosing a starting or
end point on short-term scales can be very misleading. Climate change
can only be detected from multi-decadal timescales due to the inherent
variability in the climate system. If you use a longer period from
HadCRUT4 the trend looks very different. For example, 1979 to 2011
shows 0.16°C/decade (or 0.15°C/decade in the NCDC dataset,
0.16°C/decade in GISS). Looking at successive decades over this period,
each decade was warmer than the previous – so the 1990s were warmer
than the 1980s, and the 2000s were warmer than both. Eight of the top
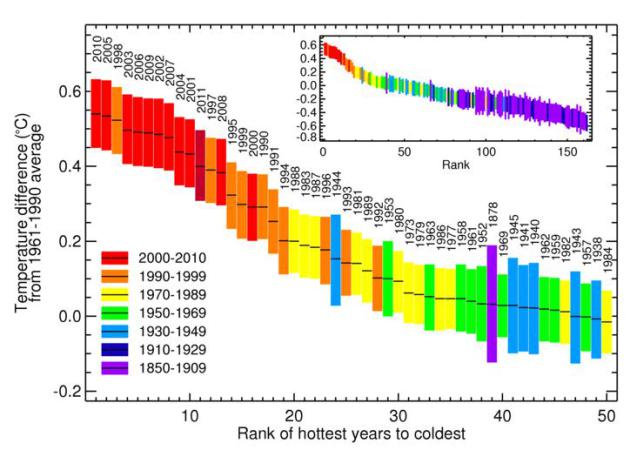
ten warmest years have occurred in the last decade..."
* Global Rank of Hottest Years To Coldest
graph above courtesy of the U.K. Met Office.
*
The Carbon Brief has more on the Daily Mail article, and the misrepresentation of science and long-term trends.
James - sorry to pile on with so many reports, but the "global
warming stopped" theme is demonstrably wrong, another attempt by
deniers to twist the data and the trends to create a smoke-screen of
confusion. I hope I answered your question.
We Have Been Warned. Is a crippling cyberattack
imminent? Actually, these attacks have been going on for some time,
impacting military, banking and various infrastructure URL's. The
question is when, and if, the rest of us will be affected. Could a
hacker in North Korea or Iran turn out the lights (or water) at your
house? It's not as crazy as it sounds. Here's an excerpt of a
Huffington Post story: "...
What's
more, unlike warfare of the past, attacks can come from obscure,
independent, malign hackers in basements anywhere in the world. And
they are at work. Pentagon computer systems are more or less constantly
under attack, too often successfully. So, in theory at least, we
could have iron-clad, cover-riveted treaties with Russia, China, India,
and virtually all other governments and none would protect us against
the rogue hacker. How will you know when the "cyber Pearl Harbor" has
occurred? When the lights and heat in your home go off. When you can't
make a phone call. When no ATM works. When your flight cannot land..."
* image above courtesy of dvice.com, which has an
excellent article on "The 7 Worst Cyberattacks In History (that we know about)."
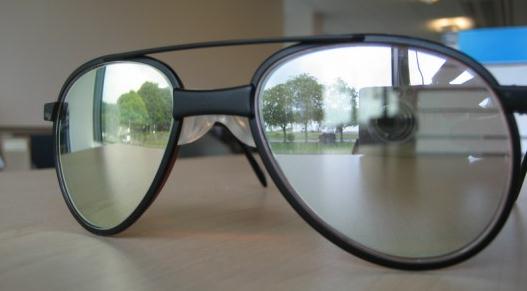
Ministry Of Defense Developing New Anti-Laser Eyewear.
With some of the recent (laser) attacks on commercial aircraft,
temporarily blinding pilots, this advance is coming at a good time, as
reported at
gizmag.com: "
Laser
pointers may be great fun to tease the cat with, but for pilots they
are a major hazard. The United States FAA reports over 2,000 incidents
every year of planes having lasers pointed at them - some of them
powerful enough to pop a balloon. To combat the danger that lasers pose
to aviation, the U.K. Ministry of Defence (MoD) is developing new eye
wear that can filter out a wide range of laser wavelengths."
Photo credit above: "
Prototype laser eye-protection spectacles." (Image: Crown Copyright/MoD)
Apple Has Quietly Started Tracking iPhone Users Again, And It's Tricky To Opt Out. Time to make a few changes in my iPhone 5.
Business Insider has the story - here's a clip: "...
For the last few months, iPhone
users have enjoyed an unusual environment in which advertisers have
been largely unable to track and target them in any meaningful way. In
iOS 6, however, tracking is most definitely back on, and it's more
effective than ever, multiple mobile advertising executives familiar
with IFA tell us. (Note that Apple doesn't mention IFA in its iOS 6 launch page). Users can switch off that targeting, but it's tricky, as we discovered a couple of days ago. Although at least iOS 6 users are able to turn off tracking, which they weren't before..."
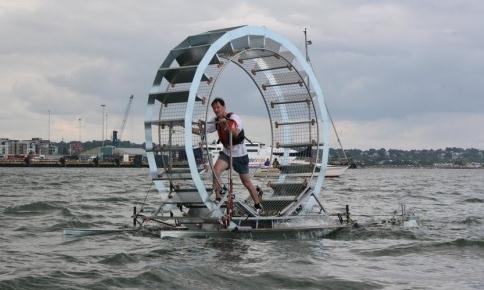
Man Attempts To "Walk" Across Irish Sea In A Human Hamster Wheel. Impressive on some level, but why? Guiness World Book of Records? A cry for help? TV coverage? Here's an excerpt from
gizmag.com: "
Thirty-five
year old Chris Todd has attempted to “walk” across 106 kilometers (66
miles) of open sea in a giant hamster wheel-like raft dubbed Tredalo.
Unfortunately, the plan to cross the Irish Sea – leaving from Wales and
arriving on the east coast of Ireland in the South of Dublin – didn’t
quite go to plan. Harsh weather conditions forced Todd to abort the
mission after approximately eight and a half hours and 42 kilometers
(26 miles) into the journey, when he encountered rudder problems..."
Photo credit above: "
Thirty-five year old Chris Todd has
attempted to “walk” across 106 kilometers (66 miles) of open sea in a
giant hamster wheel-like raft dubbed Tredalo."
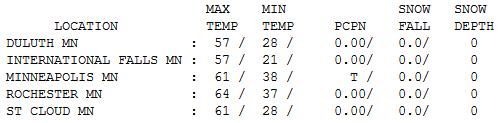
Not Bad (For mid-October). Sun gave way to
increasing clouds by late afternoon, a few evening sprinkles and light
showers, but all in all a nice day overall. Monday nights ranged from a
brisk 45 at Grand Marais (cold wind blowing off Lake Superior) to 61 at
St. Cloud and the Twin Cities, a balmy 68 at Redwood Falls.
Paul's Conservation Minnesota Outlook for the Twin Cities and all of Minnesota
TODAY: Partly sunny and unseasonably mild. Patchy mid and high clouds. Winds: W 10. High: 69
TUESDAY NIGHT: Partly to mostly cloudy. Low: 52
WEDNESDAY: Turning cooler, a few showers likely. High: 59
THURSDAY: A cold rain, steadiest/heaviest west of MSP. Low: 42. High: 48
FRIDAY: More clouds than sun, drier day - still chilly. Low: 37. High: near 51
SATURDAY: Sunny, breezy and pleasant - the brighter day of the weekend. Low: 36. High: 56
SUNDAY: Sun fades, clouds increase, a bit milder. Low: 43. High: 59
MONDAY: Chance of rain, still mild. Low: 48. High: near 60
The Winter Buzz
Do political attack ads qualify as air pollution? Thank God for the mute button.
My Facebook account (which somehow got hacked by
a North Korean a few weeks ago - go figure) is buzzing with winter
speculation. Susie Lees writes "Paul - We are into October now. Please
tell me you are seeing snow in the forecast for this winter. Starting in
December and right through February. Please!"
I've said it before - I'll say it again: based
on a weak El Nino, a likely negative phase of the NAO, and broad winter
trends over the last 30 years, I suspect Minnesota will see a tougher
winter than last year; over 45 inches snow, compared with 22 inches last
winter. We won't get off that easy, in spite of a nagging drought.
Last winter was a gift, the 3rd warmest in
Minnesota history. I just refuse to believe we'll be so lucky (or
unlucky if you like snow and cold) to have to gifts, back to back. The
upcoming winter should still be milder than average, but significantly
colder than 2011-2012.
From 70F today to 40s Thursday, with .1 to .3
inches of rain midweek. Temperatures aloft should stay warm enough for
rain. No slush this week. Skies clear for the weekend; more Indian
Summer early next week. Soak it up.
And Susie, I'm seeing 30s and flurries for Halloween. Better get out there and rake while it's still lukewarm!
* map above courtesy of Rob Guarino and
liveweatherblogs.com, which has a great summary of the variables involved in the extended winter outlook.
Climate Stories...
"The modern dogma is comfort at any cost..." - Aldo Leopold, 1949
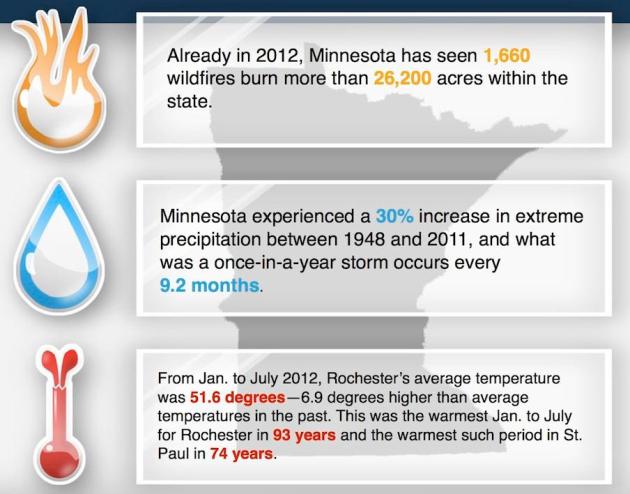
Weather factoids courtesy of
Environment Minnesota.
Global Climate Change: In The News Again! Here's a clip of a story from a theoretical physicist at Los Alamos National Laboratory at
Huffington Post: "...
The
only way to reduce carbon is to find a way to remove it from the
atmosphere. This is going to take science and engineering to be
accomplished. Since we have an energy dependent world, it is highly
unlikely that people will be willing to turn off their power and walk to
work. This is our main solution. Overall, this is not the end of the
world. The earth has dealt with much worse (asteroids, shifting plate
tectonics, and Snooki). Dramatic shifts in climate
means we will have to move or adapted to colder winters and hotter
summers. Luckily, we can adapt, but there will be casualties along the
way. People living on coastal regions will have to deal with more
violent storms and higher sea levels. Areas that once flourished may
become famished, and it is likely that cities like Amsterdam and New
York will have to deal with major flooding due to raising oceans. The
main point is there is work to be done and it is important for people
to understand the choices we are making, not for ourselves, but for
future generations."
* graphic above courtesy of
Think Progress. "
In
a 2010 presentation, Climate scientist Katherine Hayhoe has a figure
of what 1000 ppm would mean (derived from the 2010 NOAA-led report)."
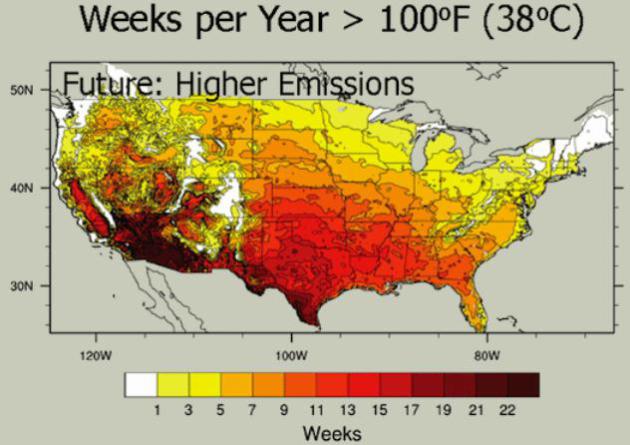
An Illustrated Guide To The Science Of Global Warming Impacts: How We Know Inaction Is The Gravest Threat Humanity Faces.
Here's a snippet of a recent article, an exhaustive and comprehensive
look at trends, impacts and long-term implications of climate change
from Joe Romm at
Think Progress that summarizes the costs of inaction with climate change: "
In
this post, I will summarize what the recent scientific literature says
are the key impacts we face in the coming decades if we stay anywhere
near our current emissions path. These include:
- Staggeringly high temperature rise, especially over land — some 10°F over much of the United States
- Permanent Dust Bowl conditions over the U.S. Southwest and
many other regions around the globe that are heavily populated and/or
heavily farmed.
- Sea level rise of some 1 foot by 2050, then 4 to 6 feet (or
more) by 2100, rising some 6 to 12 inches (or more) each decade
thereafter
- Massive species loss on land and sea — perhaps 50% or more of all biodiversity.
- Unexpected impacts — the fearsome “unknown unknowns”
- Much more extreme weather"
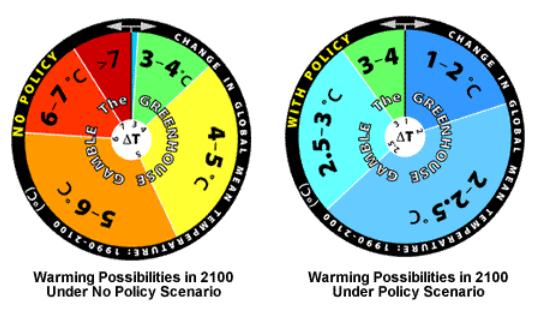
Graphic credit above: "
Humanity’s Choice (via M.I.T.):
Inaction (“No Policy”) eliminates most of the uncertainty about
whether future warming will be catastrophic. Aggressive emissions
reductions greatly improves humanity’s chances."
Global Renewable Energy Investments Continue To Grow. Here's an excerpt of an encouraging story from The
Worldwatch Institute: "
Emerging
from the global economic recession, investments in renewable energy
technologies continued their steady rise in 2011, with total new
investments in renewable power and fuels (excluding large hydropower
and solar hot water) reaching $257 billion, up from $220 billion in
2010. In a year marked by falling costs for renewable energy
technologies, net investment in renewable power capacity was $40 billion
greater than investment in fossil fuel capacity, according to new research conducted by the Worldwatch Institute’s Climate and Energy program (www.worldwatch.org) for the Institute’s Vital Signs Online
service. Total renewable energy investments in industrial countries in
2011 accounted for 65 percent of global investment, increasing 21
percent to $168 billion overall. In contrast, the 35 percent of global
new investment that went to developing countries increased 10 percent,
to $89 billion. Of that sum, China, India, and Brazil accounted for $71
billion in total investment. Investment in India grew 62 percent—the
highest growth rate for any single country over 2010 totals. In 2011,
“financial new investment” in renewable energy installations (a
category that excludes small-scale projects and R&D) in industrial
countries outpaced investments in the developing world, but in 2010
investments in this category in developing countries had surpassed
those in industrial countries for the first time..."
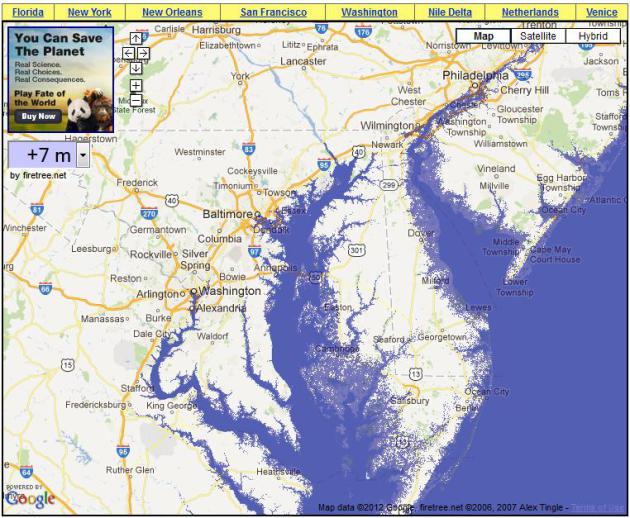
Sea Level Rising Toward Washington And Other Cities. Bill Blakemore from
ABC News reports: "
How
soon could ocean waters be lapping at Thomas Jefferson’s memorial on
the edge of the Washington Mall? City planners in Washington, D.C. — and
in most major coastal cities around the world — are asking such
questions as sea level rise, which the world’s climate scientists agree
is being caused by manmade global warming, accelerates. Recently, the
world’s climate experts have reported that global sea level rise is
speeding up much faster than they expected only a few years ago. They
now calculate there could well be a rise of another one to two meters
before the end of the century. This would mean serious flooding in many
sea level cities before mid century — within 40 years..."
* the map above from
geology.com
shows the impact of a 7 meter rise in water from D.C. to Philadelphia.
The concern isn't just rising sea levels, but huge "Nor'Easters"
superimposed on top of rising seas, where waves can be 10-15 feet above
normal.
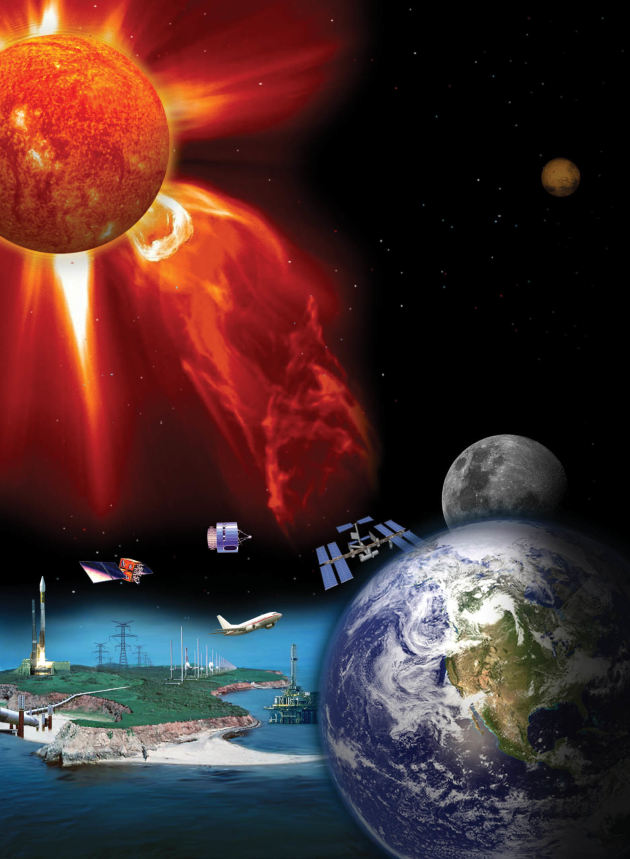
Don't Block The Sun. Here's an excerpt of a
New York Times Op-Ed that resonated with me: "...
Whether
you agree with my analysis of causality or not, the current situation
is transparently dysfunctional for all comers except the energy
incumbency. If you worry about energy security, the longer we stay
dependent on gas and oil the more we become dependent on those who
control the pipelines and the tanker routes. If you worry about climate
change, we need a low-carbon future that involves a retreat from carbon
fuels, not efforts to find and develop more. If you worry about both,
on a globe en route to six-degrees warming — a level that threatens the
very future of civilization — then an assault on the solar industry
becomes akin to sabotaging armaments factories during a mobilization for
war. It could be so different, so easily..." Image above: NASA.
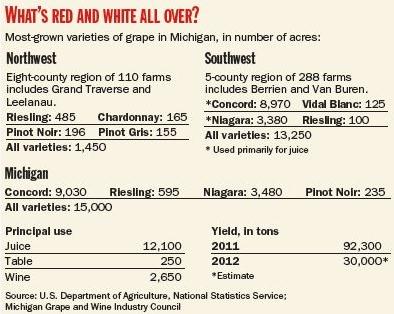
Warm Season Brings Wineries Fruitful Season. Wineries in northern Michigan? I had no idea.
Crain's Detroit Business has the story; here's a clip: "
Call
it global warming or climate change, it doesn't matter to winemaker
Lee Lutes. He calls the past few years of long, warm, dry summers an
"exceptional growing season" for his grapes. Last week, the head
winemaker at Black Star Farms helped harvest the crop
on the winery's 150 acres on the Leelanau and Old Mission peninsulas.
And while the region's crop of tart cherries was ruined by the
weather's mood swings in the spring -- 80 degrees in March, then frost
in May -- wine grapes mature later and, for the most part, survived if
not thrived. The variety of grapes grown in Michigan are really meant
for warmer regions. So climate change? Sure, bring it on. "I've been
making wine up here for 20-some years," Lutes said, "and things are
definitely different..."
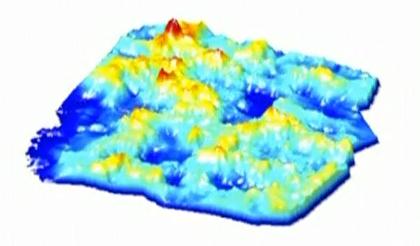
3-D Antarctic Map To Chart Impact Of Climate Change.
Reuters has more information and a video explaining an ambitous plan to map Antarctic in three dimensions: "
Oct.
15 - Climate scientists on a two-month voyage to East Antarctica, have
produced the first three dimensional map of sea ice in the region. The
researchers, from Australia's Antarctic Division, used a free-swimming
submarine to produce the map which, they say should reveal clues about
the impact of climate change. Rob Muir reports."
Causes Aside, Many Believe Louisville Area Is Already Feeling Impact Of Global Warming.
The Courier-Journal reports; here's the introduction: "
Until
a relentless heat baked Louisville with 10 days over 100 degrees this
summer, Bellarmine University wellness teacher Chris Catt was skeptical
about global warming. But now, “I’m a believer,” he says — so much so
that he is organizing a tree-planting campaign for his Dundee Estates
neighborhood because he noticed that it was so much hotter there than
just three blocks away, where towering shade trees line the roads. “The
lack of shade became really obvious,” he said. “It became unbearable to
walk on our street...”


No comments:
Post a Comment