67 F. high Sunday in the Twin Cities.
66 F. average high on May 5.
60 F. high on May 5, 2012.
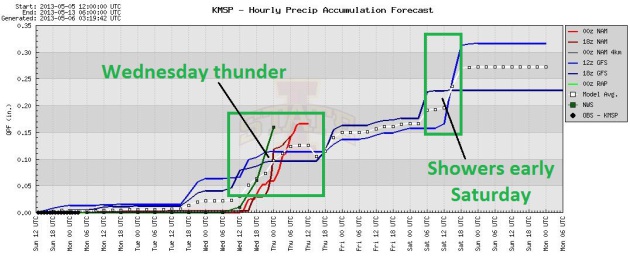
.20" rain predicted by Thursday morning.
Wednesday looks like the wettest day of the week.
70 F. possible today; 70s likely tomorrow.
No snow this week. Really.
Mellowing May
I'm grateful when someone has a good question or
thoughtful observation about the weather. Sunday, cheering on my wife
in the Lake Minnetonka Half Marathon, I wasn't so lucky. "Paul, are all
the local meteorologists in a cult? Do you swap stories and forecasts
and just hang out?" a stranger grinned.
Um, no. I have a lot of respect for all the
meteorologists in the Twin Cities. I try not to see what others are
saying, because it might subtly sway my outlook. Ask 5 forecasters -
you'll get 5 different opinions. Why? It all comes down to
interpretation of raw data.
It's the same reason why you can interview 5
financial planners and get 5 starkly different suggested portfolios.
Experience - which models to trust; predicting the future is as much art
as science.
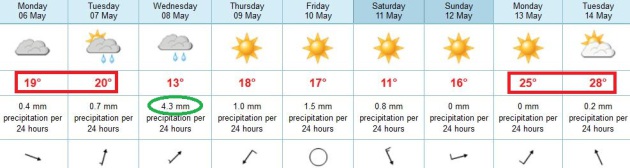
May kicks in this week; a distractingly nice
Monday & Tuesday with highs near 70. Thundershowers pop up
Wednesday; a cooler front sparking a few showers by early Saturday. Most
of Fishing Opener Weekend looks dry - Mother's Day the nicer day, as
southwest winds tug the mercury into the 60s. A potentially perfect day
at Race For The Cure.
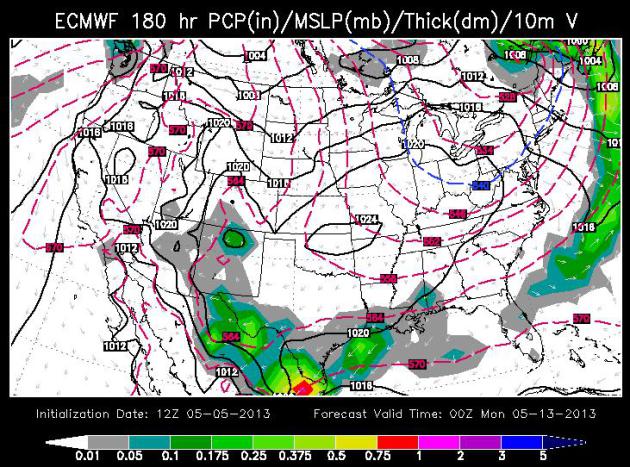
It's a fickle pattern; the ECMWF model has done a full-180, hinting at low 80s early next week.
Hang on!
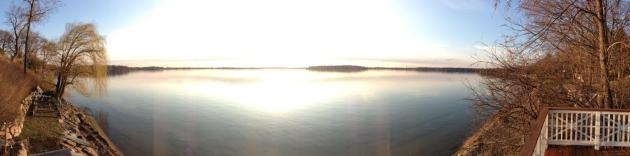
* photo above from WeatherNation TV Executive Producer Lori
Ryan, who was positively giddy about the magnolias blooming in her St.
Louis Park yard. Finally.
Clouds Vs. Snow. Look carefully at the stripe of
white over southeastern Minnesota and western Wisconsin. It's snow still
on the ground - and you can watch it melt before your very eyes.
Thicker clouds over western Minnesota kept Sunday highs in the low to
mid 50s. Visible cloud loop: WeatherTap.
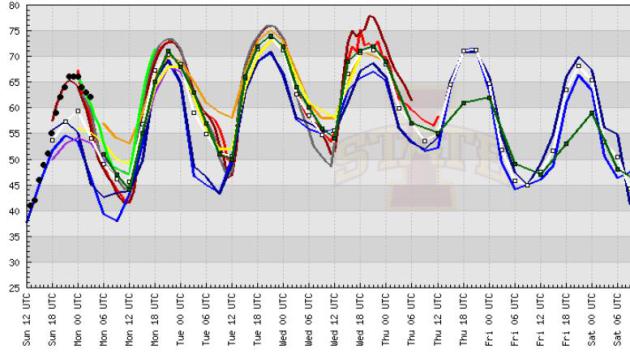
Looks Like...May. Expect 70+ highs today and
Tuesday, a late-week cooling trend, followed by an even warmer front
early next week. ECMWF model data shows highs topping 80F by Tuesday of
next week.
Long Overdue Temperature Inflation. The mercury
nudges 70F today, low to mid 70s Tuesday and Wednesday. Showers and a
few T-showers may drift in Wednesday; depending on the timing of any
midweek rain that could keep temperatures a few degrees cooler. A cold
front arrives early Saturday - highs may hold in the 50s with gusty
northwest winds and a rising barometer. Friday night may be the best
time to catch walleye, out ahead of the front.
A More Springlike Pattern: Midweek Convection? O.K.
Convection is meteorological slang for random small-scale showers and
T-storms, as opposed to stratiform precipitation, rain and snow that
impacts hundreds of thousands of square miles. Wednesday looks showery;
dew points and shear probably not high enough for any severe storms, but
a few heavy T-storms can't be ruled out. The next chance of showers:
Friday night and Saturday as a cooler front approaches.
Mother's Day Preview. The European model (courtesy
of WSI) shows a fairly strong southwest breeze kicking in next Sunday.
After a chilly start (30s) temperatures should reach the upper 50s to
mid 60s under a sunny sky - potentially good news for Race For The
Cure....and mom.
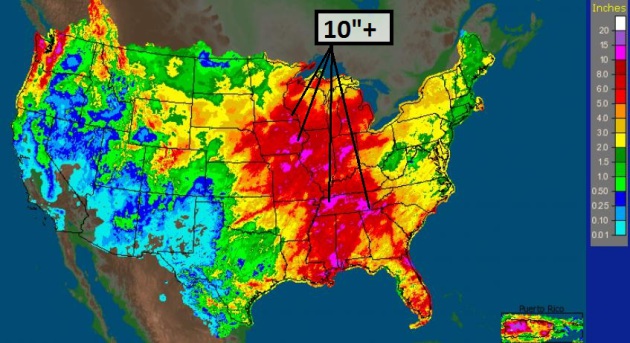
30 Day Precipitation.
NOAA data
shows some Doppler precipitation estimates in excess of 10" in the last
month from southeastern Minnesota to eastern Iowa, central Indiana to
the much of the Mid South and Gulf Coast. The drought is fading fast,
especially east of I-35.
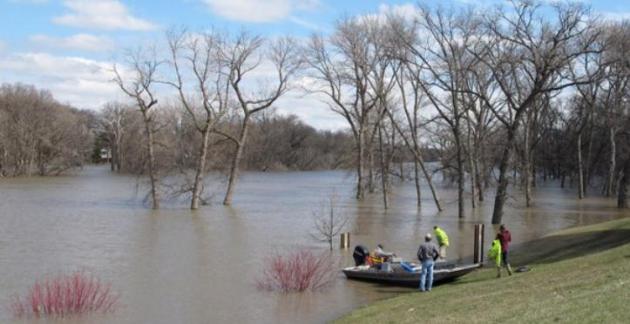
Forecasting A Flood: Reams Of Data, And Still An Imprecise Science.
You think predicting when showers will arrive or how many inches of
snow may fall is hard? Try predicting what time a river will crest, and
how high. Here's a segment of a story that captures the uncertainty, and
limits of flood forecasting, from
The Washington Post: "
Flood
forecasting in this part of the continent starts with models for
determining how much snow is on the ground. Observers record every
snowfall. But it’s even more important to figure out how much water is
in that snowpack, which requires melting samples. It can also be done by
going airborne to measure the natural radiation coming from the soil —
a factor affected by the water in the snowpack. Next up is more
modeling on what will happen when the snow melts, which includes a
dizzying number of variables. Is the ground frozen? How deep? How much
moisture is in the soil? Months of drought worked in Fargo’s favor this
year. So did a freeze-thaw cycle that melted snow and warmed the soil
during the day — giving runoff a place to go — and then slowed or
stopped the melting overnight..."
Photo credit: Dave Kolpack/Associated Press. "In
this April 30, 2013 photo, members of the U.S. Geological Survey
prepare to launch a boat on the Red River in Fargo, N.D. so a USGA
hydrologist can take stream flow measurements. Even with the treams of
data, forecasting a flood is still an imprecise science."
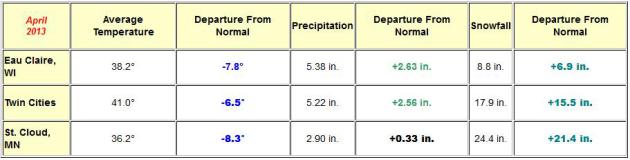
April Numbers. April was more than 6F colder than
average, 2.56" wetter than normal, with nearly 18" of snow (which is
15.5" snowier than average). More March than April. More details from
the
Twin Cities National Weather Service.
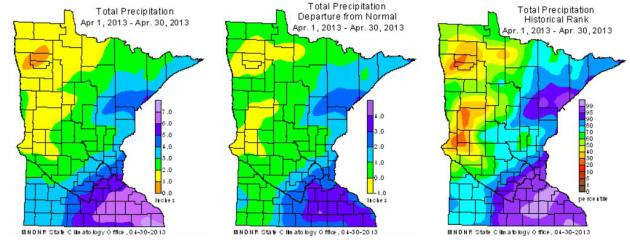
April Highlights - Emerging From Drought. Here's an excerpt of a good summary of April weather conditions statewide, from the
Minnesota DNR:
- April precipitation totals were
well above historical averages in the eastern one-half of Minnesota,
near to below historical averages for the western one-half of the
state. For many southeast Minnesota counties, monthly precipitation
totals topped the long-term average by more than three inches, erasing
drought concerns in those areas. Many observers reported measurable
precipitation on more than 20 days during the month. Some observers
reported precipitation on 10 or 11 consecutive days.
[see: April 2013 Precipitation Map | April 2013 Climate Summary Table]
- Ten winter storm warnings and numerous winter weather advisories
were issued for Minnesota counties by the National Weather Service
during the course of the April. Frequent, and often heavy, storms piled
up snowfall totals to record or near-record levels at many locations.
Historical average monthly snowfall totals range from two inches in
southern Minnesota to six inches in northern counties. In many Minnesota
communities, April 2013 monthly snowfall totals exceeded 12 inches.
Numerous locales reported monthly snowfall totals in excess of 24
inches. The focal point for the heaviest of the April snowstorms was
northeast Minnesota, particularly Duluth, where April snowfall reached
historic levels. The monthly snowfall total at Duluth's International
Airport was an astounding 50.8 inches. Not only did this top the
previous April record by nearly 20 inches, it was Duluth's snowiest month ever
for any month of the year. The April snow and cold snarled roads,
delayed agricultural field work, canceled outdoor events, and postponed
natural signs of spring by many weeks.
Sun Emits Mid-Level Flare. Here's an update from
NASA on Friday's M-Class flare: "
The
sun emitted a mid-level solar flare, peaking at 1:32 pm EDT on May 3,
2013. Solar flares are powerful bursts of radiation. Harmful radiation
from a flare cannot pass through Earth's atmosphere to physically
affect humans on the ground, however -- when intense enough -- they can
disturb the atmosphere in the layer where GPS and communications
signals travel. This disrupts the radio signals for as long as the
flare is ongoing, and the radio blackout for this flare has already
subsided."
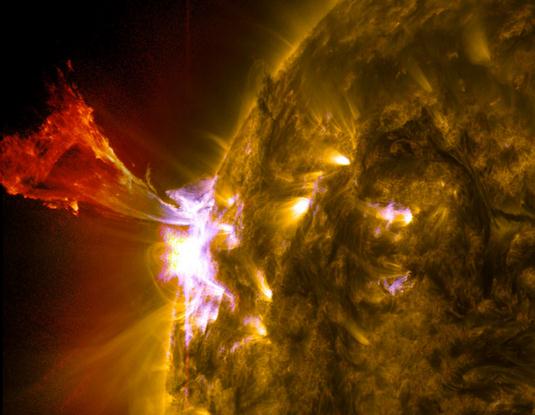
Image credit above: "
A burst of solar material leaps off
the left side of the sun in what’s known as a prominence eruption.
This image combines three images from NASA's Solar Dynamics Observatory
captured on May 3, 2013, at 1:45 pm EDT, just as an M-class solar
flare from the same region was subsiding. The images include light from
the 131-, 171- and 304-angstrom wavelengths.
" Credit: NASA/SDO/AIA
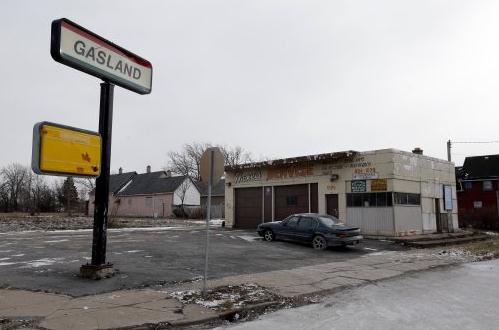
Farewell To The Gas Station: The Demise Of A Car Culture Icon. Here's a clip of an interesting article at
The Daily Beast: "...
According
to the trade publication National Petroleum News, the station
count—which includes public fueling stations, marinas, convenience
stores, gas stations, and hypermarkets that sell gas (e.g. Costco)—was
156,065 at the end of 2012, down 1,328, or about 1 percent, from 2011.
That marked the seventh consecutive year of decline. Since 2002, the
station count has fallen by nearly14,000, or about 8 percent. The trend
got started in the 1990s, when “hypermarkets,” – grocery store chains,
and retailers like Costco and Walmart – began to sell gasoline at
their big-box locations, said Jeff Lenard, a spokesperson at the
National Association of Convenience Stores. Just as Walmart and other
giants put pressure on mom-and-pop grocers and retailers, these huge
chains, with their ability to run on low margins, put some low-volume
gas stations out of business..."
Photo credit above: "
A Gasland gas station is out of business on a cold winter day on the east side of Buffalo, N.Y., Wednesday, Jan. 23, 2013." (David Duprey/AP)
No, Google Glass Is Not A Segway For Your Face. My favorite headline of the week; here's an excerpt from
pandodaily.com: “
Google Glass is so futuristic it’s like wearing a Segway on your face.”–
Tweet by Matt Novak
"
That Tweet likely articulates Google’s biggest fear for Glass,
its wearable computer. What if the cool crowd doesn’t accept it? What
if, like the Segway, it becomes an emblem of the awkwardly nerdy? What
if consumers reject the technology because, even though it’s amazing,
there’s too much social stigma to being seen in public with it?..."
Emerging From Hibernation - Again. Did it really
snow Friday morning? 18" Thursday in Blooming Prairie? It was hard to
believe yesterday, as skies cleared and temperatures surged into the 60s
over central and eastern Minnesota.
TODAY: Plenty of sun. Feels like spring! Winds: E 5. High: near 70
MONDAY NIGHT: Mostly clear. Low: 49
TUESDAY: Hard to focus. Close to perfect. Lukewarm sunshine. High: 74
WEDNESDAY: Unsettled. Showers, few T-storms. Wake-up: 54. High: 73
THURSDAY: Early shower. Lingering clouds, a drier day. Wake-up: 53. HIgh: 68
FRIDAY: Fading sun, showers far north. Wake-up: Wake-up: 49. High: 67
SATURDAY: Early shower, then clearing. Wake-up: 46. High: 57
MOTHER'S DAY: Sunny, turning milder. Wake-up: 39. High: 64
Climate Stories...
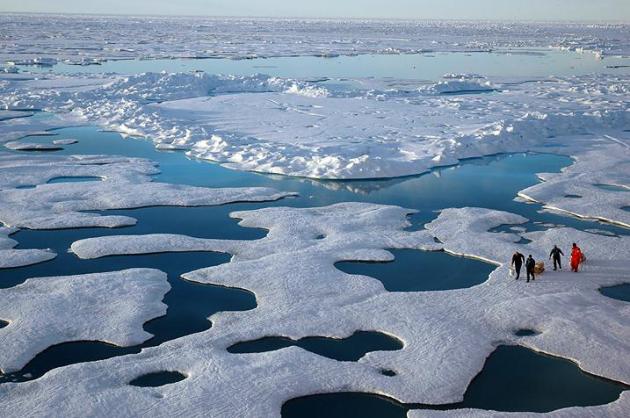
Arctic Nearly Free Of Summer Sea Ice During First Half Of 21st Century. Details from
NOAA: "
For
scientists studying summer sea ice in the Arctic, it’s not a question
of “if” there will be nearly ice-free summers, but “when.” And two
scientists say that “when” is sooner than many thought — before 2050
and possibly within the next decade or two. James Overland of NOAA’s Pacific Marine Environmental Laboratory and Muyin Wang of the NOAA Joint Institute for the Study of Atmosphere and Ocean
at the University of Washington, looked at three methods of
predicting when the Arctic will be nearly ice free in the summer. The
work was published recently online
in the American Geophysical Union publication Geophysical Research
Letters. “Rapid Arctic sea ice loss is probably the most visible
indicator of global climate change; it leads to shifts in ecosystems
and economic access, and potentially impacts weather throughout the
northern hemisphere,” said Overland. “Increased physical understanding
of rapid Arctic climate shifts and improved models are needed that
give a more detailed picture and timing of what to expect so we can
better prepare and adapt to such changes. Early loss of Arctic sea ice
gives immediacy to the issue of climate change...” (Photo: NOAA).
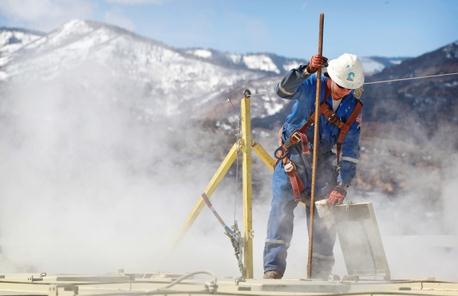
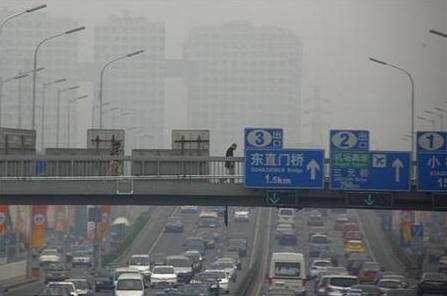
Chemical Soup Used In Fracking Includes Hydrochloric Acid, Antifreeze. Here's an excerpt from
The Vancouver Sun: "
Toxic
chemicals such as hydrochloric acid and ethylene glycol (antifreeze)
are among those pumped underground to help release natural gas through
hydraulic fracturing, according to a database operated by the B.C. Oil
and Gas Commission. Environment Canada wants gas companies to fully
disclose what fluids they inject deep underground during fracking, a
process that fractures shale rock with tonnes of sand, water and
chemicals injected at high pressure to get the gas out..."
Photo credit above: "
A worker checks water and
temperature levels in a series of tanks at an Encana hydraulic
fracturing operation at a gas drilling site in Colorado on March 29,
2013.
" Photograph by: Brennan Linsley , AP
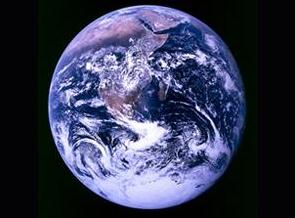
Getting Rich Off Global Warming. Here's an excerpt from
Salon: "
Local
officials and enviros are making plans for a post-global warming
America. And so are profit-seeking companies...He didn’t know anything
about the 20 federal agencies that just released adaptation planning
studies, or the dozen coastal states negotiating the early stages of
“managed retreat” and “coastal abandonment,” buzzwords for the work,
underway from Puget Sound to Brighton Beach, of accommodating rising
seas by contracting the contours of the U.S. map. Hughes didn’t know
about any of this. He just knew that the Elmhurst sewage and water
systems were buckling under the strains of the new normal, and that his
job was figuring out what to do about it. “The floods keep coming,
they keep getting worse, and every time there’s damage, everyone blames
me,” he said. “I’m here to learn more about what’s happening, and talk
to people dealing with the same problems...”
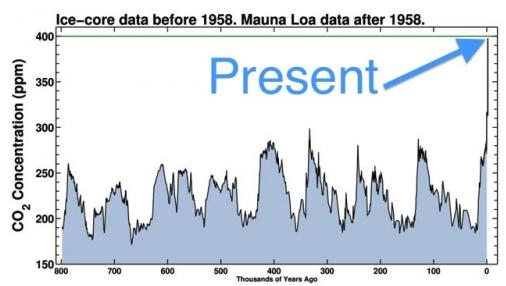
The Last Time CO2 Was This High Humans Didn't Exist.
Climate Central has the story; here's an excerpt: "
The
last time there was this much carbon dioxide (CO2) in the Earth's
atmosphere, modern humans didn't exist. Megatoothed sharks prowled the
oceans, the world's seas were up to 100 feet higher than they are today,
and the global average surface temperature was up to 11°F warmer than
it is now. As we near the record for the highest CO2 concentration in
human history — 400 parts per million — climate scientists worry about
where we were then, and where we're rapidly headed now. According to
data gathered at the Mauna Loa Observatory in Hawaii, the 400 ppm mark
may briefly be exceeded this month, when CO2 typically hits a seasonal
peak in the Northern Hemisphere, although it is more likely to take a
couple more years until it stays above that threshold, according to
Ralph Keeling, a researcher at the Scripps Institute of Oceanography..."
Graphic credit above: "
CO2 levels are far higher now than they have been for anything during the past 800,000 years." Scripps Institution of Oceanography.
NASA Study Projects Warming-Driven Changes In Global Rainfall. Here's an excerpt from a
NASA press release: "
A
NASA-led modeling study provides new evidence that global warming may
increase the risk for extreme rainfall and drought. The study shows for
the first time how rising carbon dioxide concentrations could affect
the entire range of rainfall types on Earth. Analysis of computer
simulations from 14 climate models indicates wet regions of the world,
such as the equatorial Pacific Ocean and Asian monsoon regions, will
see increases in heavy precipitation because of warming resulting from
projected increases in carbon dioxide levels. Arid land areas outside
the tropics and many regions with moderate rainfall could become drier.
The analysis provides a new assessment of global warming's impacts on
precipitation patterns around the world. The study was accepted for
publication in the American Geophysical Union journal Geophysical
Research Letters..."
Carbon Tax Is Best Way To Minimize Disastrous Climate Change: Opinion. Here's an excerpt of an Op-Ed from a Senior Engineer at JPL, The Jet Propulsion Laboratory, at the
Los Angeles Daily News: "...
This
is indeed the situation on Earth today. Earth's climate is changing
rapidly and there is grave concern about the potentially adverse
effects of these changes for life on the planet. Fossil fuels have
brought us breath-taking prosperity, but over the long term this wealth
is illusory because full-cost accounting hasn't been practiced "" for
example the high cost on the biosphere of burning coal, oil and gas.
Most of us are cost-conscious in making decisions, yet these
business-as-usual "cheap" energy sources will contribute to multiple
extinctions in the near future, leaving our children with only limited
and very expensive options. The problem is not so much today's climate.
As noticeable and frightening as the changes are to date, they're just
the tip of the iceberg and can be accommodated, barely. The alarming,
existential threat is the continuance of business-as-usual leading to
unprecedented heating. We have to be smart enough to anticipate this
heating trajectory and take steps to avoid it..." (Photo: Reuters).
"...
Last year was the 27th consecutive year with an above average
global temperature and the ninth warmest year on record. The years
between 2001 and 2012 were among the top 13 warmest on record." -
The Telegraph
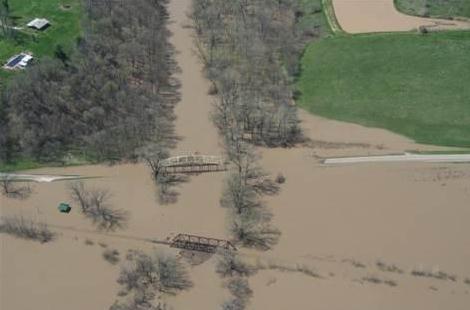
Climate Change Creates Maddening Weather Whiplash. Yep, that pretty much sums it up - from one extreme to the next. Here's an excerpt of a story from Discovery News and
NBC News: "...
The
term "weather whiplash" was first invoked to describe this effect by
science writer Andrew Freedman in 2009. But now climate scientists are
using the term, and pointing to the current floods, in the Midwest as
the classic case. "I'm using it now to describe the longer term kind of
flooding-drying cycles," said meteorologist Jeff Masters, co-founder
and director meteorology at the Weather Underground. "It's pretty
amazing. It used to be only one in three years were flood years. Now
it's almost every year." The whiplash has become especially painful in
river towns where just a few months ago dredging was needed to keep
goods afloat and keep communities alive. Now sandbags are the only
thing holding back the rivers from flooding the very same towns..."
Photo credit: Office of Missouri Gov. Jay Nixon via Reuters. "
Flooding
is seen along the Mississippi River near LaGrange, Missouri, in this
April 21, handout photo courtesy of the Missouri Governor's Office."


No comments:
Post a Comment