Fewer Complaints
Lou Holtz once said "“Never tell your problems
to anyone...20% don't care and the other 80% are glad you have them.”
That stuck with me over the years. Take the weather. Please!
People tell me "It's too hot, too humid, too cold, too wet, too dry, too windy or too sunny!" A long list.
Wake me up when it's just right.
Abe Lincoln nailed it when he too complained about not being able to please all the people all of the time. He got that right.
Four month ago I stood too close to the Doppler
and in a feverish rant predicted a cooler, stormier, wetter than
average summer. It's sort of working out that way, after all.
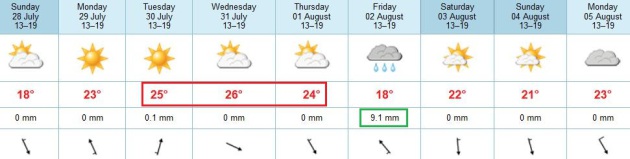
Yesterday's highly unusual July cut-off low is
pinwheeling east; warming temperatures aloft will mean more stable
atmosphere. Plan on pudgy afternoon cumulus, and after a chilly start we
mellow above 70F with less wind. Still a little cool for the lake, but
a more soothing balm for Minnesotans fretting about summer heat
slipping away.
80s return by midweek - but I see a cool bias
looking out the next 2 weeks. Is the hottest weather of summer behind
us? Probably.
Wednesday and Friday look stormy, but next
weekend will be better; highs in the 70s. Fewer jackets, scowls &
grumpy weather-complaints, I pray.
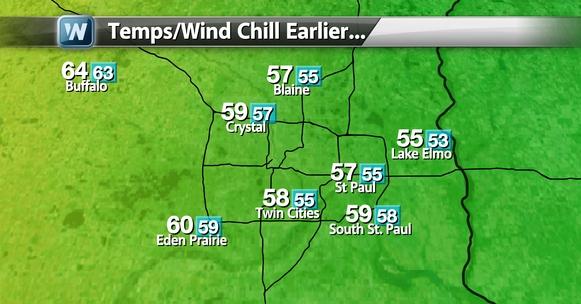
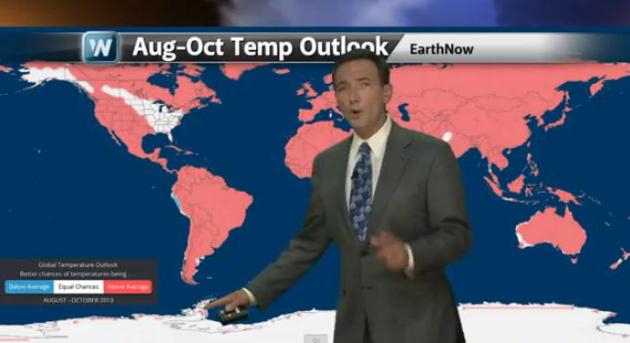
If You Don't Laugh You'll Weep. I took one look at
this map, screen-captured Saturday afternoon in the Twin Cities, and
I wanted to weep, or scream, or hurl. Or all of the above. Hey, it was
one ill-timed, nearly historic, Saturday July cold front. Courtesy:
WeatherNation TV.
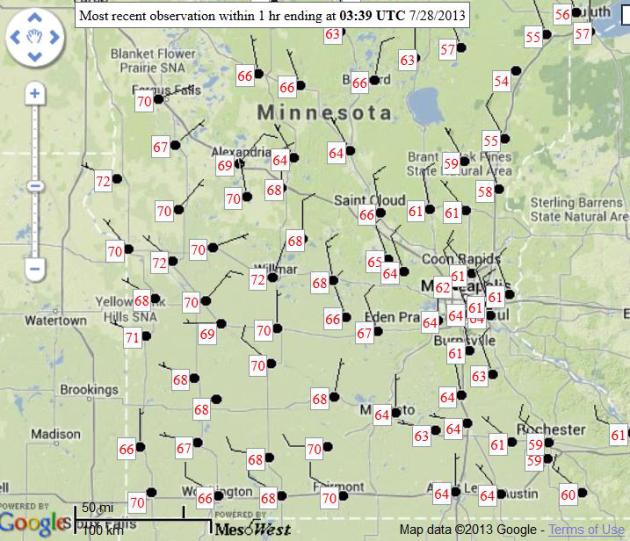
Saturday Highs. The coolest daytime maxes were
north/east of the Twin Cities, some mid-50s close to Duluth. Highs were
milder farther west, nudging 70 over western counties, farther away from
the cut-off low, where the sun was out part of the day. Map: MesoWest.
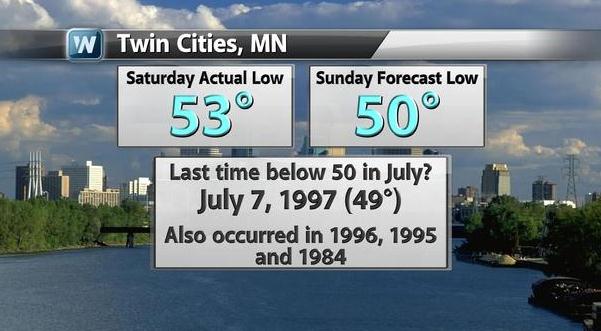
Coolest Since 1997. Unusual? Yes.
Unprecedented? Probably not. According to NOAA records the last time
Minneapolis - St. Paul saw July temperatures as cool as 49F. was 1997.
High Amplitude Pattern - 3 Sigma Deviation From Normal.
The north-south sweeps of the jet stream are highly unusual for late
July, over North America and Europe. According to Steve Scolnik at
CapitalClimate: "
What is unusual for this time year is the huge
amplitude of the upper-level flow; over 3 sigma deviation from normal
over North America."
European Heat Wave. Highs are forecast to soar to
record levels again toda from Italy and Austria into Germany and Poland,
some mid to upper 90s possible as a huge ridge of high pressure expands
northward. The same high-amplitude pattern affecting the USA and Canada
is also showing up on the other side of the pond. Map: meteocentre.com.
Mellowing Out. Temperatures
struggle to near 70F today with morning sun giving way to a mix of
clouds and sun by afternoon, less wind and drama than yesterday. Highs
nudge 80F by midweek, the best chance of showers and heavier T-storms
Friday. Next weekend? It has to be better/drier/milder. Right? ECMWF
forecast hghs above in Celsius.
Late September In Late July. A
buckling jet stream pours near-record chill into the USA, some of the
coolest July temperatures in a decade from the Upper Midwest to the
Great Lakes, the cool front weakening slightly by the time it reaches
New England. Dorian has weakened into a tropical wave, but the NAM model
shows a potential tropical storm approaching the Bahamas by Wednesday.
How Weather Wise Are You? Below are the questions I tried to stump Eric Eskola and Cathy Wurzer with on last Friday's edition of "
Almanac"
on TPT2, KTCA-TV, PBS serving the Twin Cities and much of Minnesota
and western Wisconsin. There are a few more challenging questions in
there - see how well you do (answers at the bottom). Please, no
cheating:
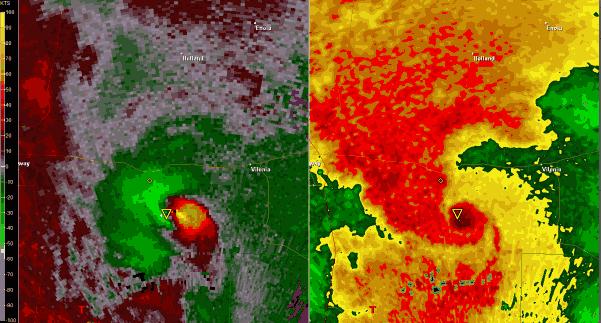
1). Doppler radar detects:
a). Tornadoes
b). Rotating thunderstorms
c). Unusually tall basketball players
2). Which is an absolute measure of how much water is in the air?
a). Dew point
b). Relative humidity
c). Heat index
3). Another name for clouds forming on the ground?
a). Smog
b). Nimbus
C). Fog
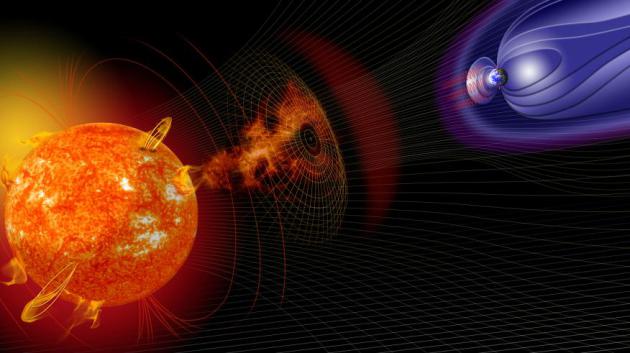
4). Solar flares are capable of triggering which of the following?
a). Major storms
b). Power outages
c). Northern Lights
5). To be considered “severe” a thunderstorm needs to produce:
a). baseball-size hail
b). 58 mph winds
c). 75 mph winds
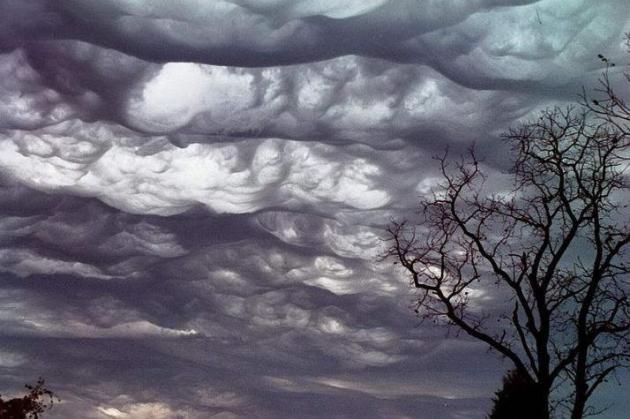
6). Recently a new cloud type was discovered/classified. Its name is:
a). Cumulonimbus Mammatus
b). Undulatus Asperatus
C). Altocumulus Castellatus
* photo above courtesy of Wikipedia.
7). The National Weather Service defines summer warnings using:
a). triangles
b). parallelograms
c). polygons
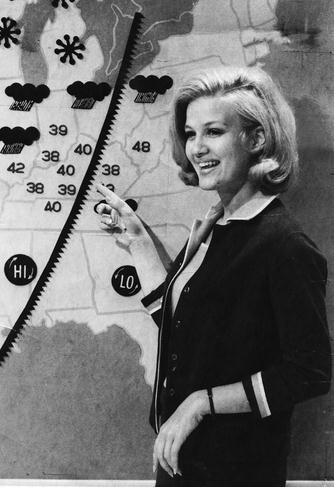
8). Who got their start as TV weather broadcasters?
a). Diane Sawyer
b). David Letterman
c). Pat Sajak
1). Answer: (b). It's very rare for individual tornadoes to show up
on Doppler radar, which does a good job showing the velocity of
rotation of the parent severe thunderstorm.
2). Answer: (a). Dew point is an absolute value, unlike relative humidity not dependent on the air temperature.
3). Answer: (c). Yes, fog is a lazy stratus cloud, one that forms on the ground.
4). Answer: (b) (c). Solar flares can disrupt radio communications
and GPS, sparking dazzling displays of the Northern Lights. Especially
strong X-class solar flares can even bring down portions of the power
grid.
5). Answer: (b). To be considered severe a thunderstorm needs to produce 58 mph+ winds and/or 1" diameter (quarter size) hail.
6). Answer: (b).
7). Answer: (c). Local National Weather Service offices no longer
issue warnings for entire counties, but portions of counties, using a
polygon to define the "high threat area", the actual track of a tornado
or severe storm.
8). Answer: (a) (b) (c). Pat Sajak was a Los Angeles weathercaster,
David Letterman reported weather in Indianapolis, where he coined the
expression "hail the size of canned hams") and yes, Diane Sawyer got
her start reporting and pointing at weather maps.
File photo of Diane Sawyer reporting TV weather in Louisville, Kentucky courtesy of
wdrb.com.
Weather Service Models Running On New, Vastly More Powerful Supercomputers. Meteorologist Jason Samenow at the Washington Post's
Capital Weather Gang has more information on the supercomputer upgrade; here's an excerpt: "
The
nation’s major weather forecasting models are now working their magic
on a new supercomputing powerhouse. On Thursday, the National Weather
Service (NWS) shifted its operational models onto a supercomputer more
than double the power of its predecessor, capable of performing 213
trillion calculations per second....The NWS has entered into a bit of
an arms race with the European Center for Medium-range Weather
Forecasting (ECMWF), which currently runs the more powerful and,
overall, more accurate global forecasting model. Following news of NWS’
planned computing upgrades in May, the ECMWF entered into a contract with supercomputer builder Cray to buy two new machines..."
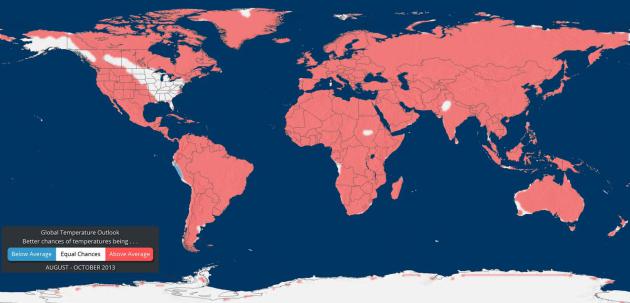
Autumn Outlook. The map above shows predicted temperature anomalies for the globe between August and October, courtesy of EarthNow and the
University of Wisconsin: "
The
data for the global temperature and precipitation outlooks are
provided by the International Research Institute for Climate and Society
(IRI). The IRI was established as a cooperative agreement between
NOAA’s Climate Program Office and Columbia University. It is part of The Earth Institute, Columbia University. The data for these maps are constructed primarily from several climate models, with some minor tweaks by climatologists."
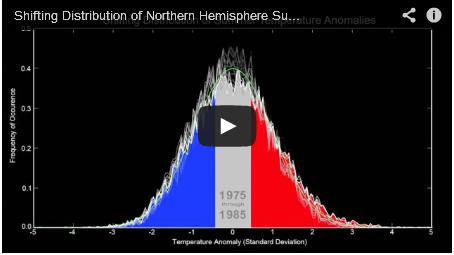
Short-Term Chill; Longer-Term Warm Bias? In spite of
the chill outside your window today some of the longer range models
are showing a warm bias for autumn, continuing the recent trend of
(milder) falls across Minnesota and the Upper Midwest. In today's
edition of
Climate Matters
we update Dorian, Flossie (which sounds like a bunny rabbit), and the
implications of a buckling of the jet stream into a very strange,
almost unheard-of July "cut-off" low.
Unusual Tornado On July 22. I thought this was especially interesting, an excerpt of Dr. Mark Seeley's always-excellent
WeatherTalk Newsletter: "
The
NOAA-National Weather Service Grand Forks Office reported on an
unusual tornado earlier this week that struck between Mahnomen and
Zerkel (Mahnomen County). This storm was unusual in several aspects:
firstly it struck between 1:50 AM and 2:30 AM on July 22nd (Monday), a
very rare time of day for tornadoes in our region (less than 2
percent of all tornadoes occur at that time of day); second, wind
speeds were estimated to range from 110-120 mph (EF-2 strength),
unusually strong for an overnight storm; thirdly, the storm path was
nearly 18 miles in length (though intermittently on the ground), a
relatively long storm path for an overnight storm. Thankfully this
tornado did not cause any deaths or injuries, but it did damage a
home, a number of farm structures, along with some farm equipment.
It also caused a good deal of tree damage, especially around Roy
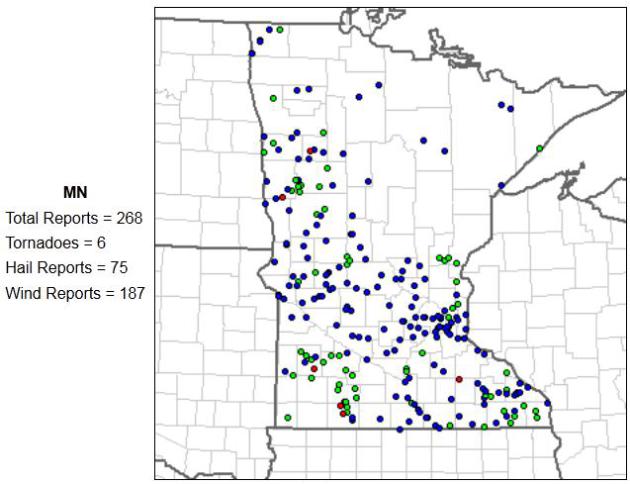
Lake. This was the 6th confirmed tornado of the year so far in
Minnesota. You can read more about the 2013 tornado season in
Minnesota at the MN State Climatology Office web site.....
http://www.climate.umn.edu/doc/journal/Tornado2013.htm
Map above:
SPC reports only 6 tornadoes in Minnesota so far in 2013.
20 Gripping Photos Of Extreme Weather.
Mashable
has the story (and remarkable photos). Here's the intro: "Although her
forces are still unmatched be even the most intelligent of man, we've
at least been able to document her mood swings. And, perhaps, we even
learn a thing or two about how to better understand her next time. We
pored over thousands of extreme
weather images to find out what Mother Nature had to say..."
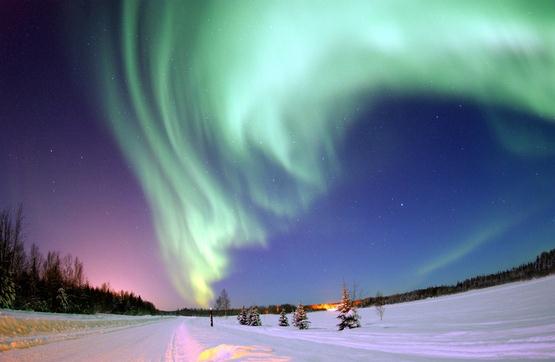
Photo credit above: "
Aurora Over Alaska: The
digitally enhanced photograph taken in January 2005 shows a spectacular
aurora borealis above the frozen landscape of Bear Lake, Alaska. The
image was voted Wikipedia Commons Picture of the Year for 2006." Image: Joshua Strang, USAF, Wikipedia, caption via NASA.
Thought For The Day...
"So for a few days, our weather is being influenced
by “Canadian Air” as meteorologists around here and probably across
the country refer to it as. My question is, do Canadian meteorologists
refer to air invading from the south as “American Air”?
Roger Kormendy
Prior Lake
Which U.S. City Has The Worst Drivers? O.K. Boston
would get my vote, and I've heard some crazy stories from my father
about driving in Detroit (at least in a German-built vehicle). The
answer didn't surprise me too much, come to think of it.
Slate has the cautionary tale - here's an excerpt : "...
Still,
the Allstate report is both a useful indicator and a good way to
winnow down the candidates. We can safely assume that the city with the
worst drivers is somewhere in Allstate’s bottom 50. Phoenix,
Indianapolis, and Denver, therefore, are off the hook, along with a raft
of others. One notable escapee is San Diego, the city with the most drunk driving arrests.
Let’s also ignore cities with populations below 150,000, because
data on those places is limited. Plus, few people have ever said,
“Hayward, California has the worst drivers!” We’ll add Boston back
into the mix, based on opinion surveys. (You’re not getting off that
easy, Boston.) That leaves 39 candidates..."
Graphic credit: Alex Eben Meyer.
"Quickboat" Foldable Boat: From Roof Rack To Water In 60 Seconds. If towing a boat is just too much trouble, now you can unfold one? I'm almost afraid to see what comes next. Gizmag.com has the details: "Think
it takes more time to build a boat than make a French omelette?
Think again. The Quickboat is the first foldable boat we've seen that a
team of two can put together in a minute or less. That's insanely
fast compared to the build times of other foldable boats we've
covered, such as the Transporter (10 minutes) and the Smartkat
(20 minutes). In fact, the boat is so easy to construct says Deryck
Graham, the Managing Director of Australian company Quickboats, that
one person with a beer in hand could assemble the boat in three
minutes even with friends around to distract them..."
Climate Stories...
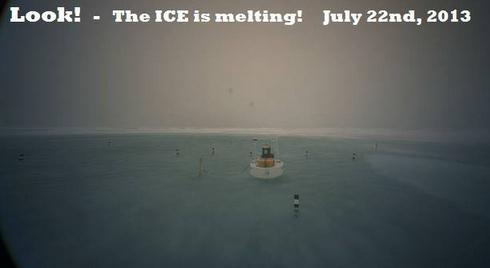
North Pole Lake Found By Environmental Observatory, May Be Evidence Of Global Warming (Photo). International Business Times has the story; here's the intro: "
The freezing tundra that was the North Pole is now home to a lake. A picture, obtained by the North Pole Environmental Observatory
this week, shows a shocking wide-angled photograph of the location’s
newest lake, possible evidence of global warming. According to experts,
this isn’t the first or the most severe water mass to appear in the
northern hemisphere. “I have seen much more extensive ponding,”
principal investigator for the North Pole Environmental Observatory,
James Morison, told The Atlantic
Wednesday, who said the image is misleading. “Because we use
wide-angle lenses, the melt pond looks much bigger than it is,” he
said. The lake, which was photographed by the observatory’s weather
buoy-attached camera Monday, is reportedly a result of the longtime
decline of sea ice in the region due to global warming and the more
recent increase in land temperature..."
Photo credit above: "
A newly discovered lake in the North Pole was photographed by the North Pole Environmental Observatory Monday." Facebook
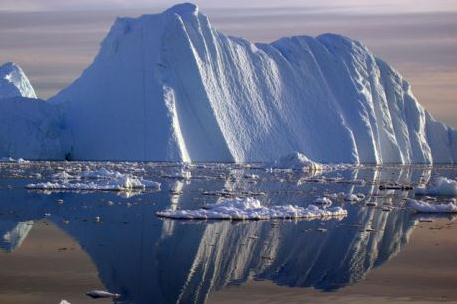
The Truth Behind That $60 Trillion Climate Change Price Tag. A staggering number indeed - alarmist hype, or within the realm of scientific possibilty? Here's a clip from
takepart.com: "
This week, news broke that if all the methane off the East Siberian seafloor was released, the fallout would cost $60 trillion—a
huge, staggering number. For comparison’s sake, the world’s GDP is $70
trillion. The findings assume that 50 gigatons of methane would be
released over the course of 10-to-20 years in a warming pulse....Very
large numbers make us sit up and take notice, but they’re also hard to
grasp. What is climate change currently costing even without that
warming pulse? A NRDC report
estimates that American taxpayers, through the federal government,
paid $100 billion in 2012—more than the cost of education or
transportation. (And that doesn’t include what state and local
governments, insurers, or private citizens paid.) Mann estimates the
global cost at $1.4 trillion per year in coastal damage, droughts,
fires, floods and hurricanes..."
Photo credit above: "
An iceberg carved from a glacier floats in the Jacobshavn fjord in south-west Greenland." (Photo: Konrad Steffen / Reuters).
Adapt, Move Or Die: The Pressures Of Global Warming. Here's the intro to a story at Australia's
The Conversation: "
We
all know that weather is not the same as climate, but it is
surprising how our perceptions of global warming vary according to what
we see outside our window. In the UK for example, last year’s
washed-out summer took the focus off global climate warming in many
people’s minds – maybe the current heatwave will change that. But
regardless of what may be happening in our back yards, the long term
trend is one of warming – which it has done globally by an average of
0.74C˚ over the past century.
As the climate warms up, animals and plants have three main
alternatives: they can either move to track the temperature, stay put
and adapt to the warming, or die. Responding to variation in climate is
not a new phenomenon for species – after all, many species responded
to climate warming after the last ice ages..."
Photo credit above: "
Don’t want to move home?"
MissTessmacher.
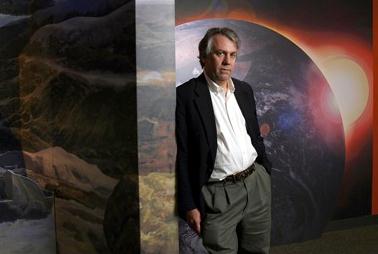
Global Warming And The Future Of Storms.
The Guardian has the story, co-authored by St. Thomas climate scientist John Abraham. Here's an excerpt: "...
I asked Dr. Emanuel to summarize the present understanding of hurricanes, and he responded with the following insights:
• The incidence of high-intensity tropical cyclones
(Safir-Simpson categories 3-5) should increase, and the amount of
rainfall in these storms should increase, upping the potential for
freshwater flooding. These changes will not necessarily occur where
tropical cyclones develop and thrive today. "Indeed," wrote Emanuel,
"it is likely that there will be decreasing activity in some places,
and increasing activity in others; models do not agree on such regional
changes."
• Though experts disagree on this point, Emanuel's work suggests
that weak events (tropical storms and Cat 1-2 storms) will become
more frequent.
• "Very little work has been done on the problem of storm size,"
wrote Emanuel, "what little research has been done suggests that
storm diameters may increase with global temperature. This can have a
profound influence on storm surges, which are the biggest killers in
tropical cyclone disasters..."
Photo credit:
Dr. Kerry Emanuel, MIT.
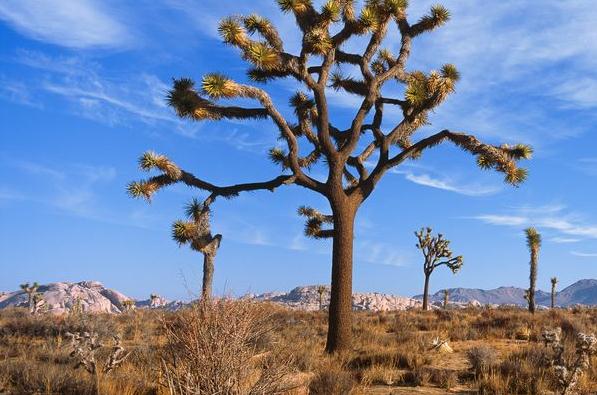
Desert Storm: Battle Brews Over Obama Renewable Energy Plan.
National Geographic Daily News has the story; here's the introduction: "
America's
deserts are stark, quiet places, where isolation and the elements
have long kept development at bay. To outsiders, these arid expanses
may not seem like prized land. But they are poised to play a key role—and perhaps, to serve as a battleground—in President Obama's plan to double U.S. electricity from wind, solar, and geothermal sources
by 2020. To help ramp up that amount of clean energy, the White
House has urged approval of an additional 10,000 megawatts of
renewable energy production on public lands. Estimates vary on
exactly how many households would be served by the expansion, but the Obama Administration says
the 25 utility-scale solar facilities, nine wind farms, and 11
geothermal plants it has approved on federal lands so far will provide
enough juice to power 4.4 million homes. One thing is for certain: The
new drive for large-scale solar will require land..."
Photo credit above: "
Joshua Tree National Park soon will
share its California desert skies with a new close neighbor, a huge
solar farm. It's part of a big renewable energy drive on public land." Photograph by Bill Hatcher, National Geographic.
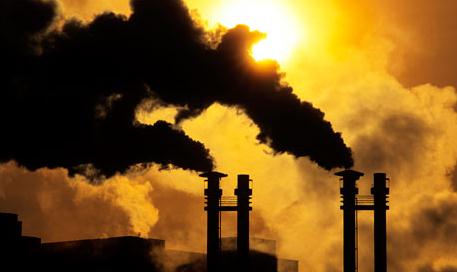
Fossil Fuels To Dominate World Energy Use Through 2040. Meteorologist Andrew Freedman has the story at
Climate Central; here's an excerpt: "
Global
energy consumption will grow by 56 percent by 2040 with fossil fuels
remaining dominant energy sources. Along with that growth will come
increased carbon dioxide emissions and a continued reliance on coal,
oil, and natural gas for transportation and electricity generation,
according to a new report published Thursday by the Energy Information Administration (EIA). The International Energy Outlook,
which is released every two years, shows that strong economic growth
in developing countries will be the dominant force driving world
energy markets during that period. “Rising prosperity in China and
India is a major factor in the outlook for global energy demand. These
two countries combined account for half the world’s total increase
in energy use through 2040,” said EIA administrator Adam Sieminski in
a press release. The EIA is the Department of Energy’s statistical
and analytical agency..."
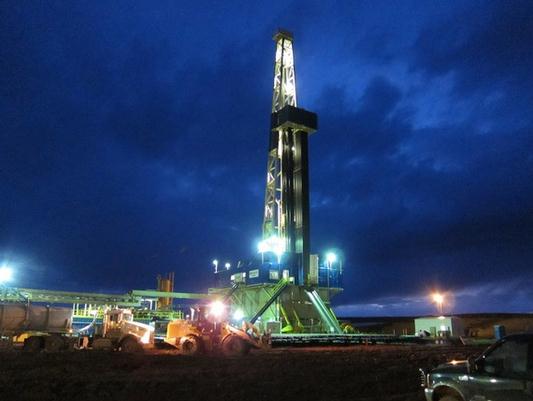
Former CIA Director: Fixing The U.S. Energy Strategy. Here's a clip of an interesting Op-ed at livescience.com: "...The
key to reducing the political and economic cloud of questionable
fuel-vending nations is to reduce overall demand - and, thus, the market
price and profits - for oil. While we can't take millions of
conventional-fuel vehicles out of the U.S. fleet overnight, there may be
cheap and effective ways to accelerate the use of alternative fuels
and increase energy independence. In particular, Woolsey believes in
the potential for a market for ethanol and methanol derived from U.S.
natural gas. With the current price of natural gas sitting around
one-fifth that of oil, developing methanol-based fuels to add them as a
choice at the pump could potentially take enough demand away from oil
to drive prices down to $60 per barrel or less....
Photo credit: "A drilling rig in North Dakota near the town of Stanley. Fracking is used in this area to tap oil reserves."
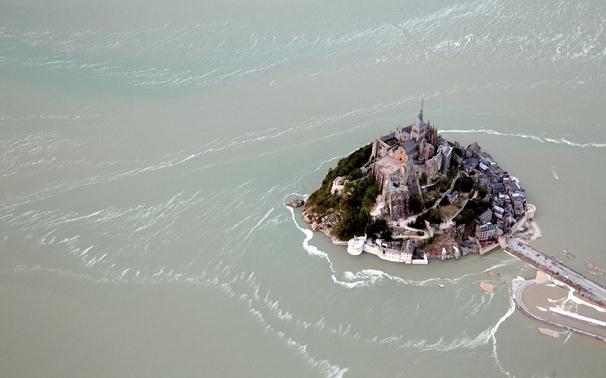
Mont St. Michel Becomes An Island For The First Time Since 1879. The story from
The Telegraph; here's a clip: "
Hundreds
of people gathered to watch the event on Wednesday evening, which
only lasted about 20 minutes, as the English Channel entirely
surrounded the Unesco world heritage site. "For the first time in a
long time we will see the sea surround the Mont," Laurent Beauvais,
president of the Basse-Normandie region, told Le Figaro. "It's rare
and we're here," an unnamed couple told Le Parisienne. "We came at the
right time..."
Photo credit above: "
Mont Saint-Michel at high tide."
Photo: AFP
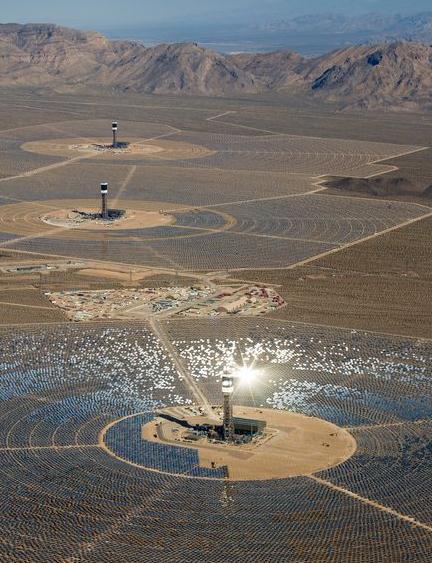
Mohave Mirrors: World's Largest Solar Energy Ready To Shine.
National Geographic has the story; here's the intro: "
More than six years in the making, the Ivanpah plant is now slated to begin generating power before summer's end. It was designed by BrightSource Energy
to use more than 170,000 mirrors to focus sunlight onto boilers
positioned atop three towers, which reach nearly 500 feet (150 meters)
into the dry desert air. The reflected sunlight heats water in the
boilers to make steam, which turns turbines to generate
electricity—enough to power more than 140,000 homes.."
Photo credit above: "
The huge Ivanpah solar plant is part
of a push to expand renewable energy on U.S. federal land. The
developer took steps to relocate a population of the endangered desert
tortoise, below." Photograph by Jim West, Alamy.


No comments:
Post a Comment