-17 F. Thursday morning, second coldest of the winter, to-date.
-5 F. high temperature yesterday at MSP International.
24 F. average high on January 23.
17 F. high on January 23, 2013.
11" snow on the ground.
Minnesota Weather History on January 23. Data: Twin Cities National Weather Service.
1968: A rare severe thunderstorm hits the Twin Cities and left a coating of ice an inch thick. 10 thousand homes were without power.
1950:
Ice storm over southwest Minnesota. Ice on telephone wires from 1/3 to
1.5 inches. Bismarck, North Dakota had 17 inches of snow. A Northern
Pacific passenger train derailed at Detroit Lakes with no injuries.
1925:
Solar eclipse seen across northern Minnesota during the morning. The
Duluth Herald reported that chickens were "puzzled by the dark morning"
and didn't leave their roosts.
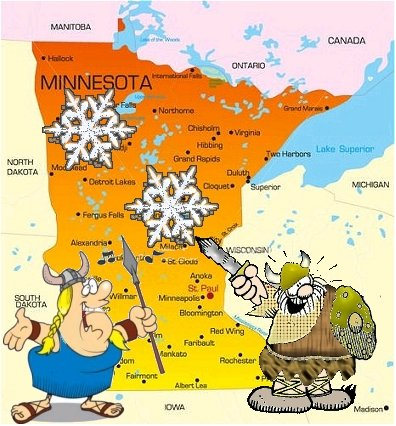
Stay Classy Minnesota
"Paul,
the Farmer's Almanac was right about this winter" a nice lady at the
Mall of America reminded me yesterday. She's right. Let's give credit
where credit is due.
My bootleg copy predicted a bitter winter for
the Upper Midwest with above-average snowfall. Then again a broken
clock is right twice a day. Hey, I'm keeping an open mind - about a lot
of things. Including the health benefits of numbing, bug-optional,
humidity-free air.
On Wednesday Belinda read a tweet on KARE-11
which made me do a double-take. "Do schools in Canada close for cold
weather?" Great question. I have a hunch most schools will close Monday,
when highs range from -4 to -10F, a windchill dipping to -40F in the
metro.
Risk of a polar bear.
This next shot will come in two
waves: front #1 sparking an inch or two of snow later today, another
couple of inches Saturday as the main spoke of the polar vortex rotates
south. Temperatures tumble Sunday, a subzero Monday gives way to
moderation by midweek.
Look at the bright side: annoying relatives
won't show up at your doorstep anytime soon. 41 minutes of additional
daylight since December 21. Twins Home Opener tickets go on sale today!
Hurry up spring.
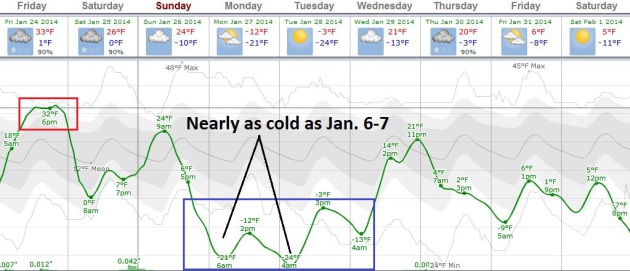
May I Be Excused?
At the rate we're going I may run, not walk, to MSP International and
catch the first (cheap) flight south I can find. After peaking near
freezing later today a cold surge to rival January 6-7 arrives Sunday
night into Wednesday morning. Monday will probably bring the coldest
daytime high, Tuesday morning the coldest nighttime low (close to -20F
in the MSP metro). Slight moderation is likely the latter half of next
week, but tulips won't be popping up anytime soon. Graph: Weatherspark.
Another Major Canadian Leak.
Truth be told meteorologists have been talking about the "Polar Vortex"
since the 1960s. It's not a new term. It simply means a buckle in the
jet stream capable of pushing arctic air as far south as the USA, and
it's not as rare as some have made it out to be in recent weeks. It's
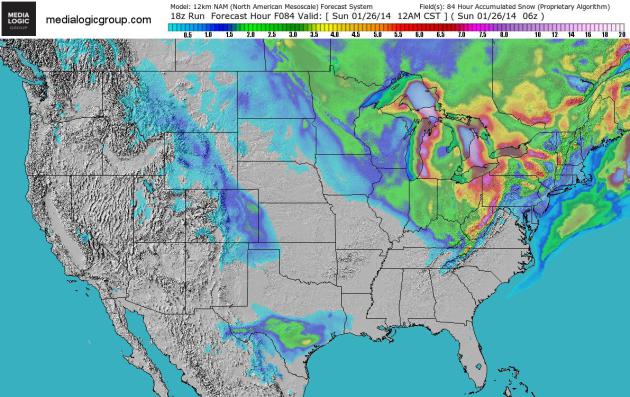
just one more thing to promote/hype, right? The 84-hour temperature
animation shows subzero air across the Upper Midwest into the Great
Lakes and New England early next week. NAM guidance: NOAA and Ham
Weather.
Ski Texas.
Enough cold air will penetrate south (an old fashioned "Blue Norther")
for a little slush from near San Antonio to Austin, but the heaviest
snows into Sunday fall downwind of the Great Lakes.
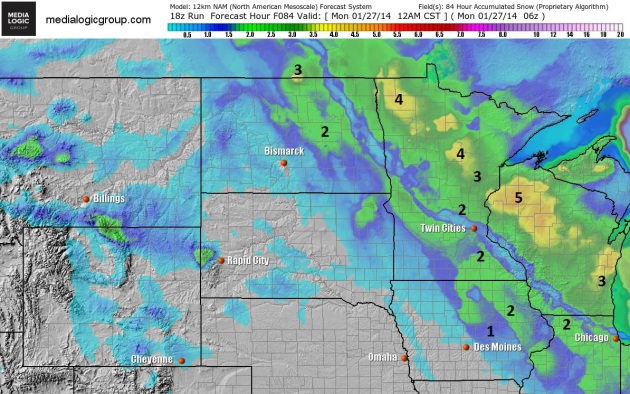
Family of Clippers.
A burst of snow is likely today, another surge of light snow late
Saturday and Saturday night as the next Mother Lode of numbing air
arrives. The heaviest snow bands will set up north of the storm track,
some 4"+ amounts from near Roseau to Hibbing, Duluth and Hayward, WI,
maybe 2-3" for parts of the MSP metro. NAM guidance: NOAA and Ham
Weather.
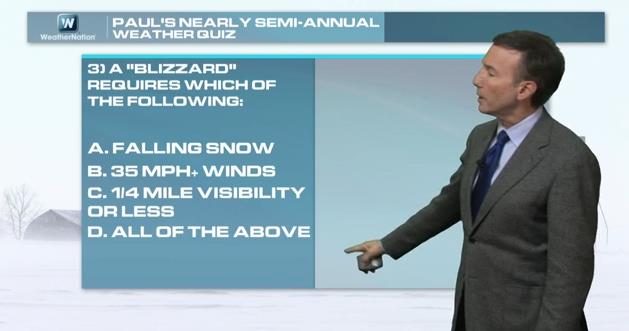
Paul's Nearly Semi-Annual Winter Weather Quiz. Enough pontificating, pointing and gesturing. In today's edition of
Climate Matters we track the Polar Vortex, ask the rhetorical question "
Is
Canada about to run out of cold air?" and pose a series of questions to
test your winter weather knowledge: "WeatherNationTV Chief
Meteorologist Paul Douglas does a weather Q&A. Who or what can feel
wind chill? Does it matter how cold the storm is to create treacherous
conditions? What do you do if you get frost bite? He dispels some old
wives (and husbands) tales as another hunk of the polar vortex is
forecast to make its way into much of the United States."
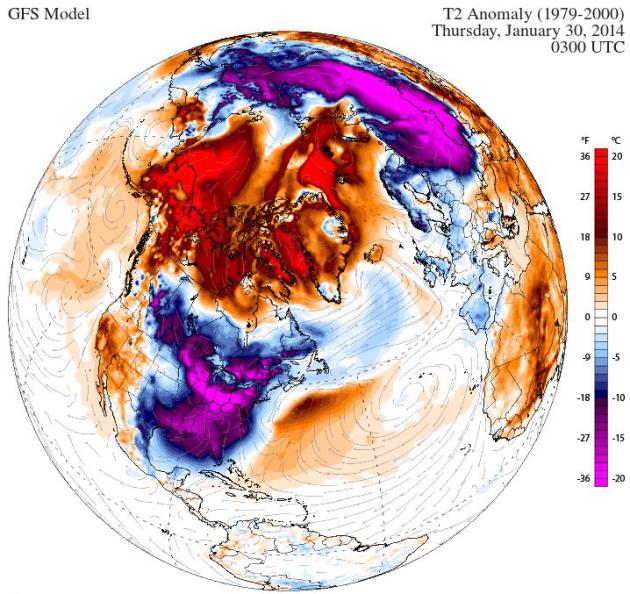
Temperature Anomalies Next Thursday.
Climate Reanalyzer shows temperature departures from normal; some
20-30F colder than average for a big chunk of real estate from the
Dakotas and Minnesota into the Mid Atlantic Region, while much of
Canada, Alaska and the Arctic runs 20-30F above average by the end of
next week. Could it be that Canada is about to run out of cold air?
Dream on.
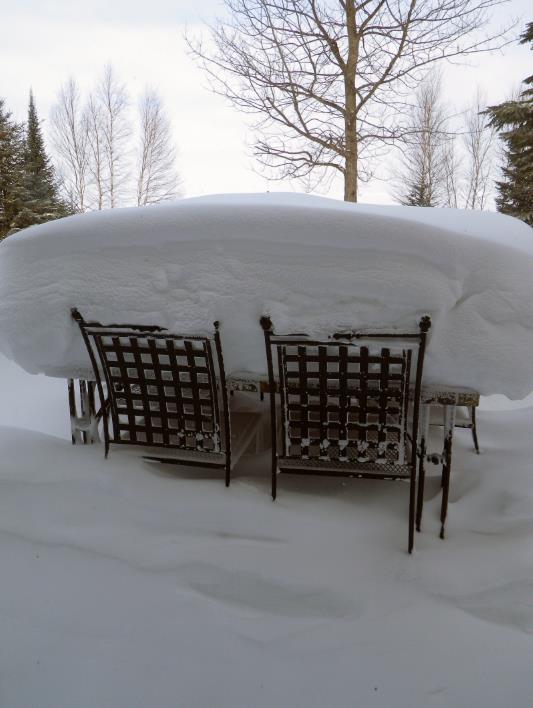
Serious Lake Effect.
Thanks to my friend, Pete Schenck, who lives up in Herbster, Wisconsin,
on the southern shoreline of Lake Superior, who snapped this photo of
the (new) snow on his patio. Good grief.
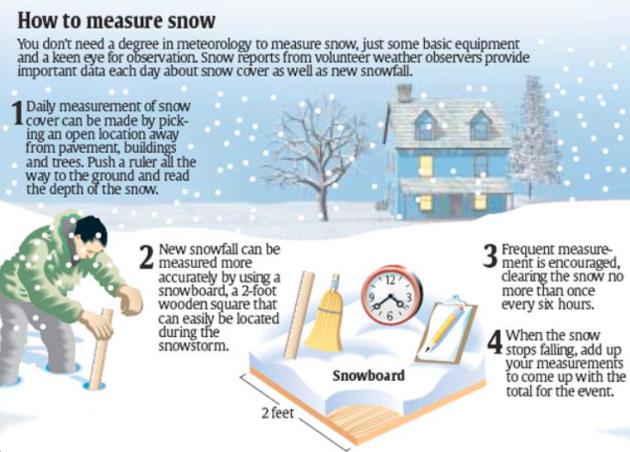
How To Measure Snow.
Yes, it's fairly straightforward, but you want to take an average of
several measurements, and how many of us realize that a "snowboard"
increases the accuracy of the measurement?
Graphic courtesy of NOAA and the Lake Charles (Louisiana!) National Weather Service.
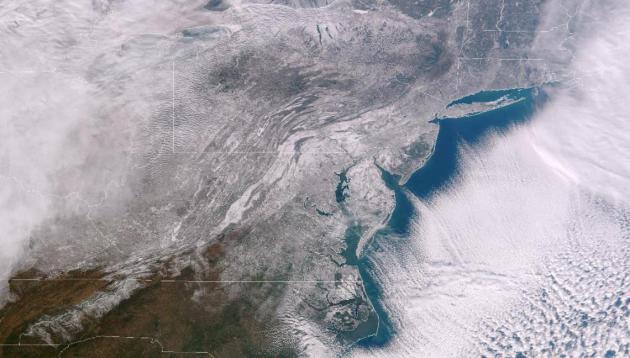
Snow Cover From Space.
You can see how far south the snow bands from the early-week snowstorm
extended, into the hills of North Carolina and Tennessee.
Visible image courtesy of the Charleston, West Virginia National Weather Service office.
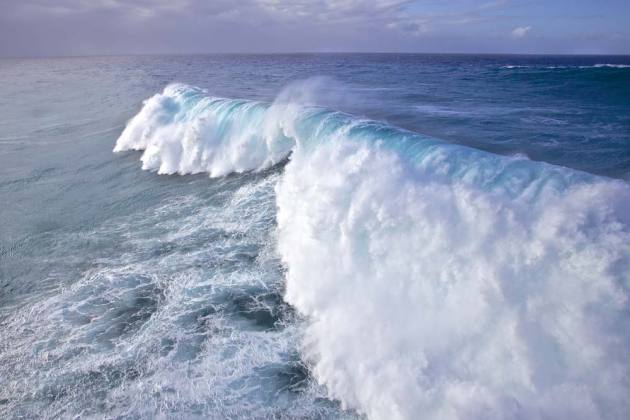
Largest Swell In Decades Hits Hawaiian Shore; 40-50 Foot Waves Roll In.
Good grief. Much of America is freezing (or worse), California is in an
epic drought with surreal January wildfires, and Hawaii is being
battered by monster waves. Other than that it's going well. Here's a
clip from
Hawaii News Now: "
Giant
waves with 40 to 50 foot faces are pounding north shore beaches. An
intense storm northwest of the Hawaiian Islands triggered the super
swell, which has been rapidly building throughout the day and should
hold well into the evening. The National Weather Service says around 9
a.m. Buoy 101, which measures open ocean swells northwest of the
Hawaiian Islands, reported an ocean swell of 31 feet at 17 seconds. That
translates to 50+ feet on the north shore around 7 p.m. tonight. North
shore beaches are seeing 35 to 50 foot faces, west shores 20 to 30 feet
and west shores of the Big Island 12 to 18 feet..."
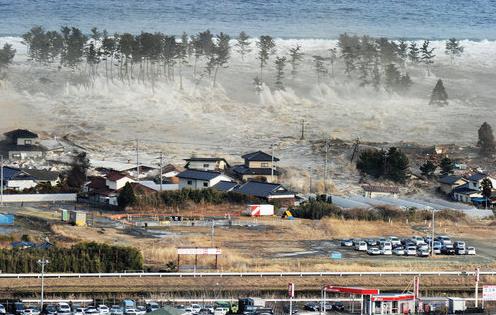
A Home Designed To Stand Up To A Tsunami. I found this story from
Gizmodo intriguing; here's an excerpt: "
Little
can actually be guaranteed to survive the high-velocity wave walls and
pummeling winds of a tsunami—but this house will at least put up a damn
good showing. Designed by Dan Nelson of Designs Northwest Architects, this building has become known as the Tsunami House.
It's structure has been carefully created to withstand 7.8 scale
earthquakes and 85 mph lateral winds, as well as the flooding that comes
with the territory. That was achieved by positioning the two vital
living floors nine feet above the ground, so the main part of the house
stands on massive support columns, reinforced by steel framing..."
Greek Scientists Propose New Tsunami Intensity Scale. Keeping with today's theme, here's a clip from a story at
Greek Reporter that caught my eye: "...
Researchers explained that they had the idea of creating a 12-grade scale when they were studying the Japanese tsunami.
“We classified the criteria into groups so that we can assess the
tsunami. The first category has to do with its physical characteristics
such as the wave’s height and its distance from the beach. The second
concerns tsunami impact on humans, the third is the impact on the
environment and the fourth is the impact on coastal infrastructure
(ports). The fifth category is the impact on mobile objects (boats,
cars) and the sixth is the impact on structures (houses, stores),”
researchers stated...."
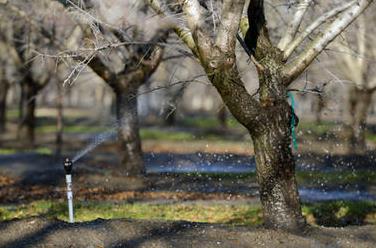
Historic California Drought Called A Red Flag For Future Of U.S.
The Christian Science Monitor has the article and video - here's a clip: "...
Water
shortages have widespread impacts. Agriculture and energy generation
account for 80 percent of the nation’s clean water use, says David
Dzombak, head of Carnegie Mellon University’s
Civil and Environmental Engineering Department. And even when cities
meet their water demands during a drought, the costs can leave them
“exposed to significant risk of financial failures,” says Patrick Reed, a
professor of civil and environmental engineering at Cornell University, in an e-mail..."
Photo credit above: "A
sprinkler waters an orchard along Highway 32 west of Hamilton City,
Calif., after Gov. Jerry Brown formally proclaimed California in drought
emergency Friday." Jason Halley/Chico Enterprise-Record/AP.
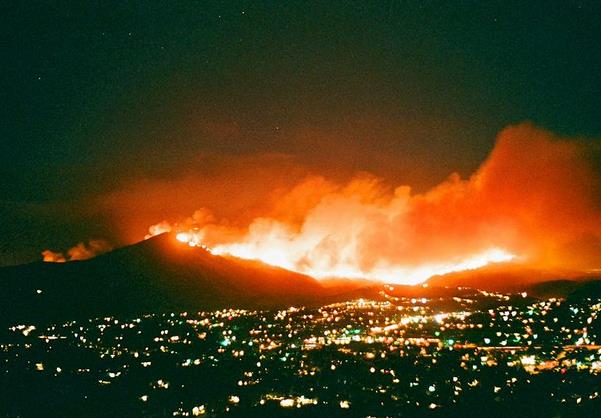
Wildfires: San Diego's Ecological Elephant In The Room. This story caught my eye, at
The San Diego Free Press. I hadn't realized how close San Diego came to a potentially devastating conflagration in 2007. Here's an excerpt: "...
But
I’m not sure most San Diegans realize the extent to which we dodged a
bullet in 2007. If the wind direction at a key moment in that firestorm
had not suddenly switched from the westerly course it was locked on, to
a southerly path (and then later to its more normal easterly flow), San
Diego might today be the west coast icon for “greatest urban disasters
in U.S. history.” A huge swath of our urban region could have burned to
the ground. Hundreds of thousands of buildings might have been
destroyed, and tens of thousands left homeless. Untold numbers might
have lost their lives. We’ve forgotten those details from October 2007:
two raging mega-fires, poised like pincers heading from two directions
toward the very heart of our city..." (Image: Wikipedia).
In
this Nov. 14, 2013 file photo, Typhoon Haiyan survivors walk through
ruins in the village of Maraboth, in the Philippines. Last year was tied
for the fourth warmest year on record around the world. The National
Oceanic and Atmospheric Administration on Tuesday released its global
temperature figures for 2013. The average world temperature was 58.12
degrees (14.52 Celsius) tying with 2003 for the fourth warmest since
1880.(AP Photo/David Guttenfelder)
Read more at:
http://phys.org/news/2014-01-noaa-world-4th-hottest.html#jCp
The
average world temperature was 58.12 degrees (14.52 Celsius) tying with
2003 for the fourth warmest since 1880, the National Oceanic and
Atmospheric Administration said Tuesday.
At the same time, NASA,
which calculates records in a different manner, ranked last year as the
seventh warmest on record, with an average temperature of 58.3 degrees
(14.6 Celsius). The difference is related to how the two agencies
calculate temperatures in the Arctic and other remote places and is
based on differences that are in the hundredths of a degree, scientists
said.
Read more at:
http://phys.org/news/2014-01-noaa-world-4th-hottest.html#jCp.
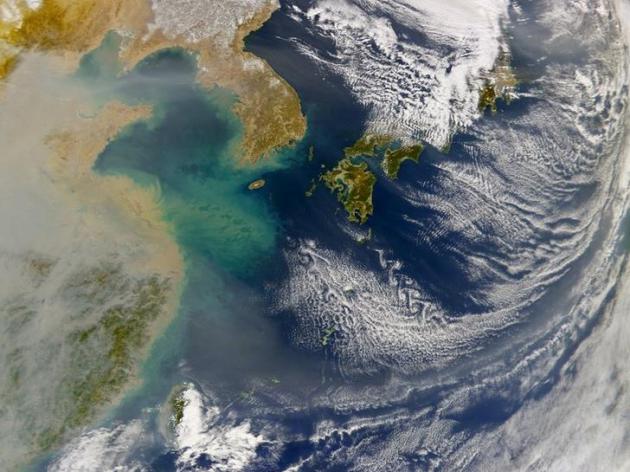
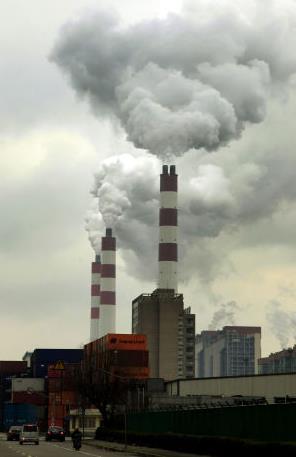
Turns out all the money we pay to China to produce cheap (crap) is
coming back to bite us, in the form of smog, which doesn't seem to want
to respect international borders.
Smithsonian.com has the report - here's a clip: "...
The
dynamics of cloud formation are quite complex, but the study's
conclusions were surprisingly straightforward. This air pollution, the
model showed, has powerful consequences for cyclone formation,
increasing overall precipitation over the Northwest Pacific by 7 percent
over what it would be otherwise. The particulate matter, the
researchers found, is also producing a regional greenhouse gas effect,
siginificantly contributing to climate change. These findings are,
naturally, pretty worrisome. But for U.S. readers, the results of the
study on the global spread of Chinese air pollution, published yesterday in the Proceedings of the National Academy of Sciences,
might be even more troubling, both because they show the effects of
Chinese pollution here in the U.S. and because they trace much of the
responsibility back to American consumers, who buy a large proportion of
the goods manufactured in China..."
Image credit above: "
Clouds of haze rise above China, largely the result of the country's massive manufacturing industry."
(Image via US NASA SeaWiFT project).
Researchers Find Connection Between Asia Pollution, Changes In Weather. The Eagle, serving Bryan- College Station, Texas, has the story - here's the introduction: "A
team of researchers has been using a supercomputer at Texas A&M
University for the past two years to find out if Asia's unchecked
pollution problems are affecting your weekend weather forecast.
While the details remain hazy, initial findings published this month in
Nature Communications show that three decades of industrial exhaust
billowing into the atmosphere is changing the way clouds and storms form
over the northwest Pacific Ocean. "Asian pollution affects cloud
formations, precipitation, and storm intensity over the north Pacific
and eventually impacts regional and global climate," Caltech
post-doctoral scholar Yuan Wang wrote in an email..."
Photo credit above: "In
this March 3, 2009 file photo, factory chimneys pour out smoke in
Shanghai, China. Despite a global economic slump, worldwide carbon
dioxide pollution jumped 2 percent last year, most of it from China, new
figures show." AP Photo.
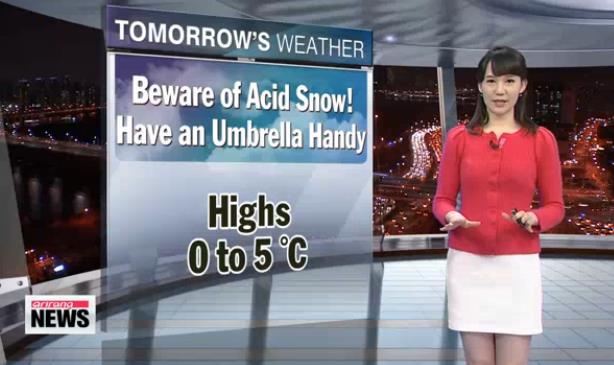
Feeling Better About Our Snow.
Bring your steel and concrete-reinforced umbrella! Skiers heading out
in South Korea should be on the look-out for "acid snow", the result of
otherwordly amounts of pollution/smog swirling in from China. No, sadly
this is not a parody clip from The Onion. Here's a video clip and
excerpt from
Arirang News: "
Let's
go over to our Kim Bo-gyung at the weather center for a checkup.
Bo-gyung, it has been a dark day here in Seoul, with snow falling from
time to time. That's right, Ji-hae. Please be sure to have an umbrella
with you, as the snow that's falling in the central regions right now is
acid snow, which is a mixture of snow and yellow dust..."
What Jobs Will The Robots Take?
Will some of us soon be outsourced/replaced by robots imbued with a
capability of "thinking", even reasoning? I don't pretend to know, but
this story at
The Atlantic
caught my eye; here's an excerpt: "...Whatever name you prefer, some
form of it has been stoking progress and killing jobs—from seamstresses
to paralegals—for centuries. But this time is different: Nearly
half of American jobs today could be automated in "a decade or two," according to a
new paper by Carl Benedikt Frey and Michael A. Osborne, discussed recently in
The Economist.
The question is: Which half? Another way of posing the same question
is: Where do machines work better than people?..." (Photo: Reuters).
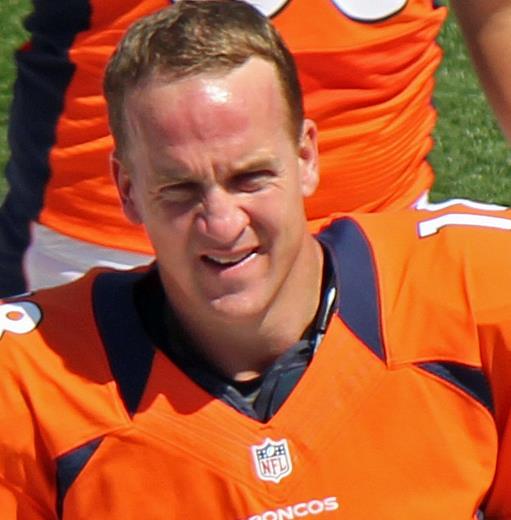
Peyton Manning's "Omaha" Audibles Become Super Bowl Prop Bet. Did the Omaha Chamber of Commerce put Peyton up to this? Inquiring minds want to know. Here's a clip from
Bloomberg: "...
Online sportsbook Bovada.lv is taking wagers on the number of times the Denver Broncos’ quarterback yells “Omaha” as one of his pre-snap calls during the National Football League’s Feb. 2 championship game against the Seattle Seahawks. The over/under is 27 1/2 and is among a series of more than 400 proposition bets, or props, released today by Bovada..." (Image: Wikipedia).
Cheerleaders File Suit Against Raiders. And it had nothing to do with their wins and losses. Here's a clip from a curious story at
ESPN: "
The Oakland Raiders
are being sued by current and former cheerleaders claiming wage theft
and other unfair employment practices. The lawsuit filed Wednesday in
Alameda County Superior Court alleges that the organization withholds
all pay from the Raiderettes until the end of the season, does not pay
for all hours worked and forces the cheerleaders to pay many of their
own business expenses. "It's as if the Raiders' owners believe that the
laws that protect all workers in California just don't apply to them,"
attorney Sharon Vinick said, according to the San Jose Mercury News..."
Perfect. Thanks to
KDWB for sharing this via Faceplant. I had no idea the new Mustangs were so small...
TODAY: Light snow likely, inch or two. Winds: W 10-20. High: 33 (above!)
FRIDAY NIGHT: Light snow tapers to flurries, turning colder with slick roads. Low: 6
SATURDAY: Clouds increase, 1-2" snow late. High: 10 (rising Saturday night)
SUNDAY: Blustery, turning colder. Wake-up: low 20s. High: 22 (falling into single digits by late afternoon)
MONDAY: Nanook with sunshine. Frostbite threat. Feels like -40F. Wake-up: -18. High: -5
TUESDAY: Blue sky - character-building cold. Less wind. Wake-up: -20. High: near 0
WEDNESDAY: Breezy, temperatures recover. Wake-up: -7. High: 17
THURSDAY: Another clipper, then colder. Wake-up: 8. High: 10 (falling during the day)
Climate Stories...
First Annual Citizens Climate Lobby Regional Conference.
This is coming up this evening at MacAlester College in St. Paul, with a
focus on creative ways to put a price on carbon. If you want to get
involved
click here for more details - we hope to see you there. Details:
Friday Jan 24 Weyerhaeuser Chapel- 7-9 pm
Paul Douglas- "Climate Change Impacts in Minnesota"
Hip Hop Artist Forefeather presentation
Mark Reynolds- CCL Director- "Betting the Farm on Relationships"
Saturday Jan 25-Olin-Rice Science Center
9 am: Welcome
9:30 am: Climate Change Impacts on Minnesota
Agriculture- Tara Ritter- IATP (Institute on Agriculture and Trade Policy)
Ecology and Recreation- Lee Frelich- Forestry Dept U of MN
Health and Urban Living- Kristin Raab- MN Dept of Health
Followed
by strategy sessions, planning, group start for new people from noon to
6 pm, then a skating party and other "fun stuff".
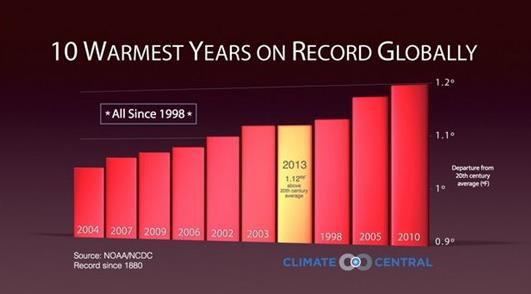
What Does 2013 Being The 4th Hottest Year On Record Tell Us About Climate Change? Perspective would be nice, and
The Carbon Brief provides it - here's a clip: "...
The
question of what a single year's temperature can tell us about climate
change pops up each year when the official figures are released. This
time last year, we asked Dr Gavin Schmidt,
climate scientist at NASA GISS, for his thoughts on 2012 being ranked
the ninth warmest on record. Schmidt told us: "That 2012 is fifth,
ninth, or twenty-seventh is not really the point. Instead, it is the
fact that the long term trends and the decade-on-decade differences are
all up (as has been predicted for decades)." And the same goes for this
year. Rather than whether one year was hotter than the last, scientists
look at changes over several decades to see how the climate is changing..."
Graphic credit above: "
2013
was the 4th warmest year on record since 1880, according to official
NOAA data released on Tuesday." Source: Climate Central.
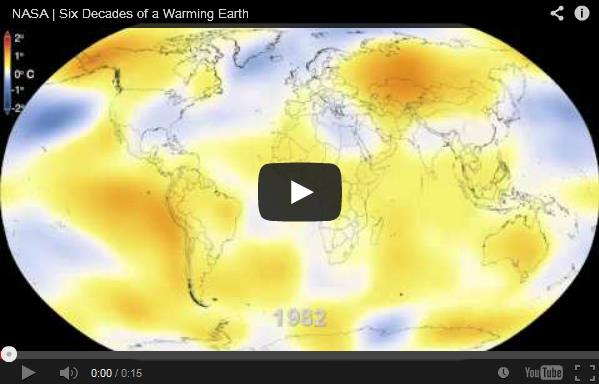
Watch 6 Decades Of Global Warming In 15 Seconds.
Because we're all in a hurry, right? NOAA says 2013 was the 4th
warmest, using slightly different techniques NASA says 7th warmest.
Here's a video and excerpt from
The Los Angeles Times: "...
To
demonstrate the temperature uptick, NASA released a time-lapse
visualization that shows the Earth warming from 1950 through 2013. More
than 60 years are covered in 15 seconds, as a mostly blue representation
of the planet turns to a mostly orange one. Watch it above..."
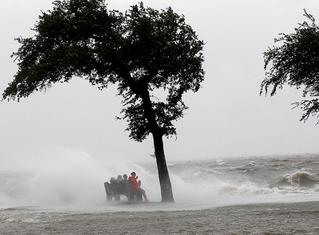
Study: Higher Tides From Climate Change Likely To Make Hurricane Flooding Worse. The risk has nearly doubled since 1990, according to recent research highlighted in this story at
The Tampa Bay Times; here's an excerpt: "
High
tides have been getting higher and low tides lower at cities around the
Gulf of Mexico, according to a new study produced in part by scientists
at the University of South Florida. Those extreme swings, caused at
least in part by global climate change, have increased since the 1990s,
the study found. The trend for sea level rise spells very bad news for
anyone living along the coast if a hurricane hits during one of those
higher high tides..."
Photo credit above: Associated Press (2012). "People
sit on a bench along the seawall in the storm surge from Isaac, on
Lakeshore Drive along Lake Pontchartrain, as the storm approaches
landfall in New Orleans. A new study says higher high tides could result
in more flooding in a hurricane."
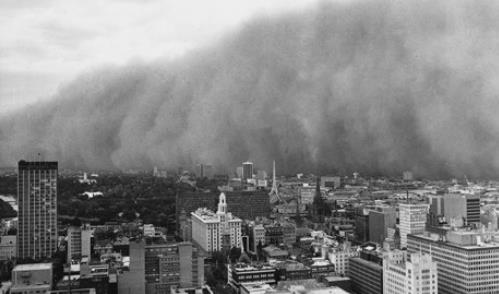
What Will Happen To Global Warming When We Get A Big El Nino? Scientists
believe that warming (at least atmospheric warming) has been dampened
in recent years, by among other factors, a perpectual La Nina cooling
phase of the Pacific. What happens when some of that deep-water ocean
warming comes to the surface? Here's a clip from
The Guardian: "
I'd
like to declare a new season. The back end of January is now the
traditional time when we find out that the year we just had was one of
the hottest on record. I've no idea what we'd call this season, but it's
upon us once again and it's becoming repetitive. It's been going on for
a decade or more. It's like Groundhog Day, but without the jokes and cuddly marmots. The National Oceanic and Atmospheric Administration's National Climate Data Center says 2013 was the fourth warmest year on a record going back to 1890..."
Photo credit above: "
A
massive reddish-brown cloud advances on Melbourne, Australia, on 8
February 1983. The dust storm was a consequence of devastating droughts
induced by the extreme El Niño of 1982-83. The frequency of extreme El
Niño events is predicted to double in the future as the Earth's climate
warms." Photograph: Trevor Farrar/Australia Bureau of Meteorology.
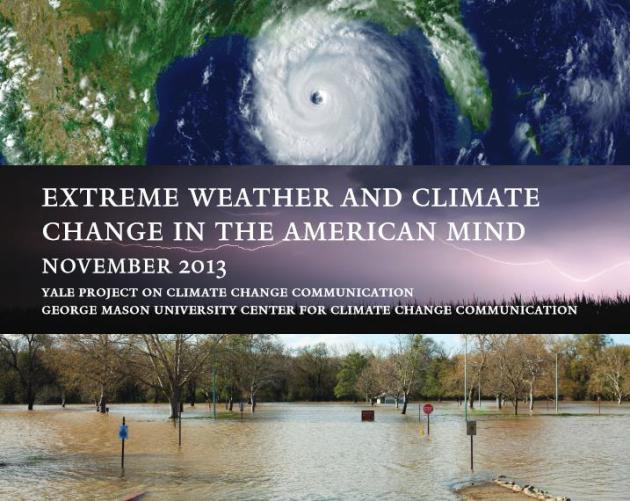
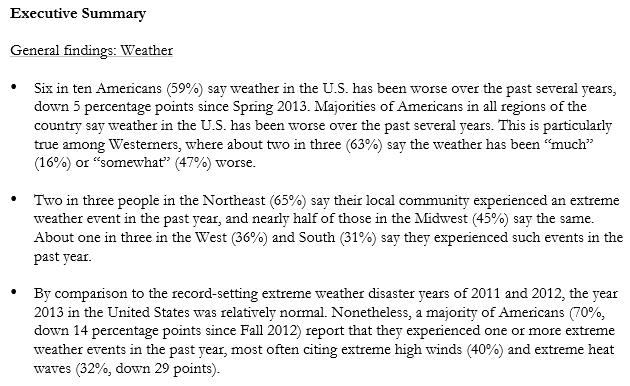
Extreme Weather And Cliate Change In The American Mind. Here is an excerpt of the latest research to come out of the
Yale Project on Climate Change Communication (PDF):
A Question Of Faith. I found this article worth my time; here's a clip from
The Spectator: "...
If
people are committed to an unscientific position, no evidence or
argument will shake them out of it. Whether they subscribe to AIDS
denial, excessive fear of radiation, vaccine scaremongering, homeopathy
or creationism, they tend to demand impossible standards of proof from
their opponents but to accept any old rubbish that supports their
beliefs. So if you are among those who reject the vast weight of
scientific evidence for manmade climate change, I don’t expect this
article to persuade you. Ask yourself what it would take to change your
mind. If tens of thousands of peer-reviewed papers, against a tiny
handful supporting your position; basic physics, demonstrable in a lab;
instrumental temperature records spanning 150 years and much else on
these lines can’t sway you, what could?..."
 A Day To Celebrate Abundant Life.
 Here's an excerpt of an Op-Ed at
The York Daily Record
from Rev. Mitchell C. Hescox, President and CEO of EEN, The Evangelical
Environmental Network. Full disclosure: I'm on the board of EEN, but
his words resonated with me: "...
It’s
time to work together in love, respecting our differences, and find the
common ground to defend our children and rekindle the grace given our
nation. Nowhere is this more apparent than the national shouting match
regarding our changing climate. Climate is changing. One doesn’t
have to be a scientist to recognize the signs. Look around at the
increasing wacky weather, sea level rise, plants blooming earlier, and
insect born diseases spreading into areas they never were. Climate
change threatens human well being, period. Hundreds of thousands die
each year from climate change threats and the future for our children
and all God’s children looks bleak. Poverty, forced migration,
increased disease are already bad problems that will get worse. From
2012’s Super Storm Sandy, 2013’s Colorado floods and wildfires, and even
January’s Arctic vortex weather derive in part from climate change.
They are just the beginnings of what our future world will be unless we
act..."
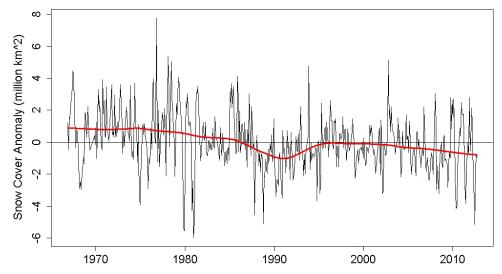
Snow Trends In The Northern Hemisphere.
With the Son of Snowpocalypse story in the news, SNOW! blanketing many
large northeastern cities, I thought this was a timely jolt of
perspective. Although we're seeing more intense snowfalls from time to
time (a function of more water vapor in the air?) the overall trend for
snowcover on the ground is downward over the entire Northern Hemisphere,
looking at
year-round data, mainly because of the rapid warming of the Arctic is melting more snow during the summer months: Here's a clip from
Tamino: "...
The Rutgers Univ. Global Snow Lab
has data on snow cover during the satellite era. Like most
climate-related variables, snow cover shows a strong seasonal cycle,
with more snow in winter and less in summer. When looking for trends,
it’s useful to compute anomaly, the difference between a given month’s
value and the average for the same month throughout the data record.
Here’s the anomaly data for northern hemisphere snow cover. There is a
clear, and statistically significant, overall decline in snow cover. In
spite of what we often hear from the fake skeptics — who love to bellow
about any big snowfall (even when it hasn’t happened yet) as though it were disproof of global warming — the actual trend in snow cover is one of decline..."
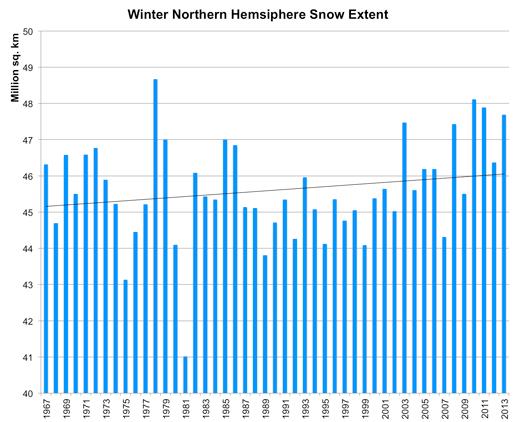
Winter Snowfall Trends For North America.
With a few notable (polar) exceptions, winters are trending milder,
meaning more water vapor to support snowfall. Rutger's Global Snow Lab
shows an increase in snowfall amounts for North America during the
winter months since 1967.
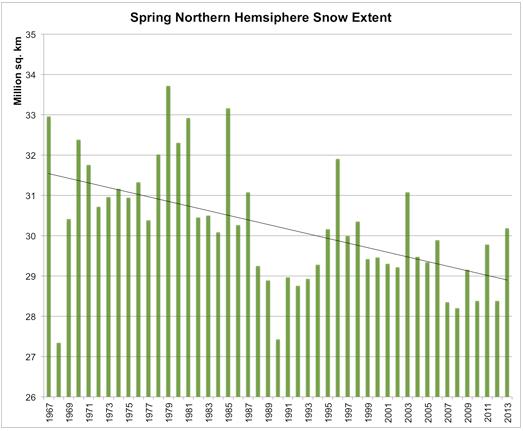
Decreasing Spring Snowfall Amounts.
Although winters are becoming snowier with time across North America,
snow is melting faster during the spring months, based on data from the
Rutgers Global Snow Lab.
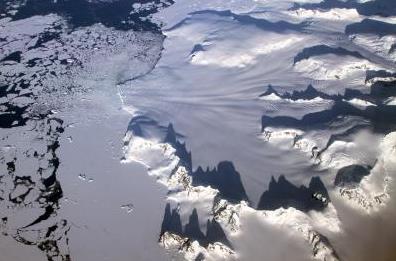
A Resolution Of The Antarctic Sea Ice Paradox. Arctic ice is shrinking during the summer, what what's happening in Antarctica? Here's an excerpt from an article at
reportingclimatescience.com: "
The
gradual warming of the North and tropical Atlantic Ocean is
contributing to climate change in Antarctica, a team of New York
University scientists has concluded. The findings, which rely on more
than three decades of atmospheric data and appear in the journal Nature,
show new ways in which distant regional conditions are contributing to
Antarctic climate change. "Our findings reveal a previously unknown—and
surprising—force behind climate change that is occurring deep in our
southern hemisphere: the Atlantic Ocean," says Xichen Li, a doctoral
student in NYU's Courant Institute of Mathematical Sciences and the
study's lead author. "Moreover, the study offers further confirmation
that warming in one region can have far-reaching effects in another..."
Photo credit above: "
The
gradual warming of the North and Tropical Atlantic Ocean is
contributing to climate change in Antarctica, a team of NYU scientists
has concluded. The findings, which rely on more than three decades of
atmospheric data, show new ways in which distant regional conditions are
contributing to Antarctic climate change. Below, several glaciers in
the Antarctic Peninsula pass between sharp mountain peaks and converge
in a single calving front, as seen by Operation IceBridge while
returning from a survey of the Ronne Ice Shelf on Nov. 1, 2012. NASA's
Operation IceBridge is an airborne science mission to study Earth's
polar ice. For more information about IceBridge, visit:
www.nasa.gov/icebridge." Courtesy: Jefferson Beck/NASA IceBridge, National Science Foundation.


No comments:
Post a Comment