16 F. high in the cities Friday.
31 F. average high on February 21.
23 F. high on February 21, 2013.
9.9" fell at MSP International Thursday night into early Friday.
57" snow so far this winter in the Twin Cities. Average, to date, is 39.5".
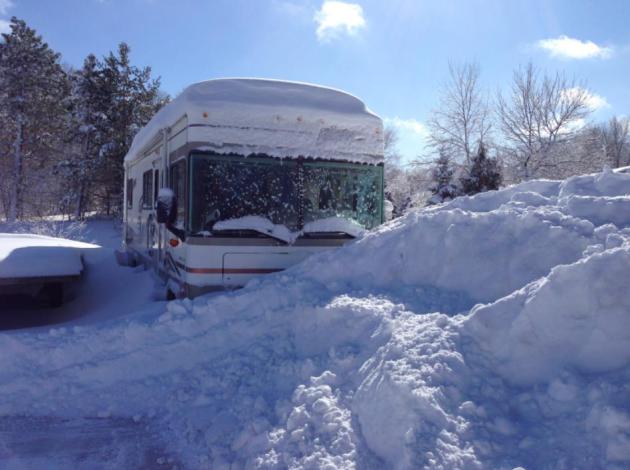
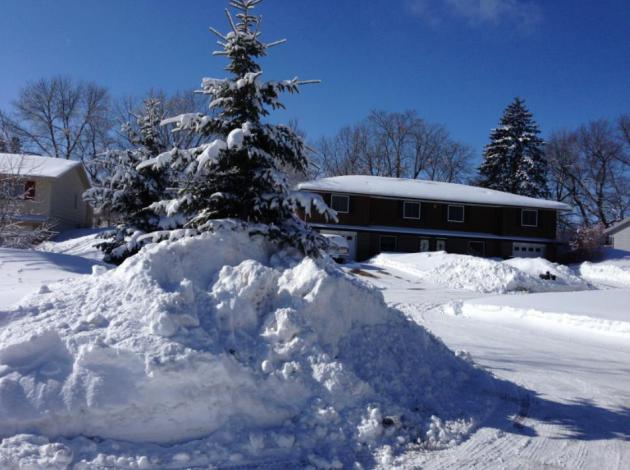
24" snow on the ground (!)
24" snow on the ground in the Twin Cities. That's the most snow since late January, 1982. Pete Boulay at the Minnesota Climatology Working Group writes: "
24
inches or more has only happened in 8 other years in the Twin Cities,
the last time was on January 26, 1982. The record is 38 inches on
January 23, 1982... One of the few records the Halloween storm did not
break, the deepest snow for the Halloween Blizzard is 23."
On Strike
Remember
the movie "Network"? Well I'm having a Howard Beale Moment. "I'm madder
than (heck?) and I'm not going to take it any more!"
I can't work
under such intolerable conditions. Now I'm a reluctant
weather-therapist, trying to help friends, family (and readers) cope
with the coldest winter in 35 years. But to no avail. So I'm going on
strike and encouraging all Minnesota meteorologists to follow my lead.
Don't show up for work. Maybe a few minutes of dead air will encourage Canada to stop shelling us with subzero artillery.
Enough is enough.
Step away from the Doppler, Paul.
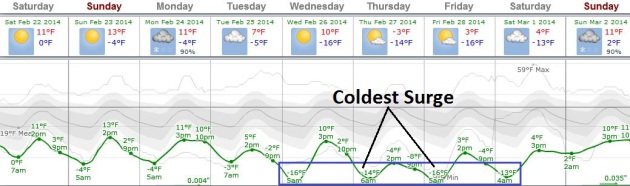
The
good news? The glacier in your yard won't grow appreciably into next
week - waves of numbing air pushing the storm track well south of
Minnesota. The bad news (unless you're into aerobic shivering) is 7 more
subzero nights next week, on top of the 45 we've already enjoyed. Hey,
if we reach 53 subzero nights it'll be the most since 1978, the 5th most
on record.
While we stare out our windows at
serious-thermometer-shrinkage the rest of the northern hemisphere is
shrugging through a lukewarm winter. According to NOAA January was the
4th warmest, worldwide, on record.
Yes, this too shall pass.
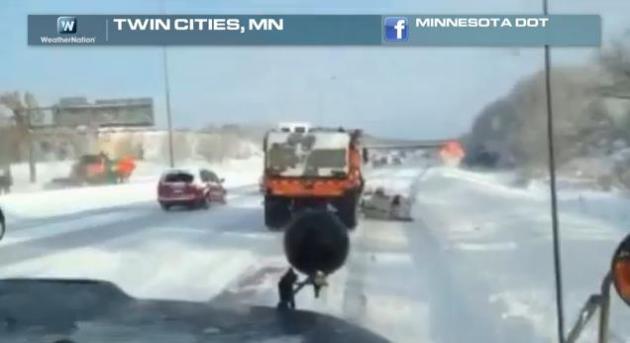
Worst Roads In 30+ Years?
The first tip-off was the e-mail headline advising no travel from the
State Patrol. The second tip-off was the worst commute of my life
yesterday, driving (or trying to drive) from Excelsior to downtown St.
Paul - all on side streets. It was like a Mensa-Level Driver's License
Final Exam that someone vaguely psychotic thought up, obstacles jumping
out at you from every angle. I got here in 1983, and I can't remember
roads this bad in 31 years. A rapid drop in temperature Thursday night
coincided with the heaviest snow, the "flash-freeze" turning slush near
pavement-level into black ice, compaction from car tires above
accelerating the icing process. And when it gets this cold the sand and
chemicals take much longer to work, if they work at all. Here's a link
to the latest
Climate Matters, with some of the craziest weather extremes with this last storm: "
WeatherNation
Chief Meteorologist Paul Douglas talks about the recent severe weather,
noting the rarity of tornadoes passing over snowy ground in Illinois.
Weather whiplash continues as Blizzard Warnings shared borders with
Severe Thunderstorm Warnings in Iowa and the entire storm system
drenched the eastern U.S. with heavy rain. Will we have a calmer week
ahead?"
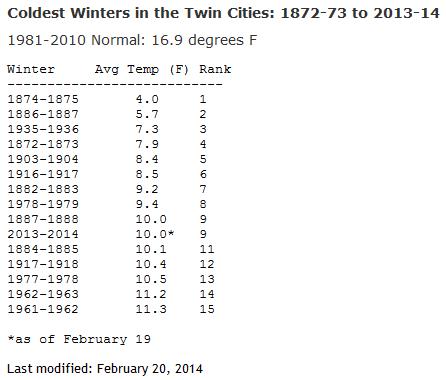
Coldest Winters On Record In The Twin Cities.
To date we are tied for 9th coldest, the chilliest since 1978-79. Next
week's cold wave could push us into the 7th or 8th spot - too early to
know, but the Polar Vortex isn't quite done with us yet. Here's an
excerpt from
The Minnesota DNR: "
The
winter of 2013-14 has been the coldest in years. So far the average
temperature of Meteorological Winter (December-February 19) is 10.0
degrees. If cold weather returns for the rest of February, the winter of
2013-14 would finish in the top ten coldest winters on record."
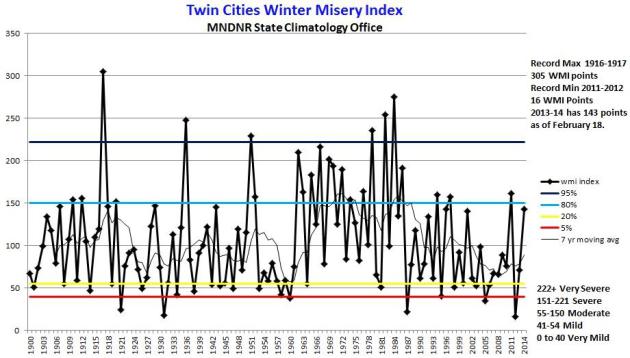
The Twin Cities "Winter Misery Index" Reaches 168 (Severe).
Snow and cold lovers will be offended; others will nod their head in
agreement. Pete Boulay at the MN State Climate Office confirms that this
last 10" snowfall tipped us over into a "Severe Winter", as measured by
the WMI; here's an explanation from
The Minnesota DNR: "
The
Winter Misery Index (WMI) is an attempt to weigh the relative severity
of winters. The index assigns points for daily counts of maximum
temperatures 10 degrees or colder and daily minimums of 0 or colder. If
the minimum temperature is -20 or colder greater weight is assigned to
the value times 8. For snowfall, one inch is assigned a point per
calendar day. A four inch snowfall is times 4, and an 8 inch snowfall is
times 8. The duration of a winter is noted by the number of days the
snow depth is 12 inches or greater. All current measurements are at the
Twin Cities International Airport.
So far as of February
21, 2014 the WMI for the winter of 2013-14 in Twin Cities is 168
points, or in the "severe winter" category. Of course there is quite a
bit of winter left. The lowest WMI score was the winter of 2011-2012
with 16 points. The most severe winter is 1916-1917 with 305 WMI points.
How many WMI points will this winter score? stay tuned!
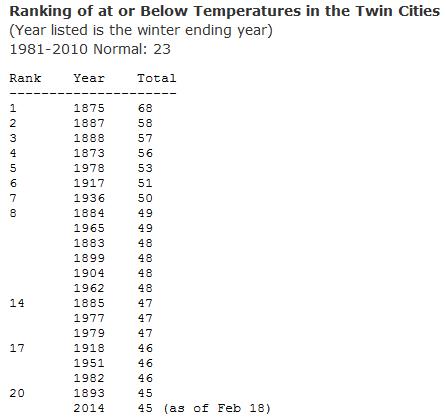
How Many Subzero Nights This Winter?
We've already enjoyed/endured 45 nights of negative numbers - I see at
least another 5-8 over the next 10 days. That could bring our total
close to 53, which is what MSP experienced back in 1978 (the 5th most on
record). More chilling details from the
Minnesota DNR: "
As
of February 18, there have been 45 minimum temperatures of zero or
colder: 13 in December, 20 in January and 12 so far in February. This is
the most number of minimums at or below zero in a winter since the
winter of 1981-82 when the total was 46. The highest number of at or
below zero temperatures in an entire winter is 68 for the winter
of 1874-75. The last time there were over 50 minimums of zero or colder
was the winter of 1977-78 with 53..."
Holding Pattern Keeps....Holding.
Well, give nature some credit for continuity. The pattern has been
pretty persistent since early December, and polar air will continue to
push south of the Canadian border into late next week. Not as frigid as
January or early February, but expect 7 more subzero nights next week,
on top of the 45 nights of negative fun we've already enjoyed! The core
of the next cold wave arrives by the middle of next week; morning bus
stop temperatures Wednesday and Thursday may dip to -20 or -25F. Graph:
Weatherspark.
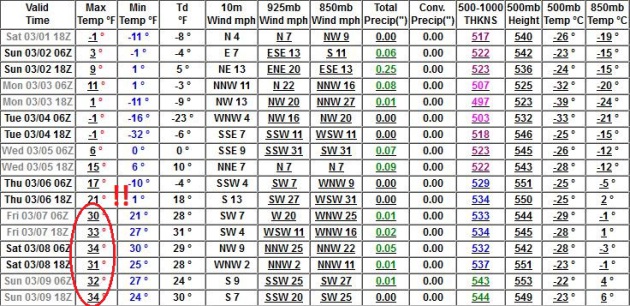
Circle Me Bert!
Don't stop circling until 70s show up in that left column ok? Expect a
cold first week of March, but the GFS is fairly consistent from run to
run, showing 30s returning the second week of March. Kind of sad that so
many of us are grateful to see 30s. A measure of how far we've fallen.
Coping With A Long Winter. I was especially grateful for Dr. Mark Seeley's words of wisdom in this week's installment of
Minnesota WeatherTalk; here's an excerpt that caught my eye: "...
As
we face the final stages of this long hard winter in Minnesota, I was
inspired to see these words from the writer Victor Hugo:
"laughter is the sun that drives winter from the human face."
This
is a winter that we can be thankful for laughter. I know that I saw
many more smiles when the temperature finally touched 40 degrees F two
days in a row this week in the Twin Cities. At least that gave us a bit
of a respite...."
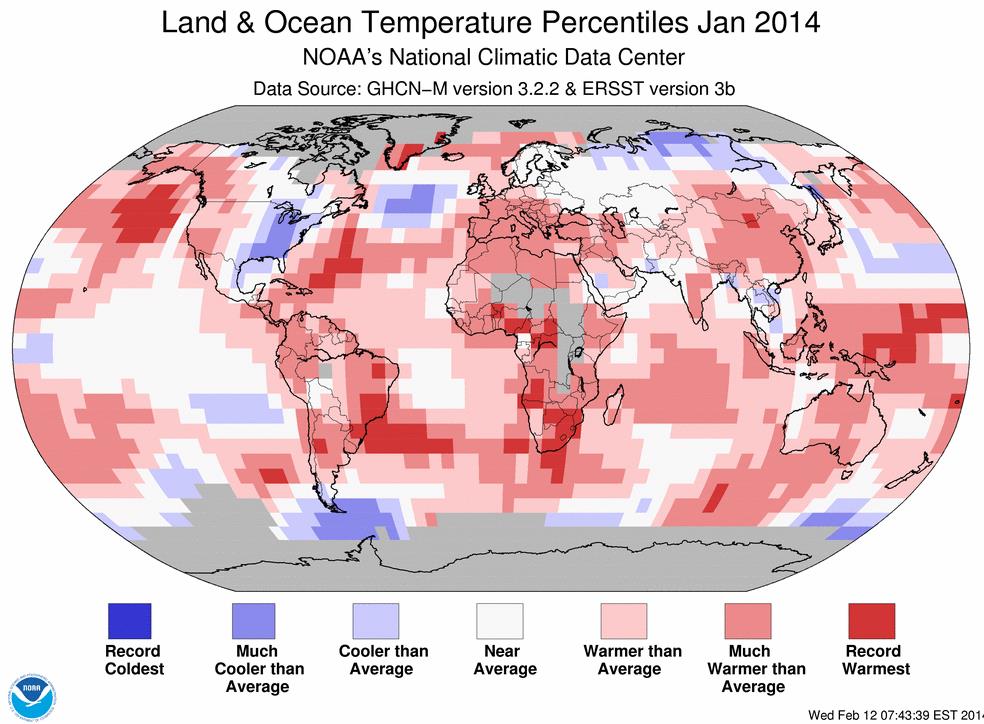
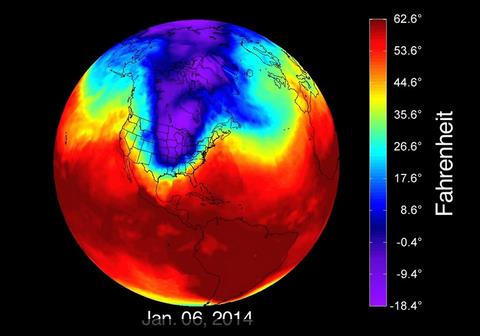
What Cold? Earth Had It's Fourth-Warmest January.
No, weather is not climate. The trouble is: we are all hard-wired to
react to weather, not the longer, slower (global) climate trends that
have so many scientists concerned. Here's an excerpt from
Mashable: "...
The
last January with below average global temperatures occurred in 1976,
the bicentennial of the U.S., and the year that the first “Rocky”
movie hit theaters. The last below average global temperature for any
month was February 1985. According to NOAA, the combined average
temperature over global land and ocean surfaces for January was 54.8
degrees Fahrenheit, which was 1.17 degrees Fahrenheit above the 20th
century average. Using different analysis methods, NASA also concluded
that Alaska had its third-warmest January, and central and southern
Africa were record warm for the month as well. China had its
second-warmest January on record, and France tied with 1988 and 1936 for
its warmest January..."
Image credit above: "
The jet stream buckled in January, allowing extremely cold air (in blue) to enter the U.S." Image: NASA Goddard Space Flight Center.
$40 Billion: Drought Could Be One Of The Most Expensive Disasters In History.
Will the rains come in time to help California? The odds are dropping
with each passing day; the wet season winds down in March. It would take
a (remarkable) amount of rain to replenish dusty topsoil and restore
significant water to reservoirs. Here's an excerpt from
CBS Sacramento: "
California’s
drought is so severe, experts say it could have a $40 billion impact on
the state’s economy, and they say it could end up being one of the top
10 natural disasters our country has ever seen. Amarel says it’s already
forcing farmers to downsize, and it could wipe out some altogether,
especially when food prices start going up next year. The ripple effect
could cripple the state’s economy, and farmers who remember the drought
of 1976 are still bracing for the worst..."
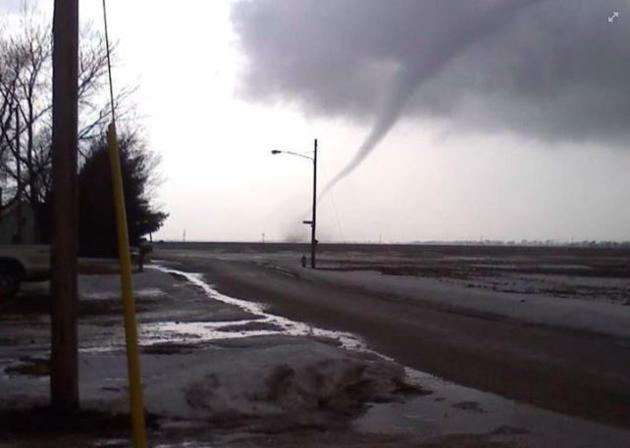
An Improbable Sight.
I've been doing this for 40 years, and I can't remember ever seeing
something like this. I've read reports of isolated tornadoes over the
Rockies, briefly passing over snowfields, a very rare meteorological
event. But Thursday this (roping) tornado was photographed about 5 miles
away from the photographer. Check out the piles of melting slush in the
foreground; looks like half a foot (?) of dirty snow in that one clump.
This takes weather whiplash to a new (and ridiculously jaw-dropping)
level. Photo courtesy of Dana Cottingham Fricke, from Concord, Illinois.
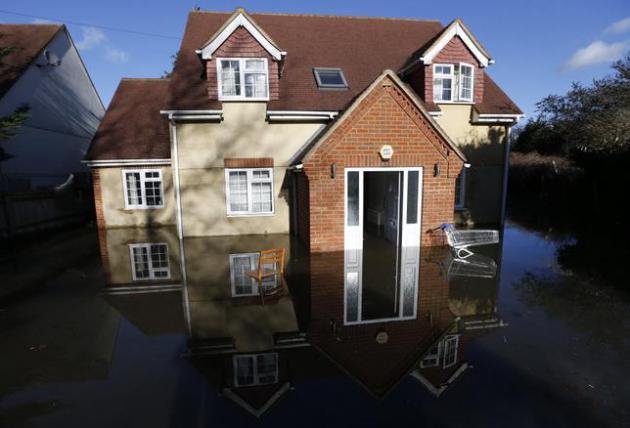
British Floods - California Drought: A Connection? National Geographic
explores the still-controversial theory that rapid warming and ice melt
in far northern latitudes may be impacting the configuration of the jet
stream; here's an excerpt: "...
There is wide scientific consensus
that global warming promotes weather extremes in those ways, even if the
jury is still out on Francis's hypothesis of an Arctic connection. "We
used to say you can't attribute any single event to climate change,"
says Thomas Peterson of NOAA's National Climatic Data Center.
Now, he says, scientists emphasize how climate change is tilting the
odds toward extreme events, the way steroids pump up a baseball player:
"You know he's hitting 20 percent more home runs, but you don't know if a
specific home run is a result of the steroids."
Photo credit above: "A
flooded house in Egham, England, Thursday, Feb. 13, 2014. The River
Thames has burst its banks after reaching its highest level in years,
flooding riverside towns upstream of London, with Egham being about 20
miles (32 Km) east of central London." (AP Photo/Sang Tan)
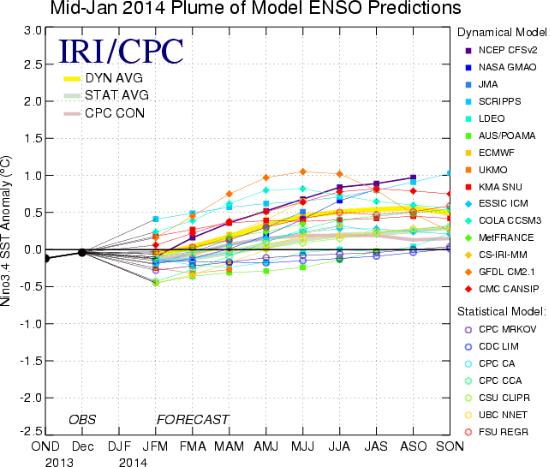
Pacific Nino 3.4 SST Outlook.
Over the last few years we've been transitioning from a La Nina cooling
phase of the Pacific to an ENSO-neutral phase, which should continue
into spring. But models are increasingly hinting at an El Nino event
possibly returning by the end of 2014. It's still too early to say, but
if you'd like to dig into a little
light reading (29 page PDF from NOAA NCEP Climate Prediction Center) give it a shot.
U.S. vs. China: Is This The New Cold War? Financial Times Magazine has a very interesting read
here.
Google's Project Tango: A Smart Phone That Sees Your Surroundings. Because my phone isn't already spying on me enough - here's a clip from
Gizmag that made me do a triple-take: "
Smartphones
are, well, smart, but they aren't very interested in their
surroundings. This may seem trivial, but when it comes to working with
people in what we like to call the “real” world, a mobile device that
doesn't understand much outside of its camera view has only limited
usefulness. With these limitations in mind, Google’s Project Tango is
working on a smartphone that can map its environment in 3D in real time
to provide user and device with some common ground..."
Sailing The Seas In A Luxury Submarine.
Hey, it's only 175,000 British pounds/night, about $250,000 U.S. A
bargain, I'd say, for the very well-off 1% who have more money than
sense. The Telegraph has a few details: "
Could it be that luxury
travellers are tiring of the reliably lavish but occasionally homogenous
experiences provided by the world’s best grande dame hotels? Offering
truly distinct experiences, an increasing number of entirely unique hotel rooms have opened in recent years. Now, following the unveiling of an underwater hotel room in Zanzibar,
the holiday home-rental company Oliver’s Travels is offering its
customers the chance to spend the night in a specially adapted leisure
submarine..."
TODAY: Chilled sunlight. Winds: W 10-15. High: 15
SATURDAY NIGHT: Clear and cold. Low: 0
SUNDAY: Blue sky, only partially numb. High: 14
MONDAY: Flurries & light snow. Coating - 1" Wake-up: -3. High: 12
TUESDAY: Some sun, turning colder again. Wake-up: -7. High: 5
WEDNESDAY: Cash in frequent flier miles. Patchy clouds, reinforcing clipper. Wake-up: -9. High: 10
THURSDAY: Sunny, unreasonably cold. Wake-up: -11. High: 2
FRIDAY: Cold, but still storm-free. Wake-up: -14. High: 6
* Models are hinting at a possible thaw again the second week of March.
Climate Stories....
 Play It Again: January Continues Globe's Warm Trend
.
You'd never know it staring at the thermometer in your back yard, but
the planet continues to run a low-grade fever. Here's a clip from
Climate Central: "
Last
month was the fourth-warmest January since recordkeeping began in 1880.
It was also the 347th consecutive month with above-average temperatures
compared to the 20th century average, which has been fueled in large
part by climate change. That streak is one month shy of 29 straight
years. Global average temperatures were also among their top 10 warmest
for the ninth straight month, according to data released Thursday by the
National Oceanic and Atmospheric Administration (NOAA)..."
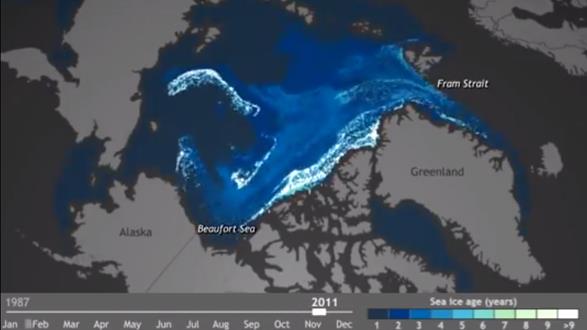
Old Arctic Ice Is Disappearing And Taking The Rest Of The Ice With It.
Slate has the article; here's the introduction: "
The National Oceanic and Atmospheric Administration recently released a video
that shows compellingly just how bad things are getting at the top of
the world. The animation displays Arctic ice over time not just by how
much area it covers, but also by age, with white being the oldest ice
(nine years or older): It’s not hard to see that over the past few
years, the oldest ice has melted away, and over time the ice gets
younger. That’s not good:
Older ice is thicker and tends to hang around longer; young ice is
generally thinner and melts away every summer. That means that the
year-round amount of ice is dropping, and dropping rapidly..."


Hi! I love reading your blog. Especially after a big storm! You sometimes post a map of the snow totals from the snowstorms. Can you post a link to it for Thurs /Fri storm, please? I am eager to see where the biggest & smallest snow falls are. It's the map with the colorful circles representing different amounts. Thank you!
ReplyDeletePaul, I just wanted you to know that I appreciate this weather column and check it every day. Also, I really love your "Climate Matters" videos. We are enjoying having WeatherNation on Directv, too!
ReplyDelete