64 F. high in the Twin Cities Monday.
56 F. average high on October 20.
47 F. high on October 20, 2013.
October 20, 1916: Three day blizzard ends. Temp at Bird Island falls from 65 to 13.
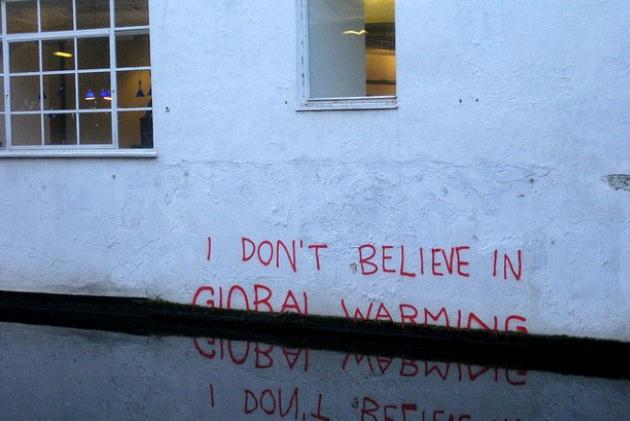
"...
Some
people, mostly non-scientists, have been claiming that the world has
not warmed in 18 years, but "no one's told the globe that," Blunden
said. She said NOAA records show no pause in warming. The
record-breaking heat goes back to the end of last year — November 2013
broke a record. So the 12 months from October 2013 to September 2014 are
the hottest 12-month period on record, Blunden said. Earth hasn't set a
monthly record for cold since December 1916, but all monthly heat
records have been set after 1997..." - from a Seth Borenstein AP article at
Huffington Post.
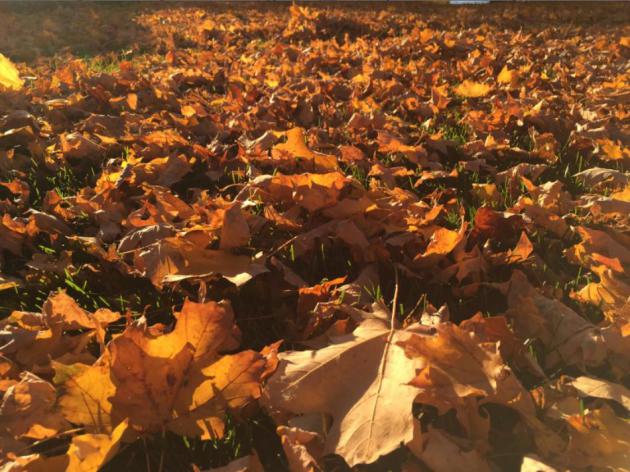
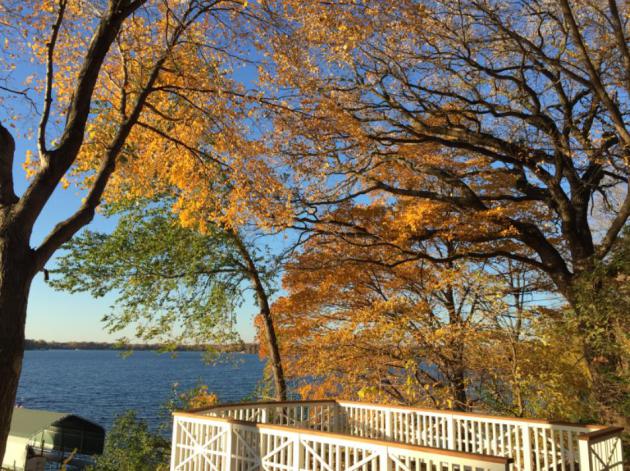
Perpetual September
I'm
having a really good weather dream. Please don't wake me up. No
newscast-leading storms, San Diego-like 60s every day, happy strangers
waving at me with all their fingers. I could get used to this.
Climate
skeptics talk about a "temperature pause", even though the atmosphere
makes up 3 percent of Earth's heat engine; most excess CO2 warming is
going into the world's oceans.
The top 10 warmest years,
worldwide, have all been observed since 2000, according to NOAA and
NASA. And in spite of a lack of El Nino warmth (yet) 2014 is on track to
be the warmest year, worldwide, since 1880.
Some pause.
Our
perpetual September spills over into next weekend, when highs should
once again surge thru the 60s to near 70F. Not bad, considering today's
sun angle is identical to February 21. Expect midweek showers, then
rapid clearing with weekend weather that would feel right at home in
early September.
Models show a chilly slap early next week,
followed by gradual moderation. The GFS model shows temperatures near
50F with a shower risk on Halloween.
The pattern favors Nor'easters over New England and soaking storms for the Pacific Northwest.
Fly-over Country is quiet, for now.
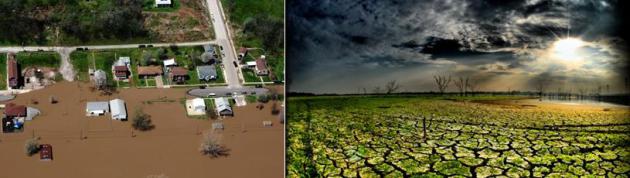
El Nino Brings Floods, Risks, and Opportunities.
Even a mild El Nino warming phase of the Pacific (which still looks
likely) might tilt the odds over in favor an average or slightly milder
than average winter. There are other consequences of this warm phase;
here's an excerpt from
Climate Central: "...
Those
patterns reflect the broad changes El Niño, known more fully as El
Niño-Southern Oscillation or ENSO, generally causes to precipitation
patterns globally. The warming of water in the eastern equatorial
Pacific that characterizes El Niño tends to shift the odds of
precipitation in certain places around the globe, though it by no means
guarantees it. “There have been studies (showing) that some areas
get more rainfall during El Niño years, but more rainfall doesn’t
necessarily mean more floods. So we’re looking at the actual flooding
and damages caused by flooding,” Ward said..."
Animation credit above: "
A map showing sea surface temperature anomalies leading up and during the 1997-98 super El Nino." Credit: NOAA View
El Nino Ups Flood Risk. Scientific American
has more details on the recent report, highlighting where flood/drought
tends to spike during El Nino warming phases in the Pacific; here's a
clip: "...Ward and his colleagues found that 44 percent of
river basins around the world saw changes in 100-year flood risks during
El Niño or La Niña years, with some seeing higher risk of floods and
loss of property and some seeing lower risk. The Southwest U.S., parts
of southern South America and the Horn of Africa saw some of the biggest
increases in flooding risks while the West Coast, Sahel region of
Africa and Australia saw the biggest decreases..."
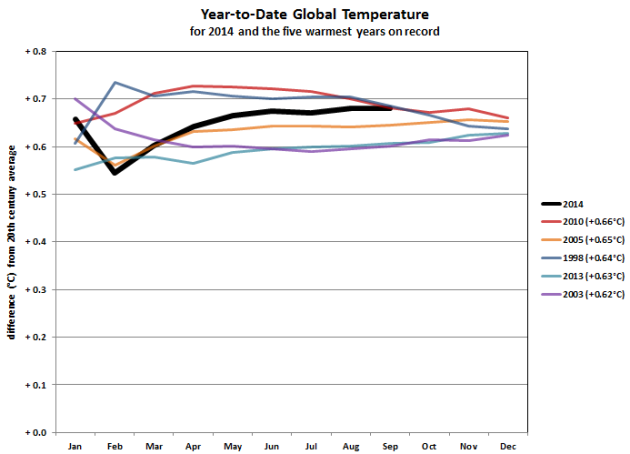
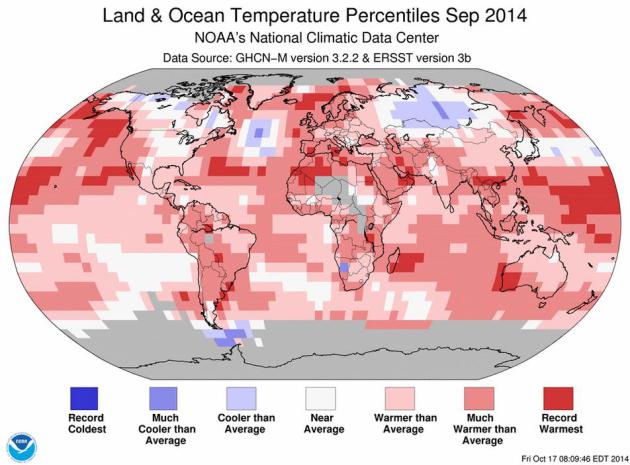
2014: On Track for Warmest Year, Worldwide, on Record.
Global temperatures are on track for the warmest year, worldwide, since
the late 1800s. What makes this especially noteworthy is a lack of an
El Nino warm phase (yet), a warm stain of Pacific water tends to
turbocharge air temperatures downwind as well, but we've been in an
ENSO-neutral phase for much of this year. A worldwwide "temperature
pause"? Not so much. Here's an excerpt from
NOAA NCDC: "...
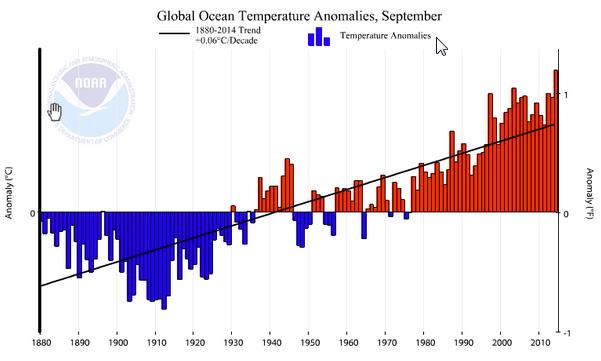
The
graphic (above) shows the basic year-to-date comparison. The graphic on
the right zooms even further to what were ultimately the five warmest
years on record, and shows several end-of-year results based on the
following scenarios: The years 2013 and 2014 are the only years on this
list not to begin during a mature El Niño event. The years 1998 and
2010, each of which became the warmest year on record at the time, ended
the year in a strong La Niña event, as evidenced by the relative fading
of global average temperature later in the year...."
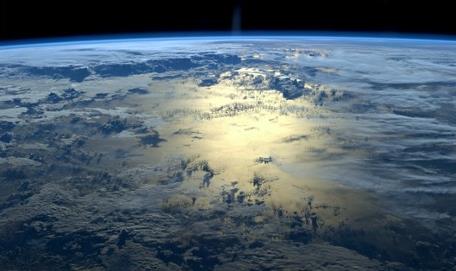
2014 On Track To Be Hottest Year On Record, Says U.S. Science Agency.
The 10 warmest years, worldwide, have all been measured since 2000.
Following up on the post above here's a clip of a good summary from
The Guardian: "
The
world is on course for this to be the hottest year ever, with global
land and sea temperatures for September the highest ever recorded for
the month, the National Oceanic and Atmospheric Administration said on
Monday. The findings,
which confirm September as the warmest such month on record, continue a
string of record-beating months for global temperature. The year to
date for 2014 is already tied with 1998 as the warmest such period since
record keeping began in 1880, Noaa scientists said..."
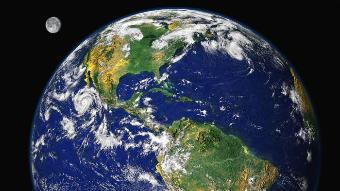
Image credit above: "
U.S. agency NOAA said: ‘If 2014 maintains this temperature departure from average... it will be the warmest year on record." Photograph: ISS/NASA.
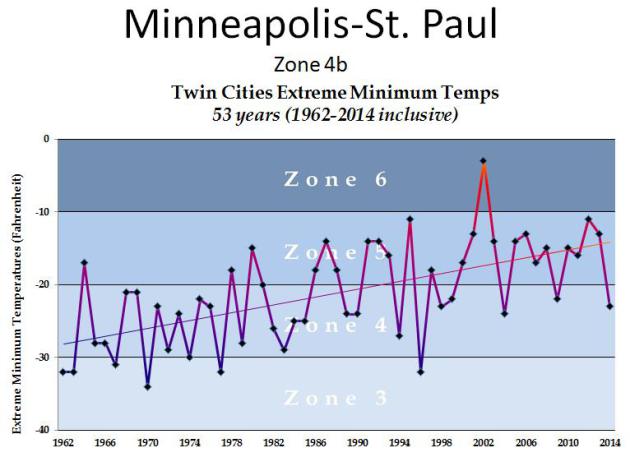
Coldest Winter Temperatures at MSP Since 1962.
Jack Falker is an investment banker (Falker Investments) and prize rose
grower, based in Edina. He sent me a graph he completed, showing the
coldest nighttime temperatures every winter going back to 1962. Of couse
this makes a difference in what will grow in the Twin Cities, an even
specific varieties of roses that are more cold-tolerant. In spite of
last winter's big dip you can clearly see the trends. As a rule, winter
temperatures are not as cold as they were 30-50 years ago, especially
nighttime lows. Here's an excerpt from Jack's latest post: "
The Minnesota Rose Gardener: Winter Protecting Roses in a Climate-Change Environment: "...
(above)
is my recently updated Minnesota climatology chart showing the Extreme
Minimum Temperatures (EMT) for the last 53 years at MSP airport. This
is the statistic the USDA uses to determine the cold zones. As you can
see, the Twin Cities are no longer consistently in USDA Zone 4b. As a
matter of fact, there have only been three nights in Zone 4 in the Twin
Cities, since 1999! That hardly puts us in Zone 4 and, as you can see,
the mathematically determined trend-line has an upward slope of about 25
radian degrees. If you project that trend-line off the right side of
the chart, it would appear that the Twin Cities will begin to see more
winters in zone 6 than in zone 4, within the next five years..."
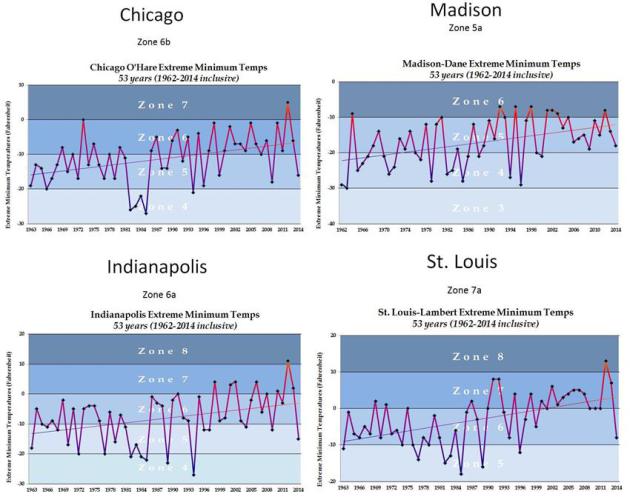
Similar Trends.
Jack Falker created similar graphs for other cities across the Midwest
and Great Lakes, and found a similar warming trend over time. Nature
never moves in a perfectly straight line, but if you draw a smoothed
line over the actual observations you can see the trends fairly clearly.
Which underscores something I tell people in my talks: don't look at
your thermometer for day to day evidence of warming. Look at the new
plants, shrubs, flowers, trees (and pests) that in your yard that
weren't there 40 years ago.
Nor'easter Potential.
NOAA's 4 km NAM model shows a surge of heavy rain rotating around a
developing storm over New England, a 2-3" soaking possible from Boston
to Portland, Maine with a potential for flash flooding. A soggy front
lashes the Pacific Northwest with heavy rain, showers pushing farther
south into California. The next chance of showers for Minnesota?
Wednesday into early Thursday. Map: HAMweather.
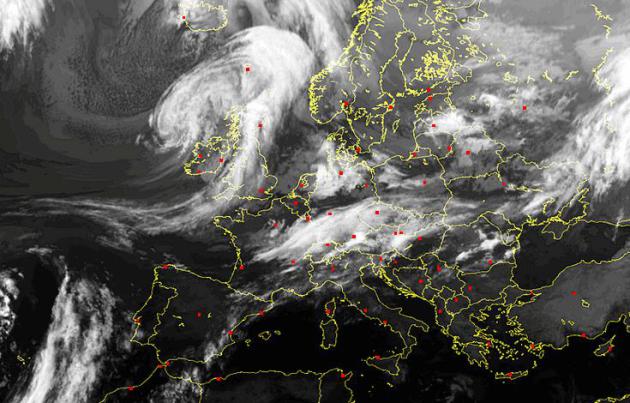
Tail-End of Hurricane Gonzalo Set To Buffet Northern Ireland. Here's an excerpt from
The Belfast Telegraph: "
The
remnants of Hurricane Gonzalo - fresh from wreaking havoc in Bermuda -
will hit Northern Ireland later tonight with a 'yellow' weather warning
in place for high winds tomorrow and possible morning rush hour
disruption. The Met Office says the winds in will be at their peak in
Counties Londonderry, Antrim, Armagh and Down on Tuesday. Gales of up to
60mph and heavy rain will move eastwards for around 24 hours..." (Image above: sat24.com).
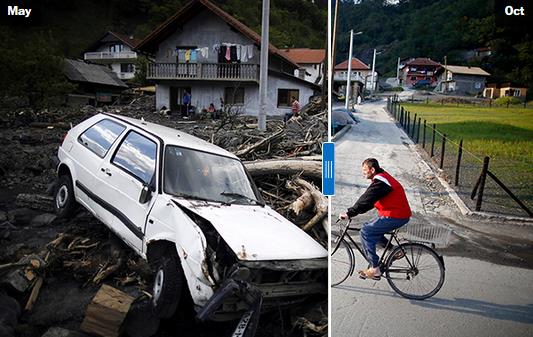
What Clean-Up From The Worst Flood in 100 Years Looks Like. The Balkans were hit by historic flooding back in the spring.
The Washington Post follows up with a photo essay that shows how far one village has come since the floods and mudslides; here's an excerpt: "...
Last May, the worst flooding in more than 100 years ripped through the Balkans — triggering thousands of landslides, unearthing landmines, killing 50 people, damaging 43,000 homes and displacing 90,000 people. More than 1 million people were affected as roads and homes were buried in mud and debris...."
Photo credit above: Dado Ruvic / Reuters.
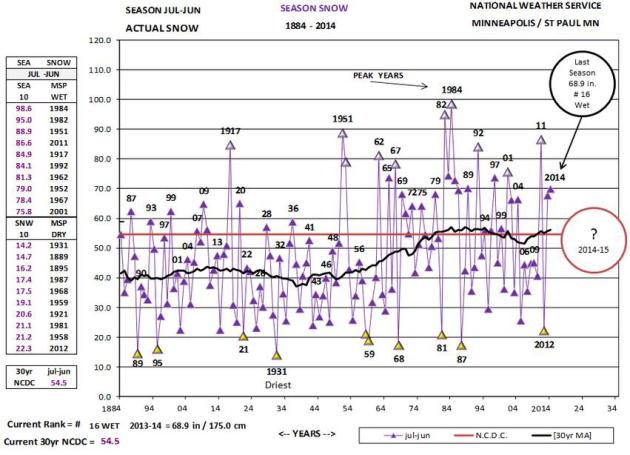
MSP Snowfall Trends.
The graph above shows seasonal snowfall for the Twin Cities since 1883;
a slight uptick in amounts since the 1950s, but considerably more
volatility too, greater swings and extremes since the early 80s. Go
ahead, flip a coin. Chance are it won't be "average". Graphic:
Twin Cities National Weather Service.
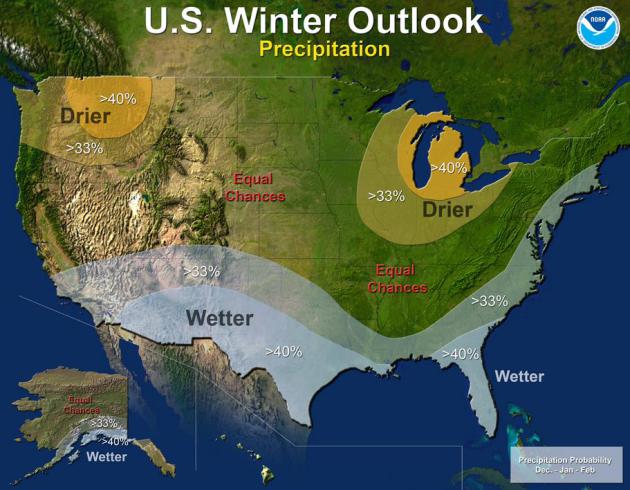
Winter Precipitation Trends.
The map above shows NOAA's winter overview: drier for the Pacific
Northwest and Great Lakes; El Nino creating a split jet stream flow that
tends to keep the southern USA and East Coast wetter.
NOAA adds: "
Last
year’s winter was exceptionally cold and snowy across most of the
United States, east of the Rockies. A repeat of this extreme pattern is
unlikely this year, although the Outlook does favor below-average
temperatures in the south-central and southeastern states..."
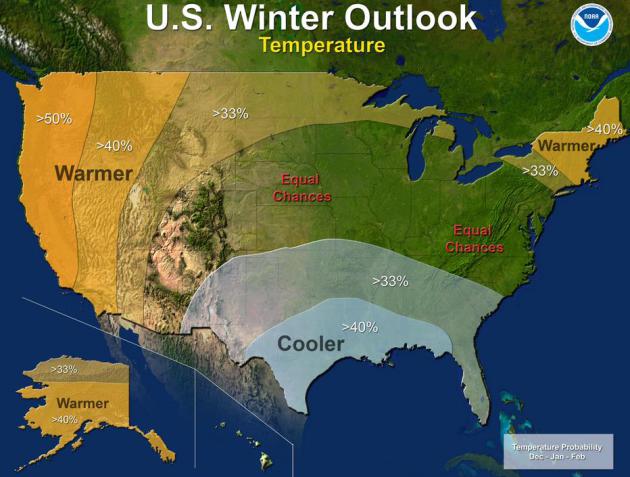
December - February Temperatures.
A few private forecasting firms are still predicting another bitter
"Polar Vortex 2" winter, but I'll be amazed if we fall into the exact
same block that set up last winter. Yes, there was early snow coverage
across Siberia (sometimes a cue of harsh winters to come downstream over
North America) and persistent ridging continues in the Gulf of Alaska,
which may eventually turn on a northwesterly flow aloft east of the
Rockies. That said, I still think we'll see more of a zonal influence
over the central USA, with or without El Nino kicking in.
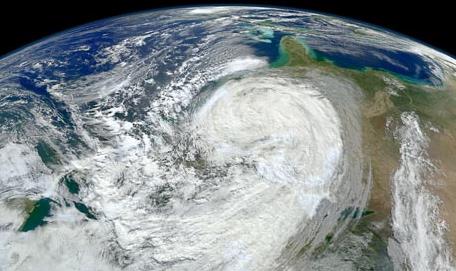
Two Years After Hurricane Sandy Hit The U.S. What Lessons Can We Learn From The Deadly Storm? National Geographic poses the question, taking another look at Superstorm Sandy; here's a clip: "...
In
the case of Sandy, the European model was the outlier for days. The
great irony with Sandy was that it went exactly where the European model
said it was going to go. All the other models, including the ones the
National Hurricane Center has come to regard as very reliable, were
consistently saying, No, the storm is going to go out to sea. It really
wasn't until the 25th of October, just four days before the storm made
landfall, that the other models started to join the European model in
saying that it was going to make this crazy arc into land..." (Sandy image: NASA).
Threats To Americans, Ranked (by Actual Threat Instead of Media Hype).
Ebola and ISIS is getting the web clicks now, but we've lost sight of
the big picture, and the threats that stand a much higher chance of
darkening our doorways. Here's a clip from
Vox, talking about the #1 risk: heart disease and cancer: "...
These could become even deadlier as Americans get unhealthier. Heart disease correlates with rising obesity. Cancer rates also correlate with obesity, smoking, and other unhealthy practices. How freaked out should you be: The
odds are that one of these two things will kill you, so you should be
thinking about this. The good news: it's pretty easy to reduce that risk
by making healthy lifestyle choices
and screening regularly for cancer. Much easier for any given American,
at least, than combatting West African Ebola outbreaks or Middle
Eastern terrorist groups..."
TODAY: Sunny and pleasant. Winds: East 10. High: near 60
TUESDAY NIGHT: Mostly clear and cool. Low: 43
WEDNESDAY: Clouds increase, PM showers likely. High: 59
THURSDAY: Damp start, then clearing skies. Wake-up: 47. High: 62
FRIDAY: Mild sunshine. Put boat back in the water. Wake-up: 42. High: 68
SATURDAY: Sunny, Indian Summer lingers. Wake-up: 46. High: 63
SUNDAY: Pinch me (please). Amazingly nice. Wake-up: 45. High: near 70
MONDAY: Early shower, then clearing, cooler. Wake-up: 53. High: 59
Climate Stories...
Another Month, Another Global Heat Record Broken. Will
2014 break another record? It's still a little early, but if the warm
weather departures we've been tracking in recent months continue the
answer is probably yes. Here's an excerpt from AP and
Huffington Post: "...
If
2014 breaks the record for hottest year, that also should sound
familiar: 1995, 1997, 1998, 2005 and 2010 all broke NOAA records for the
hottest years since records started being kept in 1880. "This is one of
many indicators that climate change has not stopped and that it
continues to be one of the most important issues facing humanity," said
University of Illinois climate scientist Donald Wuebbles..."
World's Oceans Set All-Time Heat Record for Third Time This Year. Meteorologist Andrew Freedman has the story for
Mashable; here's an excerpt: "...
For
the third month this year, the world's oceans set a record for the
warmest they have ever been since at least 1880, the National Oceanic
and Atmospheric Administration (NOAA) reported
on Monday. September had the highest global average sea surface
temperatures of any month on record since instrument record-keeping
began, with a global average temperature of 61.1 degrees Fahrenheit.
This was warm enough to set another milestone that had already been set
two previous times this year; the average global sea surface temperature
was so warm in September that it broke the all-time record for the
highest departure from average for any month since 1880, at 1.19 degrees
Fahrenheit above average..."
Map credit: NOAA NCDC.
The Difficult Dance of the 2014 Climate Change Denier. Here's an excerpt of a
Huffington Post story: "...
To
continue to claim that climate change is a hoax would get them labeled
as crazy, but to fully accept climate science requires them to favor a
solution to this threat, which would make them pariahs to the Koch
brothers and other polluters who are spending millions of dollars
attacking their opponents. These candidates' climate science denial
becomes a reflection of a disturbing character trait - their
unwillingness to address a growing threat to Americans because the
possible solutions may affect their benefactors' profits. This crop of
candidates ignores increasingly urgent warnings from NASA, the National
Academy of Sciences, and nearly all other scientific bodies, simply to
appease their special interest supporters. Their dance is choreographed."
In The Midwest, In The World, The Only Doubt Is In Our Minds. Here's a snippet from a story at
The Fort Wayne Journal Gazette:
"...But one finding during the national and international studies of
the past few years surprised even the scientists. “We're seeing strong
trends in extreme events,” Wuebbles said. “We expected to see an
increasing trend for heat waves and generally a decreasing trend for
cold waves. “But what we didn't realize, and we should have, is that
more precipitation is coming in larger events – a very clear trend
that's occurring, particularly here in the Midwest..."
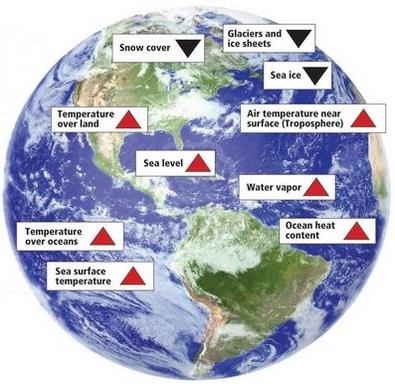
Image credit above: "
These
are just some of the indicators measured globally over many decades
that show the earth's climate is warming. Red arrows indicate increacing
trends, blaok arrows indicate decreasing trends. All the indicators
expected to increase in a warming world are increasing, and all those
expected to decrease in a warming world are decreasing."
Second Annual Minnesota Climate Adaptation Conference. Tickets are still available
for the November 6, 2014 conference at the Hyatt in Minneapolis. Last
year's conference was eye-opening with useful, actionable information
across multiple industries and agricultural concerns. Here's a draft
agenda and overview of what to expect this year: "
The 2014
Conference on Climate Adaptation is designed for local officials,
planners, engineers, natural resource practitioners and others who want
to know more about climate adaptation strategies. Learn about new plans
that have been implemented or tested in various sectors, including human
health, local governmental entities, college campuses, resources,
recreation, and agriculture. Discover ways in which individual action
could impact climate change. Our keynote speakers will provide updates
on the increasing number of severe storm events, with continuing
discussion in breakout sessions in the morning and afternoon.
Registration is $95.00, which includes lunch, breaks and parking."
No comments:
Post a Comment