50 F. high in the Twin Cities Sunday.
27 F. average high on December 14.
16 F. average high on December 14.
1/10th of an inch of snow has fallen during the first 14 days of December.
5.7" snow should have fallen since December 1.
8.9" snow fell between December 1-14, 2013.
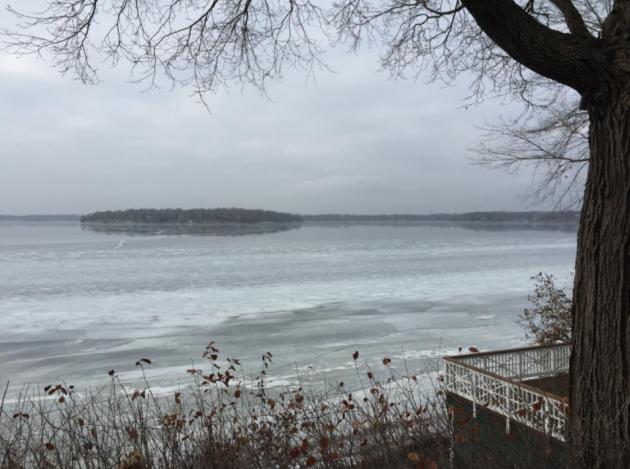
December Puddles
Emerging
from hibernation can be awkward. "Let me be the 100th person to ask if
we're having a white Christmas" my neighbor, Teri, asked me yesterday.
Not looking good, I answered. It could be the first brown Christmas in 3
years. "Can you explain that to 7 family members driving up from Texas?
One of them has never seen snow. He will be crushed" she sighed.
Snow
for Christmas is no longer a sure thing. Winters are becoming
ever-weirder. More volatile. According to Dr. Mark Seeley Minnesota has
seen a 4X increase in mid-winter rain and ice since 2000.
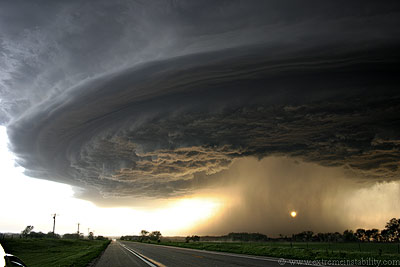
Exhibit
A: today. Expect moderate rain as temperatures fall through the 40s. An
inch or two of slushy snow piles up tonight at the tail-end of the storm
- the same storm that clobbered California with flooding rains,
mudslides, even a small tornado in the skies above L.A. Friday.
Here's
what I believe: we'll see our fair share of cold fronts and snowstorms
this winter. But El Nino will take the edge off the coldest air. I would
wager a (stale) bagel that this winter won't be as persistently bitter
as last.
After cooling off to average this week with a rare sunshine sighting expect another thaw just in time for Christmas.
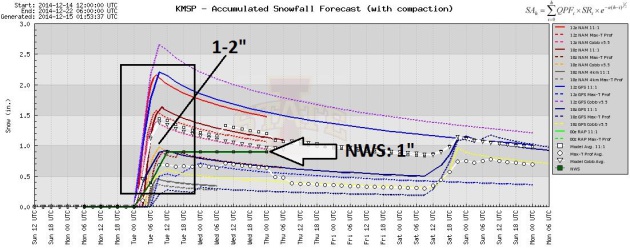
Slushy Monday Night.
Models are converging on an inch or two of snow for the Twin Cities
tonight, maybe a little more north and west of MSP, less south and east
of the downtowns. Although I don't expect much snow, temperatures
falling into the 20s will ice up any wet wet, slushy roads after 6-7 PM
or so.
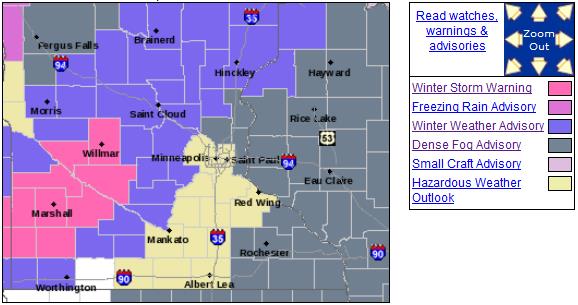
Advisories and Warnings.
The Twin Cities office of the National Weather Service has issued a
Winter Weather Advisory for Carver and Wright counties, deeper in the
cold air, for a few inches of accumulation from late afternoon into the
wee hours of the morning. Winter Storm Warnings are posted from Marshall
to Montevideo to Willmar for some ice and 3-5" amounts.
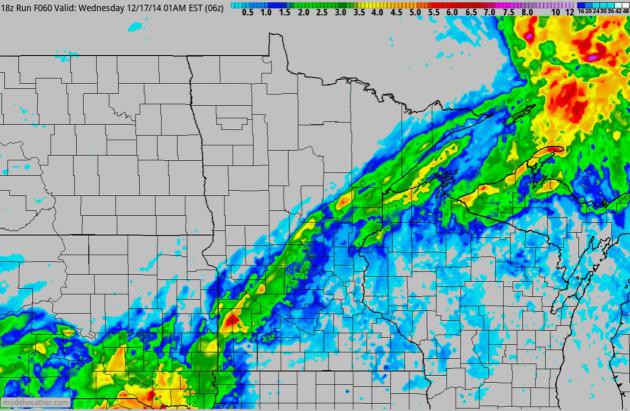
60-Hour Snowfall Animation.
An area of rain rotating north (the soggy remains of the massive storm
that smacked California late last week), and then as the column of air
overhead rapidly cools a changeover to snow is likely from southwest to
northeast across the state by late afternoon and evening. NAM guidance:
NOAA and HAMweather.
Nuisance to Plowable.
The best chance of enough snow to shovel and plow comes over southwest
Minnesota this afternoon into tonight, some 3" amounts near Willmar and
LIttle Falls, closer to 1-2" from St. Cloud into the Twin Cities. I
expect mostly rain up until late afternoon; probably wet roads for the
Twin Cities for the drive home later today, but increasingly slushy
roads after 7-8 PM.
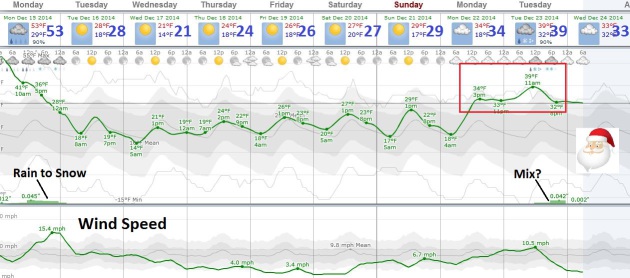
The Inevitable Correction.
After pushing into the low 50s over the weekend temperatures drop
through the 40s today, reaching the 30s by late afternoon. Rain ends as a
period of wet snow tonight, and then dry weather prevails Tuesday into
Monday, the 22nd. European guidance hints at a mix next Tuesday; if we
do see a white Christmas (1" or more on the ground) it'll be by the skin
of our teeth.
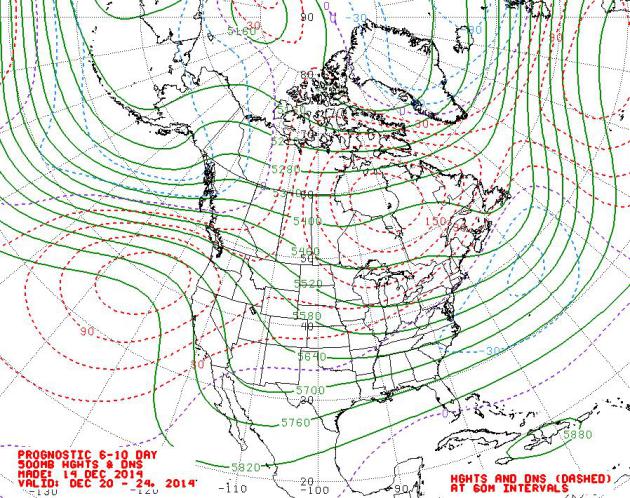
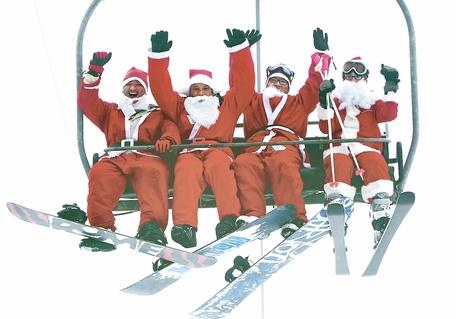
No Tailwind for Santa.
Prevailing winds from December 20-24 are forecast to be from the
west-northwest, blowing more Pacific air into the Lower 48, moderating
just how cold it can get through Christmas. We're due for a temperature
correction, which may be shaping up for the last few days of 2014. Map:
NOAA.
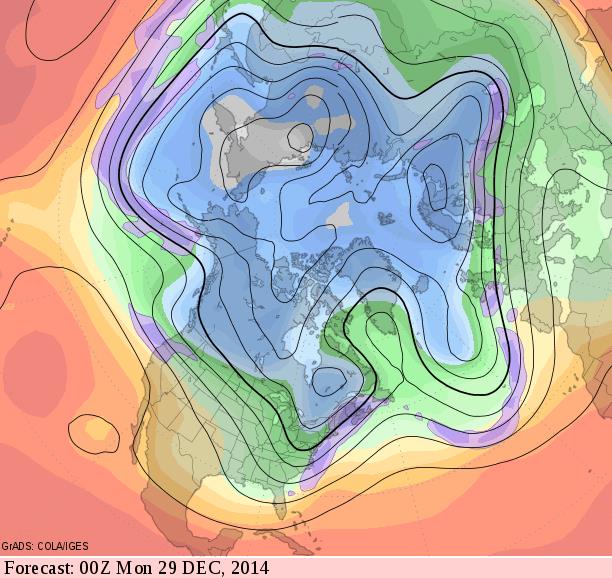
Extended Outlook: Colder, But Not Exactly Polar.
NOAA's GFS model shows little change in prevailing jet stream winds by
the end of the month, but colder air will begin to drain southward over
Canada, setting the stage for a real cold front in time for New Year's
Eve festivities. Map: GrADS:COLA/IGES.
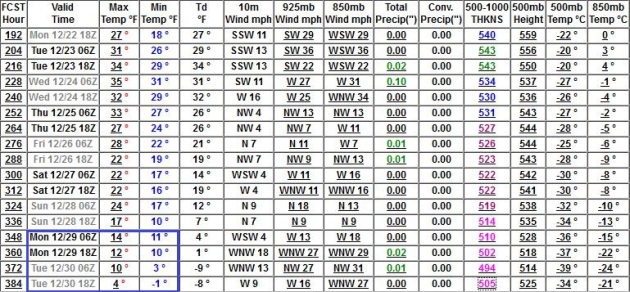
Christmas Thaw - Much Colder By New Year's Eve.
Long-range GFS numbers show highs above freezing Christmas Eve and
Christmas Day; not one of our whiter Christmases in recent years. Highs
may hold in single digits and teens the last few days of December as a
series of real cold fronts take a test drive overhead.
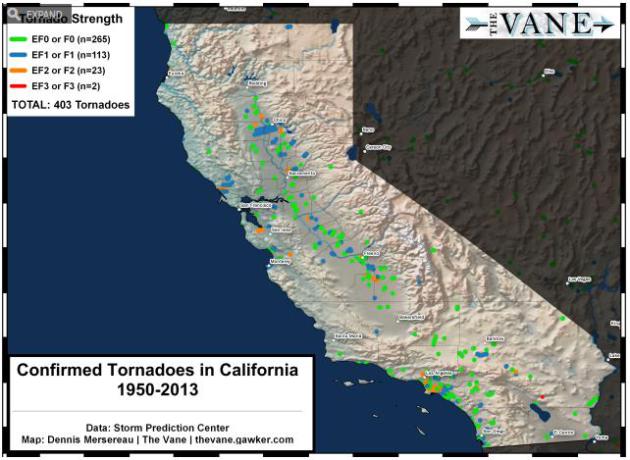
Maps: Tornadoes in California Aren't As Rare As You Might Think. Gawker does a good job of putting Friday's (tiny) tornado in south Los Angeles into perspective; here's an excerpt: "...
Between
1950 and 2013, there were 403 confirmed tornadoes in California, coming
out to an average of around 6 or 7 tornadoes per year. The vast
majority of them occurred in the Central Valley, but you can see a tight
cluster of tornadoes down around Los Angeles. Most of the twisters are
weak, with 66% of those surveyed by meteorologists rating either F0 or
EF0 (we switched from the Fujita Scale to the Enhanced Fujita Scale
in 2007). A handful of tornadoes recorded in the state have been
significant, with 23 clocking in at F/EF2 and two achieving F3 status..." (Map credit: Dennis Mersereau, The Vane).
"How's The Weather?" Becomes a Loaded Question. Yes, we are all armchair meteorologists (and climate experts) now. Here's an excerpt from a
New York Times article: "...
According
to a recent report by the World Bank Group, extreme weather events
could become the new “climate normal.” In this world of “increased risks
and instability,” it seems we find comfort in being armed with the
facts. With access to the storm-surge of information on our smartphones,
we are all meteorologists now. Just a few years ago, terms like extreme
snowfall or polar vortex were familiar only to professionals; today,
they are bandied about in coffee shops and office elevators..."
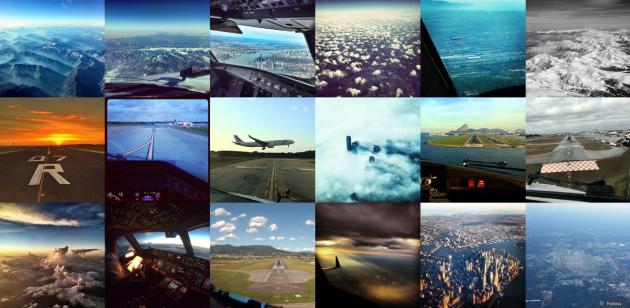
The Pilots of Instagram: Beautiful Views From The Cockpit, Violating Rules of the Air.
Yes, if I was a pilot I'd probably be taking (illegal) selfies with me
and the weather out the cockpit window too - so I sympathize. The FAA
may not be so sympathetic. Here's a clip from
Quartz: "
The
pilots of Instagram are internet famous. Their stunning photos of the
skies, captured from their unusual perspective inside the cockpit,
garner hundreds, sometimes thousands of likes from fans.
But taking photos, or using most any electronic device, while piloting a
commercial aircraft is prohibited by American and European regulators.
Pilots for airlines large and small, flying planes of all sizes, seem to
be violating the safety rules, taking photos with their phones as well
as GoPro cameras mounted inside the cockpit..." (Images above: Instagram).
TODAY: Periods of rain ends as temperatures fall. NE 10-20. High: 48 early, reaching upper 30s by late afternoon.
MONDAY NIGHT: Wet snow, an inch or two possible. Getting slippery. Low: 26
TUESDAY: Slick start. Mostly cloudy with a colder wind. Feels like 15F. HIgh: 27
WEDNESDAY: More clouds than sun, chilly. Wake-up: 14. High: 23
THURSDAY: Risk of spying the sun. Still brisk. Wake-up: 13. High: 25
FRIDAY: Sunny peeks, good travel weather. Wake-up: 15. High: 28
SATURDAY: Light winds, average temps. Wake-up: 18. High: 30
SUNDAY: Still gray, quiet for late December. Wake-up: 19. High: 31
* File photo: Robert F. Bukaty, AP.
Climate Stories....
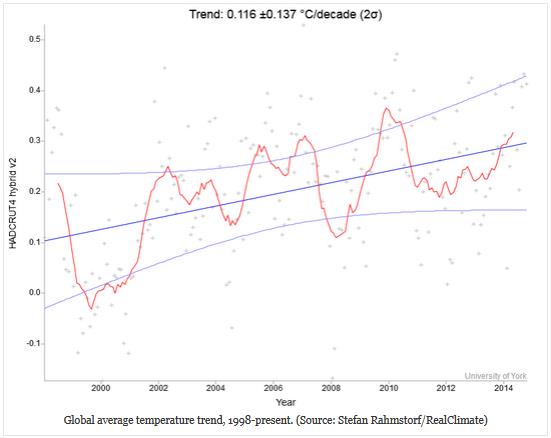
Global Average Temperature Cools A Bit in November, But No Pause in Global Warming - And There Never Was One. A long headline, but
Discover
has a very good article explaining the fallacy of the alleged
"temperature pause". The vast majority of extra heat is going into the
world's oceans, which may accelerate sea level rise and fuel stronger
hurricanes. Here's a clip: "...
In fact, as many papers pointed out,
there has been no real overall pause: the Earth system has been
continuing to accumulate heat, thanks to humankind’s emission’s of
carbon dioxide and other greenhouse gases. It’s just that a lot of that
heat seems to have been going into the oceans, slowing the rise in
temperatures at the surface. Moreover, it’s important to emphasize that
each of the last three decades has been warmer at the surface than every
preceding one back to the start of modern record keeping in the 1880s..."
Graph credit above: "
Global average temperature trend, 1998-present." Source: Stefan Rahmstorf/RealClimate.
 Weather Bombs, Polar Vortex: Global Warming's Influence on Extreme Weather.
 No, it's probably not your imagination. Here's an excerpt from Stanford and
Science 2.0: "...
The
media are often focused on whether global warming caused a particular
event," says Diffenbaugh, who is a senior fellow at the Stanford Woods
Institute for the Environment. "The more useful question for real-world
decisions is: 'Is the probability of a particular event statistically
different now compared with a climate without human influence?'" His
belief is based on three elements of varying rigor: climate
observations, climate computer simulations which estimate variations in
climate and statistics to reconcile the first two..."
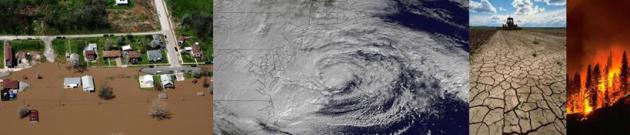
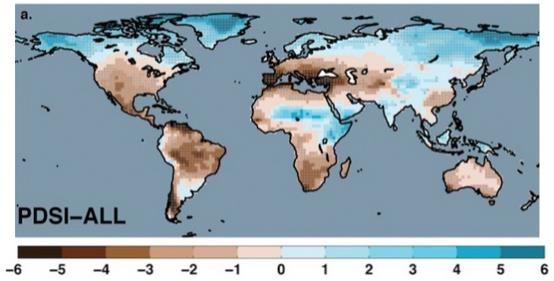
What We Learned About Climate Change in 2014, in 6 Scary Charts. Here's an excerpt from ThinkProgress: "...
The
2014 chart I consider the most important is not the prettiest or
simplest. But it is the one that best captures our latest understanding
of what has emerged as the greatest danger to humanity this century from
human-caused climate change — Dust-Bowlification and the threat to our food supplies. This map of the global drying we face uses the Palmer Drought Severity Index (PDSI), a standard measure of long-term drought. It is excerpted from the study, “Global warming and 21st century drying...”
Graphic credit above: "
Palmer
Drought Severity Index (PDSI) for 2080-2099 with business-as-usual
warming. By comparison, during the 1930s Dust Bowl, the PDSI in the
Great Plains rarely exceeded -3 (see here)." Source:
Cook et al. and Climate Progress.
No comments:
Post a Comment