51R. Monday's high of 51F broke the old record of 49F set in 1923.
27 F. average high on December 15.
4 F. high on December 15, 2013.
.15" rain fell yesterday at KMSP. St. Cloud picked up
.38" of rain.
0" of snow on the ground at MSP International Airport. First time 0" reported since November 9.
Trace of snow on the ground at Duluth, where .51" of rain fell yesterday.
December 15 in Minnesota Weather History. Source: Twin Cities National Weather Service:
2000:
A surface low pressure system tracked east-northeast through Iowa on
the 18th and then into western Illinois during the early evening hours.
Extreme south central and southeast Minnesota received 6 to 10 inches of
snow, including Albert Lea with 10.5 inches, Kiester and Bixby with 6.0
inches.
1972: Fairmont had its fifteenth consecutive day with lows at or below zero degrees Fahrenheit.
1940: Snowstorm hits state. Water equivalent of the snow was 1.27 inches at Winona.
Wacko Weather
So
let me get this straight. After a cold, white Thanksgiving, and a 3-day
stretch of Easter-like 50s and rain in mid-December, odds now favor a
cold (brownish) Christmas? No wonder we're all so confused.
And
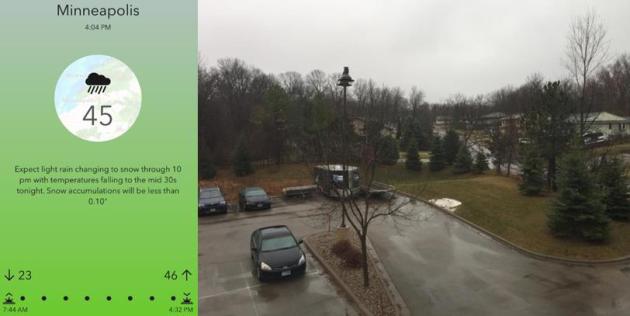
yes, just about any other December yesterday's precipitation would have
translated into a cool half foot of snow. Not this year. Slushy exhaust
at the tail-end of Monday's storm creates a few icy patches this morning
with highs stuck in the mid-20s, close to average for December 16. A
dry, seasonably chilly sky lingers into Sunday. Good news for Christmas
travel across the Upper Midwest.
“A day without sunshine is like,
you know, night" Steve Martin said. He was onto something. The recent
canopy of crud, fog and mist - coupled with the usual holiday insanity
and stress - has left many of us in a deep, dark funk. The sun may peek
out by Wednesday & Thursday as drier Canadian air finally breaks up a
very persistent inversion.
The Winter Solstice arrives Sunday at
5:03 PM CST, the least daylight of the year - and the worst day to get a
tan in the northern hemisphere.
We thaw out again early next week
before a cold front swoops in Christmas Day, with highs in the teens
& single digits. Ouch.
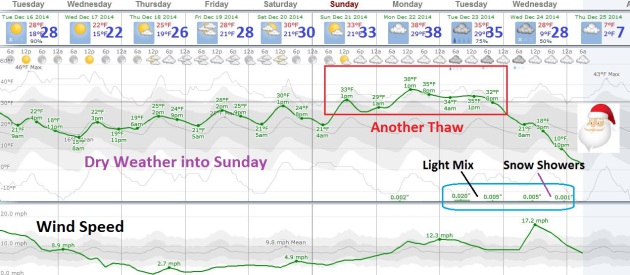
Slightly Warmer Than Average Next 9 Days.
Although we won't be flirting with 50 again anytime soon I do see
another thaw Sunday into Tuesday of next week, followed by a potential
temperature tumble by Christmas Day. I'm not convinced the high on
December 25 will be 7F in the Twin Cities, but there's little doubt it
will cool off around Christmas. Right now I don't see this cold surge
spinning up any significant snowstorms, but a light mix is possible by
Monday and Tuesday of next week.
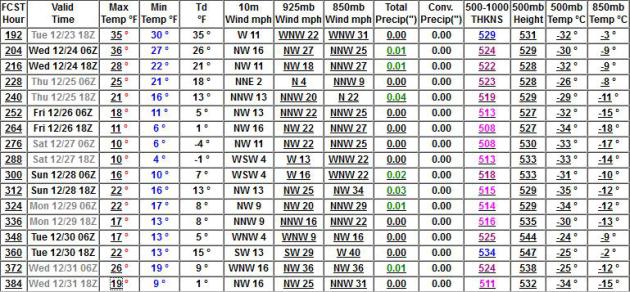
Extended Outlook: Colder, But Not Exactly Frigid.
Temperatures above 0F in late December? After last winter that seems
almost reasonable. The first surge of colder air arrives around
Christmas Day, a second reinforcing shot of chilly air around New Year's
Eve. The pattern looks very dry for the next 2 weeks; I see no evidence
of significant snow accumulation through the end of 2014. NOAA GFS
guidance.
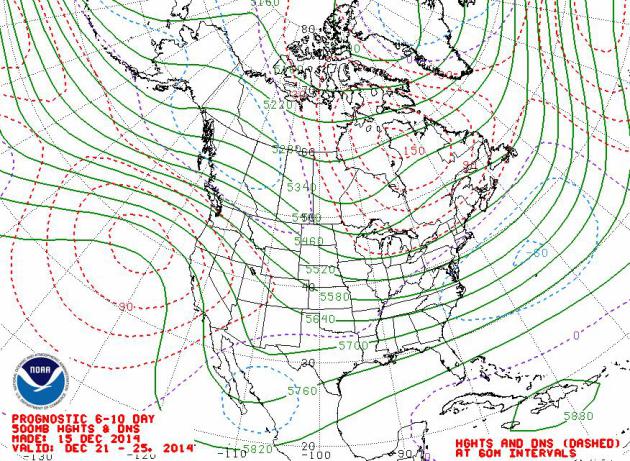
Prevailing Jet Stream Winds December 21-25.
I still don't see any evidence of the supernaturally strong ridge of
high pressure returning for western North America, which would, in turn,
increase the risk of a Conga-line of cold fronts hurtling southward
direct from the Arctic Circle. Whether it's a symptom of a brewing El
Nino or just natural atmospheric variability there is a tendency toward
troughiness and more major Pacific storms pushing into California, with a
more persistent west-northwest pattern than we saw last winter.
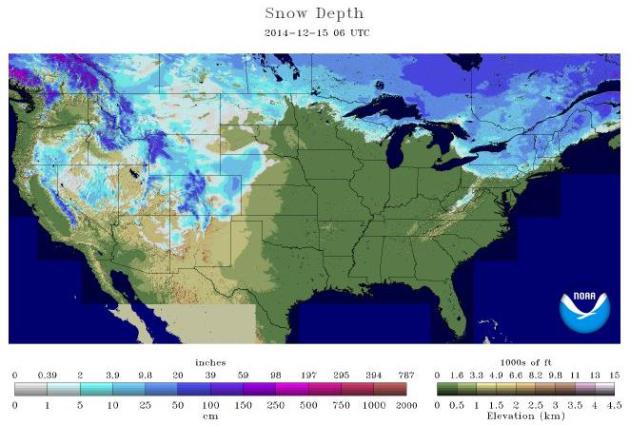
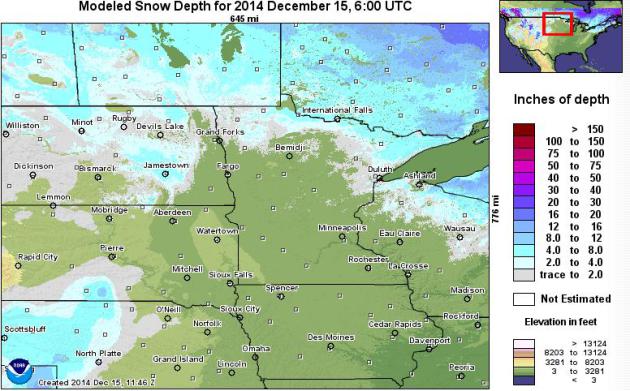
Shrinking Snow Pack. Winter is in reverse, at least for the next week to 10 days. Here's the latest USA snowcover map from
NOAA
- which reports that the percentage of the USA (lower 48) with snow on
the ground fell from 28.5% on November 15 to 27.6% yesterday. Blame (or
thank) a developing El Nino warm phase in the Pacific for hijacking jet
stream winds aloft and keeping them blowing more from the west than
northwest in recent weeks.
Where'd The Snow Go?
Snowmobilers are not happy. Neither are area ski resorts and
cross-country skiers. Hockey players looking for ideal conditions on
area rinks and ponds aren't thrilled either. The snowcover map looks
more like late October than mid-December. Source: NOAA.
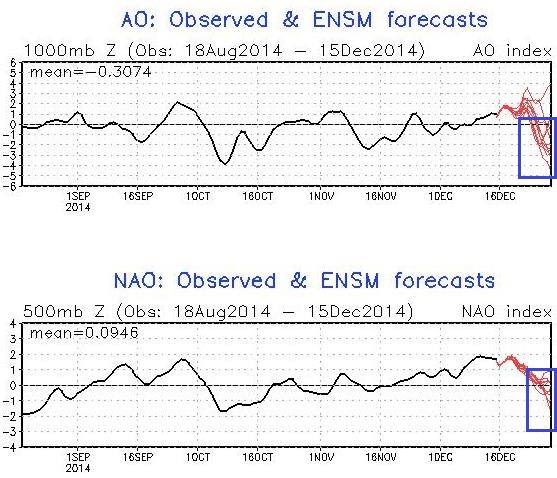
Negative Phase Of AO and NAO = Colder Fronts.
The last couple of weeks the AO (Arctic Oscillation) and NAO (North
Atlantic Oscillation) have been strongly positive, correlating with
strong west to east (zonal) winds pushing relatively mild, Pacific air
into much of the USA. NOAA forecasts both AO and NAO to become strongly
negative again by the end of December, meaning a higher amplitude
pattern capable of pulling in much colder air. Not polar-vortex cold,
but cold enough to get your attention.
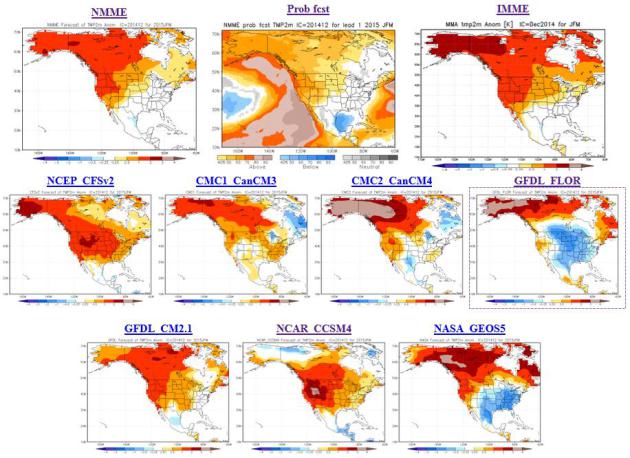
Climate Model Consensus: Mild Bias First Quarter of 2015.
We'll see, and no, I wouldn't bet the farm on a 90 day extended
outlook, but most of the climate models run by NOAA CPC (Climate
Prediction Center) show a mild bias for much of North America January,
February and March of 2015. Only the GFDL FLOR and NASA's GEOS5 climate
models show a chilly bias east of the Rockies. Either way, El Nino
should reduce the odds of an extended blocking pattern capable of
creating the polar pain we enjoyed last winter.
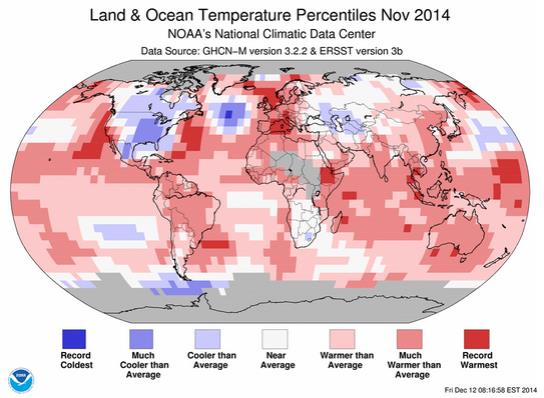
Earth Had 7th Warmest November on Record; Still On Track For Warmest Year. Meteorologist Jason Samenow at
The Washington Post's Capital Weather Gang has an update; here's an excerpt: "...
After
achieving its warmest August, September and October on record, the
Earth’s temperature stepped back from record-setting levels in November,
NOAA reports.
It was the 7th warmest November on record (dating back to 1880), but
the planet remains on track to have its warmest year – though just
barely. The average temperature of the oceans remained at record-setting
levels in November, extending the streak of record warm seas to six
straight months (May-November). But land areas only ranked 13th warmest..."
Map credit above: "
November 2014 temperatures difference from 20th century average." (NOAA)
NOAA Looks To Build The Next Generation Of Hurricane Planes. TBO.com,
The Tampa Tribune, has news of an RFP from NOAA for a (sturdy) new plane capable of sending back even more data; here's an excerpt: "...
But
Kermit and its sister Orion, Miss Piggy, are getting long in the tooth.
Each plane, which came on line in the mid-70s, has flown more than
10,000 hours and into more than 80 hurricanes. With the pounding they’ve
taken, the planes are undergoing a $35 million refurbishing job to
extend their service lives for another 15 to 20 years. Given that there
will still be hurricanes to hunt past the year 2030, NOAA is looking to
develop the next generation of Kermits and Miss Piggys. To that end, it
has put out a solicitation looking for companies that can help figure
out what kinds of sensors and other data-gathering equipment will be
needed in the future..." (WC130 "Hurricane Hunter" aircraft photo: NOAA).
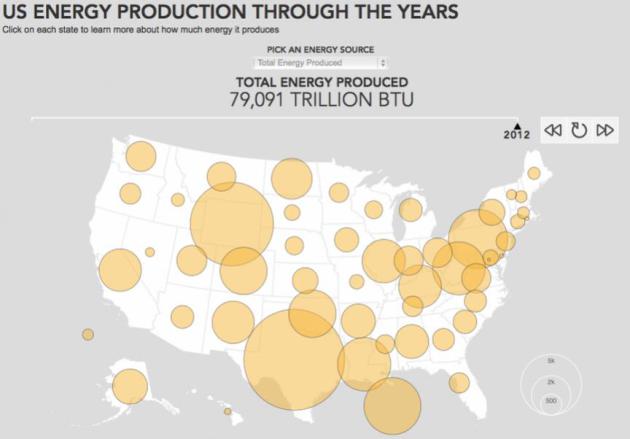
Trillions and Quadrillions: Numbers Tell U.S. Energy Story.
10 years ago who would have predicted that North Dakota would become
the rough equivalent of an energy superpower? Here's an excerpt from
Climate Central: "...
Just as the U.S. Energy Information Administration reported
that the crude oil production in the U.S. is expected to continue
booming even as oil prices decline, the federal government put out an interactive map
showing just how production of energy of all kinds has increased over
the past 20 years or so, and where those production hotspots are. For
example, in 2012, the U.S. produced a total of about 79,000 trillion Btu
or about 79 quadrillion btu of energy, up from about 68 quadrillion Btu
in 1993. By comparison, the average U.S. household burns about 89.6
million Btu of energy each year..."
Map credit above: "
The
largest energy producing hotspots in the U.S. as of 2012, part of a new
U.S. Department of Energy interactive map showing the growth in energy
production across the U.S." Credit: DOE.
"Sunn Light: An Artificial Sun In Your Family Room?"
I am tempted to run out and buy one of these to help with my SAD
(Seasonal Affective Disorder), but it's a Kickstarter project - those of
us who are sun-deprived will just have to be patient. Here's an excerpt
from
Gizmag: "...
There
are two sizes of Sunn Light: the smallest measures 48.6 cm (19 in),
contains a total of 240 LEDs, and outputs a maximum of 3,300 lumens,
while the larger measures 60 cm (24 in), features 330 LEDs, and outputs
up to 5,500 lumens. Both can be hung on a wall like a picture frame or
professionally fitted, and you can install essentially as many Sunn
Light units as you'd want (at least 100). Once paired with an iOS or
Android device via Bluetooth, a Sunn Light detects its latitude and
longitude, and mimics the natural rhythm of the sun in that area..."
15 Fun Facts About Fruitcake. Yes, how bored are you right now? For more than you EVER wanted to know about fruitcake check out this link from
mental_floss; here's a clip: "
Loved
or hated, but very rarely anything in between, fruitcake has long been
the holiday season’s favorite neon-dotted loaf, joke, and re-gift. But
in addition to being the baked good that never dies (literally—there are
a couple century-old fruitcakes in existence), it has also traveled to
space, become some towns’ claims to fame (“Fruitcake Capital of the
World,” Home of the “Great Fruitcake Toss”), and, somewhat recently,
suddenly gave an 89-year-old woman a brand new career..."
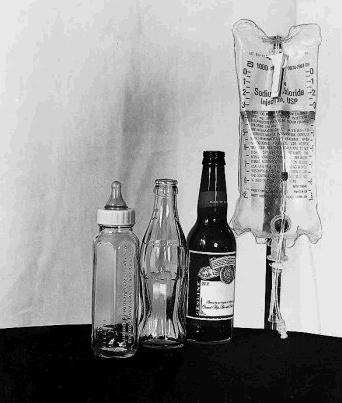
The 4 Stages of Life. No explanation required.
TODAY: AM slushy roads - slick spots, clouds linger with a cold wind. Feels like 10F. WInds: NW 10-20. High: 25
TUESDAY NIGHT: Partial clearing, colder. Low: 15
WEDNESDAY: Rare sunshine sighting? Less wind. High: 23
THURSDAY: Peeks of sun, chilly and dry. Wake-up: 14. High: 26
FRIDAY: Mostly cloudy, good travel weather. Wake-up: 17. High: near 30
SATURDAY: More clouds than sun, no drama. Wake-up: 20. High: 32
SUNDAY: Still gray, with a welcome PM thaw. Wake-up: 22. High: 33
MONDAY: Cloudy, breezy and milder. Wake-up: 29. High: 38
Climate Stories....
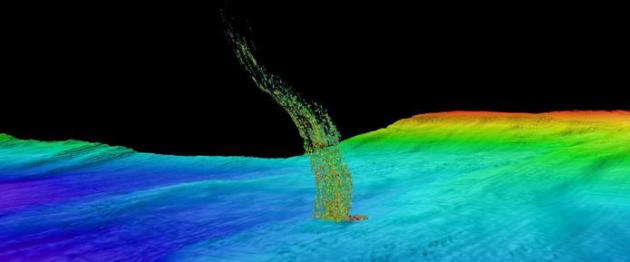
Warmer Pacific Ocean Could Release Millions of Tons of Seafloor Methane. We
are conducting an experiment on Earth's cryosphere, atmosphere and
oceans, and we're not exactly sure how this will all turn out.
The University of Washington has an article focused on warming seas, and the implications of warmer ocean water; here's a clip: "...
Off
the West Coast of the United States, methane gas is trapped in frozen
layers below the seafloor. New research from the University of
Washington shows that water at intermediate depths is warming enough to
cause these carbon deposits to melt, releasing methane into the
sediments and surrounding water. Researchers found that water off the
coast of Washington is gradually warming at a depth of 500 meters, about
a third of a mile down. That is the same depth where methane transforms
from a solid to a gas. The research suggests that ocean warming could
be triggering the release of a powerful greenhouse gas..."
Graphic credit above: "
Sonar
image of bubbles rising from the seafloor off the Washington coast. The
base of the column is 1/3 of a mile (515 meters) deep and the top of
the plume is at 1/10 of a mile (180 meters) deep."
Brendan Philip / UW.
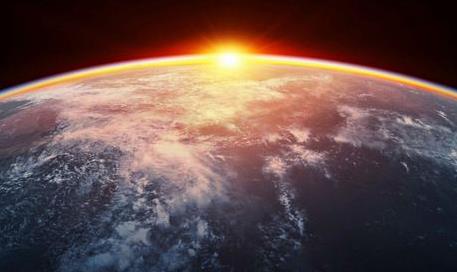
Past Global Warming Similar To Today's: Size, Duration Were Like Modern Climate Shift, But In Two Pulses. Here's an excerpt from a very interesting story at
phys.org: "
The
rate at which carbon emissions warmed Earth's climate almost 56 million
years ago resembles modern, human-caused global warming much more than
previously believed, but involved two pulses of carbon to the
atmosphere, University of Utah researchers and their colleagues found.
The findings mean the so-called Paleocene-Eocene thermal maximum, or
PETM, can provide clues to the future of modern climate change. The good
news: Earth and most species survived. The bad news: it took millenia
to recover from the episode, when temperatures rose by 5 to 8 degrees
Celsius (9 to 15 degrees Fahrenheit)...."
The
rate at which carbon emissions warmed Earth's climate almost 56 million
years ago resembles modern, human-caused global warming much more than
previously believed, but involved two pulses of carbon to the
atmosphere, University of Utah researchers and their colleagues found.
Read more at:
http://phys.org/news/2014-12-global-similar-today-size-duration.html#jCp
A Single Word In The Peru Climate Negotiations Undermines The Entire Thing. Here's a clip from a story by Eric Holthaus at
Slate: "..
.In the final version of the text,
developing countries largely got their way—including language
referencing a temperature rise of just 1.5°C above pre-industrial
levels, a target so ambitious that it would likely require a
single-minded global focus—but one key word
related to international oversight of the emissions reductions
plans was changed from "shall" to "may" at the request of China. Had the
re-write not occurred, a leaked strategy document showed a coalition of
some influential developing countries, including India, were prepared to scrap the entire agreement..."
* The final U.N. statement from Lima, Peru is
here.
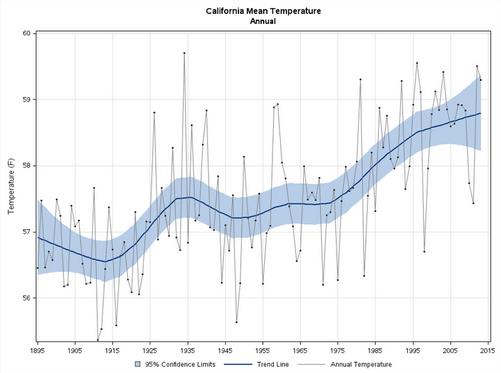
We Could See More And More "Hot Droughts" Like California's. Here's an excerpt from an interesting read at
FiveThirtyEight: "...
But
it’s not merely low precipitation levels that make the current drought
extraordinary, Griffin said. It’s also exceptionally hot temperatures.
California’s dry spell qualifies as a “hot drought,”
where high temperatures evaporate whatever moisture is trying to make
its way into the soil. The researchers calculated that record-high
temperatures may have exacerbated drought conditions by about 36
percent. (The chart [above] is based on California temperature data from
NOAA.)..."
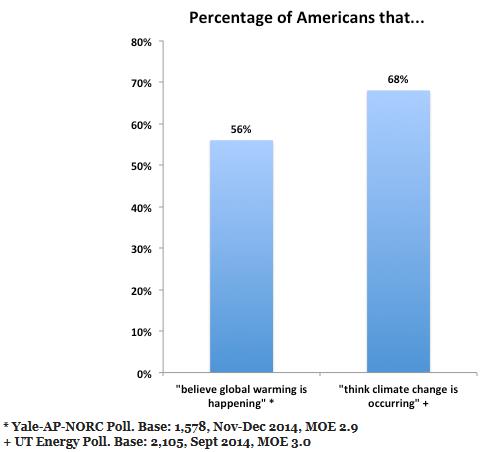
"Climate Change" or "Global Warming?" Two New Polls Suggest Language Matters. Here's an excerpt from a blog post at
Scientific American: "..
.Several academic studies have attempted to measure whether there is a difference in how we perceive
or respond to “climate change” and “global warming” with mixed results.
Poll responses can also be influenced by where a question appears in a
survey and several other factors. Still, we do know Democrats and
Republicans certainly use these terms differently...."
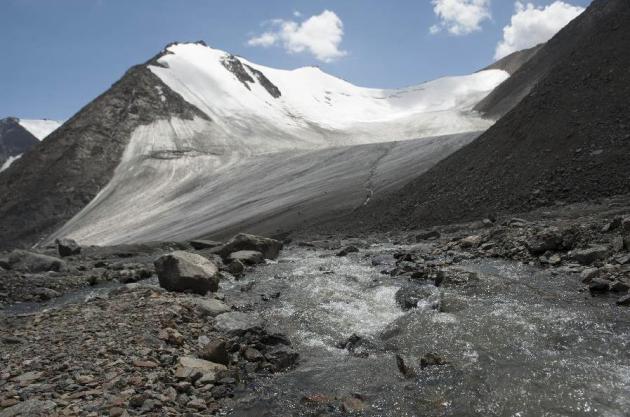
China's Glaciers Shrink By 18 Percent In Half Century. China's media outlet,
Xinhua, has the story - here's the introduction: "
China's
glaciers have retreated by about 7,600 square km, an 18 percent retreat
since the 1950s, Chinese scientists have found. A survey using remote
sensing data between 2006 and 2010 showed China had 48,571 glaciers
covering 51,840 square km in the west region, according to the Chinese
Academy of Sciences (CAS), which released its second catalog of the
country's glaciers on Saturday. An average of 243.7 square km of glacial
ice had disappeared every year over the past half century, according to
the survey by the CAS Cold and Arid Regions Research Institute..."
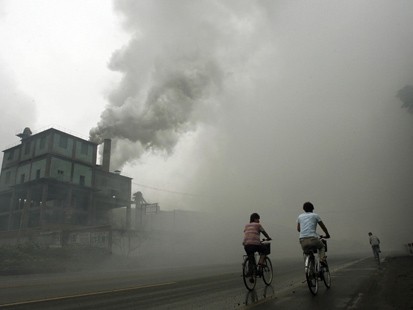
How The "War on Coal" Went Global.
Politico has the story - here's a snippet: "...
Just
a few years ago, domestic producers had high hopes for selling coal to
energy-hungry Asia, but prices in those markets are plummeting now amid
slowing demand and oversupply, ceding much of the market space to
cheaper coal from nations like Indonesia and Australia. Meanwhile, a lot
of U.S. coal can’t even get out of the country, thanks to greens’
success in blocking proposed export terminals in Washington state and
Oregon. And China, the world’s most voracious coal customer, just pledged to cap its use of the fuel and is promising to curb its greenhouse gas pollution..."
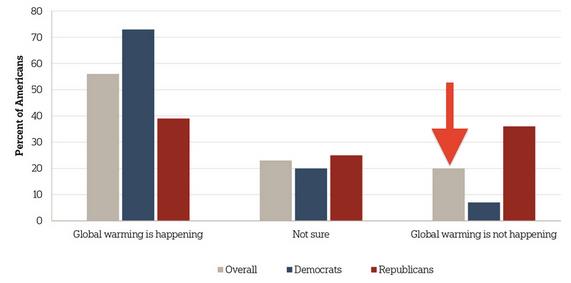
Whaaat? 20 Percent of Americans Still Don't Believe in Global Warming.
I'm not a fan of the word "believe", as if there's something subjective
to talk about here. It's more acknowledging the mountains of scientific
evidence, and avoiding conspiracy theories. Here's a clip from
Fusion which provides a little perspective: "...
Some experts suggest that
most global warming or climate change deniers cannot or will not accept
scientific findings because of closely held ideological or
religious beliefs. It’s also worth pointing out that 36 percent of
Americans believe in UFOs, and that 15 percent of U.S. voters say the government or the media adds mind-controlling technology to TV broadcast signals..."
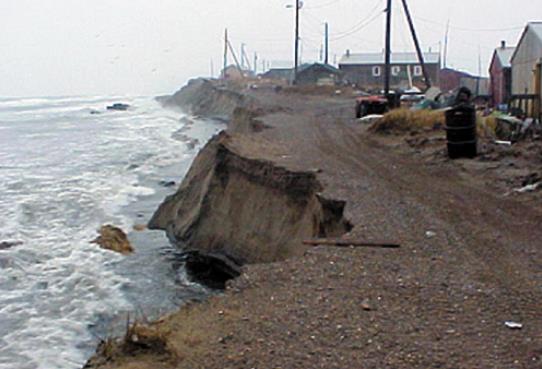
Climate Change Takes a Village. Huffington Post has the article; here's an excerpt: "...
The
remote village of 563 people is located 30 miles south of the Arctic
Circle, flanked by the Chukchi Sea to the north and an inlet to the
south, and it sits atop rapidly melting permafrost. In the last decades,
the island's shores have been eroding into the sea, falling off in
giant chunks whenever a big storm hits. The residents of Shishmaref,
most of whom are Alaska Native Inupiaq people, have tried to counter
these problems, moving houses away from the cliffs and constructing
barriers along the northern shore to try to turn back the waves. But in
July 2002, looking at the long-term reality facing the island, they voted to pack up and move the town elsewhere..." (File image of Shishmaref: NOAA).


More than 100 East and Gulf Coast cities with populations over 100,000 and their suburbs face destruction by rising sea levels projected by the IPCC,,FEMA and the EPA to be 2 feet by 2050 and 2 meters.by 2100.Ultimately and inevitably the flooding, which is increasing at an increasing rate, will reach 60 meters and whole states such as Delaware, New Jersey,Florida and Louisiana will be lost unless relocated.
ReplyDelete