25 F. average high on December 25.
28 F. high on December 25, 2013.
1990: Much of central Minnesota set record low temperatures near 30 degrees Fahrenheit below zero, while others had lows in the teens below zero. Cambridge had the coldest temperature with 31 below. Mora was close behind, with a low of 30 below. Other notably cold lows were at St. Cloud, with 29 below, and Melrose and Menomonie, WI with 27 below.
An Oddly Cool Year
While the vast majority of the planet, land and oceans, is in the midst of the warmest year on record, Minnesota is experiencing the coolest year since 1996. That's one of a handful of 2014 weather headlines posted at the Minnesota DNR. Other oddities this year: only 23 Minnesota tornadoes, well below average - the wettest June, statewide, in Minnesota history - the deepest snow depth since 1982 (24 inches on February 21, 2014) - and a polar winter to remember with 53 subzero nights in the Twin Cities; the 5th most ever recorded. Feeling sorry for yourself? International Falls had 92 subzero nights, tying 1977-78 for the most ever.
The cool, wet bias may not spill over into 2015 with an El Nino warming of the Pacific expected to linger much of next year.
And our premature January Thaw will give way to a rude reality check next week. The approach of colder air squeezes out an inch or two Saturday; by Tuesday and Wednesday morning temperatures may flirt with zero in the suburbs.
So please avoid the suburbs.
My strong hunch: the next few months will in no way resemble last winter. I see more Pacific, less polar. Real storms with heavy snow may be fairly rare.
Place your bets.
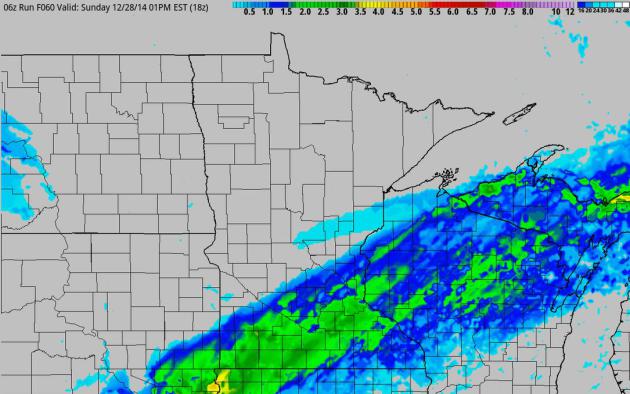
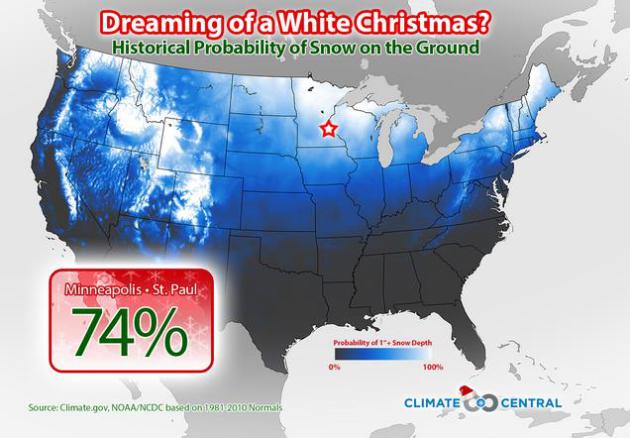
December Shocker: Snow. There's a good chance we'll wind up wiith a couple inches of snow tonight and early Saturday as a weak storm ripples along an advancing cold front; the best chance of 3" south and east of the Twin Cities. We've only picked up 1.4" snow so far in December, so it's possible tonight's snowfall may qualify as the "biggest snowfall of December". Kind of pathetic. 4 km. accumulated snow map: NOAA NAM and HAMweather.
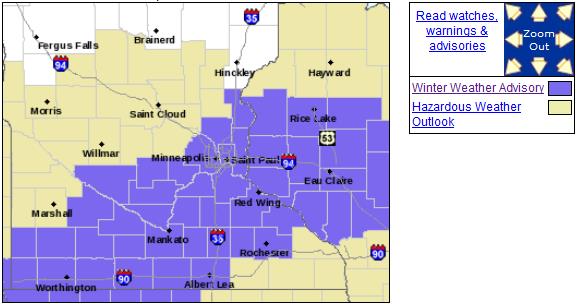
Winter Weather Advisory Tonight. A white Saturday-After-Christmas? Not quite the same thing, but at this point we'll take whatever snow we can muster. NOAA has much of southern and east central Minnesota and a big chunk of Wisconsin under an advisory. Details:
THE NATIONAL WEATHER SERVICE IN TWIN CITIES/CHANHASSEN HAS ISSUED
A WINTER WEATHER ADVISORY FOR SNOW...WHICH IS IN EFFECT FROM 6 PM
THIS EVENING TO 9 AM CST SATURDAY.

* TIMING...SNOW WILL RAPIDLY SPREAD ACROSS THE AREA BETWEEN 6PM AND
  9PM TONIGHT AND TAPER OFF EARLY SATURDAY MORNING.

* MAIN IMPACT...3 TO 5 INCHES OF SNOW...WITH LOCALLY HIGHER
  AMOUNTS NEAR 6 INCHES POSSIBLE.

* OTHER IMPACTS...DRIVING CONDITIONS WILL BECOME DIFFICULT AS
  ROADS BECOME SNOW COVERED.
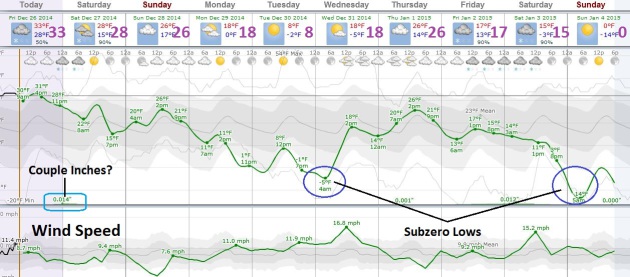
Double Dip. The rumors are true: we are about to cool off; a few days in the teens next week, with the best chance of negative numbers next Wednesday morning, again Sunday, January 4. Canadian air surges south like waves breaking on the beach. The beach. What a wonderful idea.
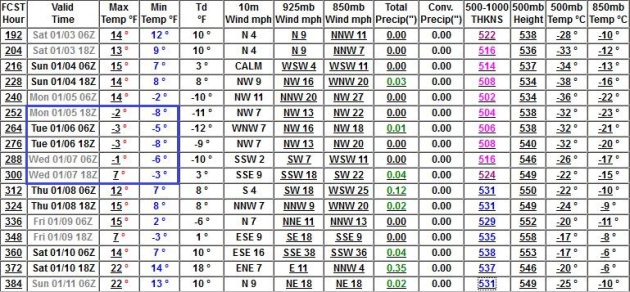
Numb, But Not Persistently Polar. GFS guidance shows a subzero spell around January 5-7, with temperatures warming back into the 20s for much of the second week of January. We'll see, but I see no evidence of the Polar Express, a persistent blocking pattern of Arctic air flowing steadily south, similar to what we endured last winter.
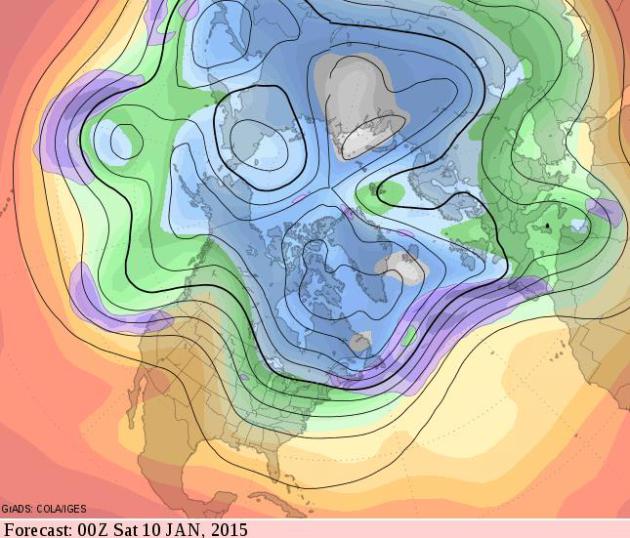
Over The Horizon. Long-range predicted jet stream winds (GFS) show a west/northwest flow aloft; cold, but not exactly polar by the second week of January. Persistent low pressure troughs pushing into the western USA prevent the ridiculously resilient ridge from reestablishing over the western USA, keeping our flow more zonal, more west to east, than Arctic. Credit: GrADS:COLA/IGES.
#2 Record Wet June
June 2014 was the wettest June and the wettest month of the modern record for Minnesota. The state-averaged monthly rainfall total for June was 8.03 inches. Redwood Falls and Glencoe had 14.24 inches. The Twin Cities saw 11.36 inches, which fell just short of the June record of 11.67 inches from 1874. The impacts were flooded roads, farm fields, soggy basements and construction delays. One side benefit to the wet June was once the summer began to turn dry, plants were able to tap deep soil moisture from the June rains.
#1 The Cold Winter of 2013-14
There were many note-worthy parts of the winter of 2013-14. There were 53 nights of at or below zero temperatures in the Twin Cities. This tied for 5th place for the number of times the mercury dipped at r below zero in the Twin Cities for winters going back to 1872-73. International Falls had 92 at or below zero readings, tied 1977-78 as the most ever. Another measure was the extremely cold wind chill temperatures. The coldest wind chill temperature was -48 at the Twin Cities on January 6th and for the state it was -63 degrees at the Grand Marais Airport. The winter of 2013-14 will be one to compare to for many years to come.
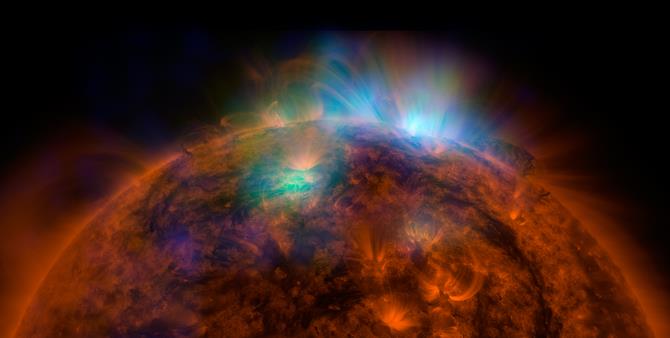
Sun Sizzles in High-Energy X-Rays. NASA has a story about a new look at the sun; here's an excerpt: "...With NuSTAR's high-energy views, it has the potential to capture hypothesized nanoflares -- smaller versions of the sun's giant flares that erupt with charged particles and high-energy radiation. Nanoflares, should they exist, may explain why the sun's outer atmosphere, called the corona, is sizzling hot, a mystery called the "coronal heating problem." The corona is, on average, 1.8 million degrees Fahrenheit (1 million degrees Celsius), while the surface of the sun is relatively cooler at 10,800 Fahrenheit (6,000 degrees Celsius). It is like a flame coming out of an ice cube. Nanoflares, in combination with flares, may be sources of the intense heat..."
Image credit above: "X-rays stream off the sun in this image showing observations from by NASA's Nuclear Spectroscopic Telescope Array, or NuSTAR, overlaid on a picture taken by NASA's Solar Dynamics Observatory (SDO)." Image Credit: NASA/JPL-Caltech/GSFC.


TODAY: Shocker: cloudy and drab. North 10. High: 33
FRIDAY NIGHT: Winter Weather Advisory. Accumulating snow; 1-3", more south/east of MSP. Low: 25
SATURDAY: Snow tapers to flurries Slick roads possible. High: 27
SUNDAY: Cold and gray. Good travel weather. Wake-up: 18. High: 25
MONDAY: Peeks of sun, colder wind. Wake-up: 14. High: 17
TUESDAY: Winter relapse. Lot's of clouds. Wake-up: -3. High: 11
WEDNESDAY: Some sun, feels like -10. Wake-up: -1. High: 16
THURSDAY: White New Year? Light accumulation of snow? Wake-up: 8. High: 21
Climate Stories...
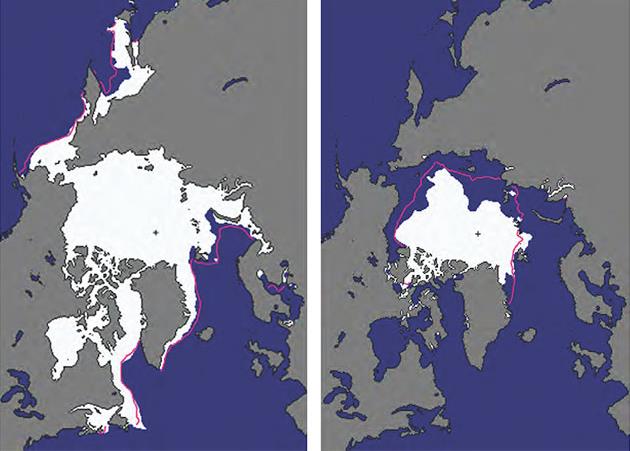
4 Signs The Arctic Is Getting Baked By Climate Change. Here's an excerpt from a post at Mother Jones and billmoyers.com: "...The 2014 summer sea ice minimum — a snapshot taken when sea ice is at its lowest — was 23 percent below the 1981-2010 average, a loss of ice 2.6 times greater than the total area of California. In the map below, the minimum (which happened in September) is on the right; the pink outline shows the average. The winter maximum, on the left, was also below average, by about 5 percent..."
Graphic credit above: "Arctic sea ice extent in the winter maximum (left) and summer minimum (right) were both below average (pink line) in 2014." (Graphic: NOAA)
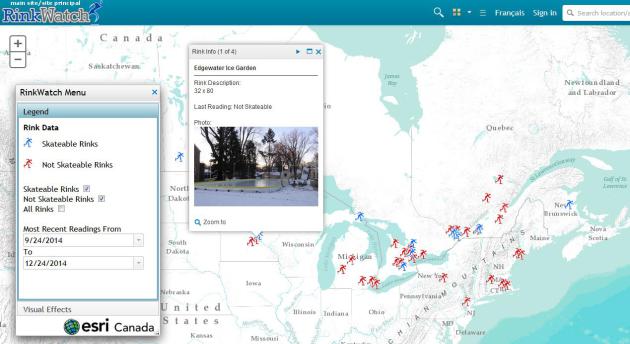
Map above: rinkwatch.org.
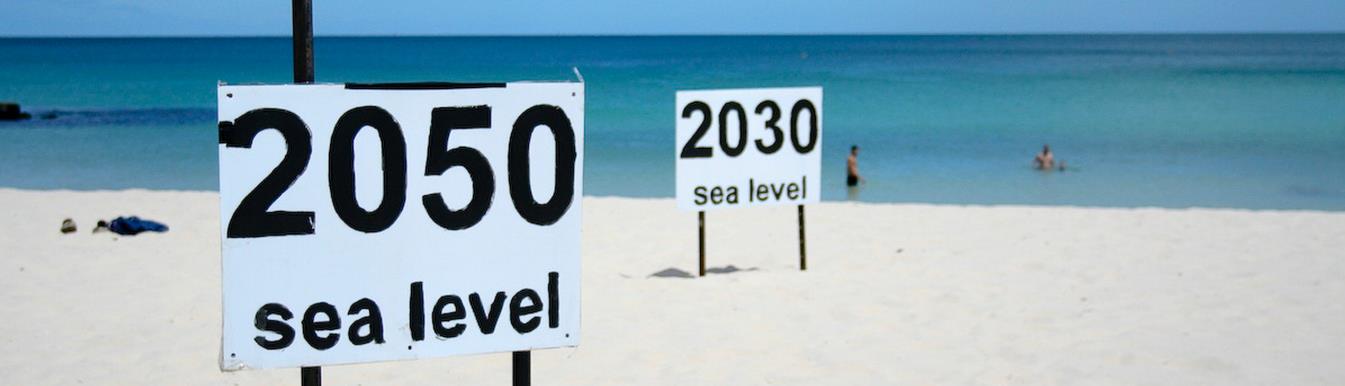
These U.S. Cities Have Already Passed a Climate Change "Tipping Point". Tipping point is defined as at least 30 days a year of "nuisance flooding" or worse. Here's an excerpt from Vice News: "...Wilmington, North Carolina; Annapolis, Maryland; and Washington, D.C. have already passed their tipping points. From 2006 through 2010, for example, Annapolis experienced an average of 34.4 nuisance days a year, compared to an average 2.8 such days from 1956 through 1960. Of the 23 other cities surveyed, 17 are expected to pass their tipping points by 2050...."

No comments:
Post a Comment