5 F. high in St. Cloud Tuesday.
21 F. average high on January 19 (up 1 degree from yesterday, the first rise in average temperatures since late July)
35 F. high on January 19, 2015.
January 20, 1982: Just over 17 inches of snow falls in the Twin Cities. Amazingly, it was to be outdone two days later.
January 20, 1917: 16 inches of snow falls in the Twin Cities. Source: MPX National Weather Service.
Cold Perspective: No Volcanic Ash in 7-Day Outlook
Perspective is elusive, especially when you're in a tight spot. Our weekend cold wave was noteworthy, coming after a balmy autumn and start to winter. Tuesday was our 9th subzero morning. During an average winter we enjoy 22.5 nights below 0F. So far 126 hours below zero this winter at MSP.
At least there are no active volcanoes upwind. Susie Martin is a meteorologist at Aeris Weather. Her mom.
lives in San Jose, Costa Rica, one of the greenest, lushest, most desirable spots on Earth. But the Poas Volcano keeps sputtering nearby, raining down a continuous drizzle of ash that gets everywhere.
"You have no idea how bad the air is today. The volcano erupted again and there is ash everywhere.
The airport is closed again!" Elisa Martin e-mailed.
So we have that going for us.
While the east coast freaks out over Snowmageddon, The Sequel (some 1-2 foot snow amounts possible this weekend) Minnesota's weather remains relatively tranquil. An inch of snow is possible late Thursday; highs hit 30F from Saturday into most of next week.
A modest warming trend - and no volcanic ash in sight.
* Photo credit of Poas Volcano in Costa Rica courtesy of AerisWeather meteorologist Susie Martin.
Image credit above: "Every El Nino is different, but they tend to produce above-average precipitation during the winter months across parts of the United States as well as Alabama." (Climate.gov).
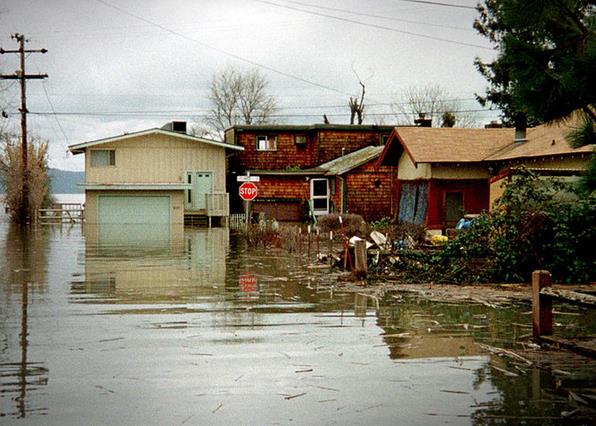
Unusual El Nino Weather May Increase Risk of Water Damage to Homes This Winter. A different angle in this story at Yahoo News; here's a clip: "...Winter
is already a challenging season for many homeowners, but the moisture
from El Niño will likely create additional headaches this year," said
Paul Quinn, head of claims customer experience at Farmers Insurance.
"This year's unique weather conditions mean we may see hazards like
flooding and power outages combine with more traditional winter hazards,
like ice dams and frozen pipes, as major concerns for homeowners." El
Niño, which is characterized by unusually warm temperatures in the
Pacific Ocean, is expected to create wetter-than-average conditions in
the South, the Mid-Atlantic and southern portions of New England, as
well as in California, Texas and Florida. Homeowners in these areas will
likely have to contend with an increased risk of flooding, water damage
and power outages..." (File photo: Dave Gatley, FEMA).

10 Billion Dollar Weather and Climate Disasters in 2015. Here's an excerpt from NOAA: "...The U.S. has sustained 188 weather and climate disasters since 1980 where overall damages/costs reached or exceeded $1 billion (including CPI adjustment to 2015). The total cost of these 188 events exceeds $1 trillion. In 2015, there were 10 weather and climate disaster events with losses exceeding $1 billion each across the United States. These events included a drought event, 2 flooding events, 5 severe storm events, a wildfire event, and a winter storm event. Overall, these events resulted in the deaths of 155 people and had significant economic effects on the areas impacted. The 1980–2015 annual average is 5.2 events (CPI-adjusted); the annual average for the most recent 5 years (2011–2015) is 10.8 events (CPI-adjusted). Further cost figures on individual events in 2015 will be updated when data are finalized..."
59 Cold Facts About Winter. Here is a link to the site referenced in the column, Random History.com, with a few factoids that made me do a triple-take:
- The Southern Hemisphere typically has milder winters than the Northern Hemisphere. This is because the Southern Hemisphere has less land and a more maritime climate.
- While it seems counterintuitive, Earth is actually closest to the sun in December, even though winter solstice is the shortest day of the year.
- According to the Guinness World Records, on January 28, 1887, a snowflake 15 inches wide and 8 inches thick fell in Fort Keogh, Montana, making it the largest snowflake ever observed. (Image credit: NOAA).
Photo credit above: "Solar panels sit in an array at the Southwick Estate Solar Farm, operated by Primrose Solar Ltd., near Fareham, U.K., on Friday, Oct. 2, 2015. The plant, situated in 200 acres (81 hectares) of farmland, consists of 175,000 monocrystalline PV modules and has a capacity of 48 megawatts." Photographer: Simon Dawson/Bloomberg.

New York City To Get $176 Milllion from U.S. for Storm Protection. Details via The New York Times: "New
York City may soon be one step closer to building a new flood
protection system around Lower Manhattan to guard against another storm
like Hurricane Sandy. Senator Chuck Schumer,
a Democrat, said on Monday that the city would be awarded $176 million
in federal funding for the proposed project, through a national contest
created by the Department of Housing and Urban Development to help communities recover from disasters and better prepare for them..."
Image credit above: "A rendering of a city proposal to protect against flooding in Lower Manhattan from another storm like Hurricane Sandy."
Map credit above: "Blue: Alcohol is not prohibited. Red: Alcohol is prohibited. Yellow: Some alcohol controls/alcohol prohibited in some municipalities." Data from March 2012. (Photo: Public Domain/Wikipedia Commons).
TODAY: Mostly cloudy, "milder". Winds: S 5-10. High: 23
WEDNESDAY NIGHT: Patchy clouds. Low: 23
THURSDAY: Coating to 1" of snow possible. Winds: N 5-10. high: 25
FRIDAY: Better chance of seeing the sun. Winds: NW 5-10. Wake-up: 14. High: 22
SATURDAY: Mostly cloudy, trending milder. Winds: S 10-20. Wake-up: 15. High: 29
SUNDAY: Dripping icicles, thawing out. Winds: SE 3-8. Wake-up: 21. High: 32
MONDAY: Cooler, dusting of flurries? Wake-up: 26. High: 29
TUESDAY: Some sun, above "average". Wake-up: 18. High: near 30
Climate Stories...
3rd Annual Minnesota Climate Adaptation Conference on January 28. If your state agency or business is already seeing impacts from a more volatile climate you should consider attending - a few spots are still available. Here's more information on who, what, where and why from Dr. Mark Seeley:
"We are trying to nurture an educated community of practitioners when it comes to climate adaptation and sustainability, and we are slowly succeeding. In past statewide conferences we have heard from a number of academic researchers and government practitioners concerning sustainability strategies and procedures that give consideration to climate change, but this year we will hear more from the business and corporate community (morning plenary session on climate adaptation and sustainability), as well as a panel of city mayors in the afternoon plenary session.
The CAP Conference will take place on January 28, 2016 at the Doubletree Hotel in Brooklyn Center, MN. Many of the presentations and discussions will center on the need for sustainability as an underlying principle when it comes to considerations of climate change and how it will affect management of our natural resources, our societal infrastructure, and the future of products and services from the highly competitive corporate world This would be a valuable discussion for our wider community to hear, and perhaps even foster some closer working relationships among the partnerships of practitioners we are trying to build."
More information and a link to online registration is here.

Church of England and New York State Fund to Press Exxon on Climate Change. Here's the intro to a Wall Street Journal story: "New York’s state pension fund and the Church of England, both investors in Exxon Mobil Corp. , plan to file a shareholder resolution demanding the largest U.S. oil company assess the impact on its business of climate change policy. The shareholder resolution would require Exxon to conduct an assessment of how its business would fare in the event governments take various actions to limit global warming. Government attempts to tax or put a price on carbon, for example, could affect the viability of some of Exxon’s long-term investment plans, said Edward Mason, head of responsible investing for the Church of England, which has a portfolio of about £10 billion ($14.44 billion)..."
Photo credit above: "A view of the Exxon Mobil refinery in Baytown, Texas." Photo: Reuters.
Illustration credit above: "Pacific and Atlantic meridional sections showing upper-ocean warming for the most recent complete decade. Red colors indicate a warming (positive) anomaly and blue colors indicate a cooling (negative) anomaly." (Source: Timo Bremer/LLNL)
* More perspective on the massive amounts of heat going into the world's oceans at Discovery News.
NPS Drone Checks Arctic Ice Loss. The Monterey Herald has an interesting story about new technologies being deployed to monitor ice loss; here's the intro: "When
you are flying a drone over the Arctic ice cap you need warm clothing
and armed sentries to ward off prowling polar bears. Naval Postgraduate
School polar meteorologist and professor Peter Guest spent more than 40
days late last year as the only scientist from NPS in a group from the
U.S. and other countries researching the region’s receding ice cover.
It’s a part of the world the United States and other nations are showing
great interest in. Russia renewed its claim to a United Nations
committee on the Arctic, a region potentially rich in mineral resources,
which the U.S., Canada, Denmark and Norway are also laying claim to..."
Photo credit above: "Naval Postgraduate School polar meteorologist and professor Peter Guest works with a drone in the arctic." Photo by Byron Blomquist.
What's Melting Greenland's Ice Sheet? Night Clouds, say Scientists.
Clouds keep daytime temperatures cooler, but result in warmer nights,
trapping additional radiation near the ground. Here's an excerpt from Christian Science Monitor: "Clouds play an important role in melting Greenland’s ice sheet, say scientists. A
team of scientists from the University of Leuven in Belgium have found
that clouds are raising the temperature of the Greenland Ice Sheet by up
to 3 degrees, contributing to almost 30 percent of the sheet’s
melting, according a study published Tuesday in the journal Nature
Communications..."
Photo credit above: "Heimdal
Glacier in southern Greenland is seen in a NASA image captured by
Langley Research Center's Falcon 20 aircraft October 13 and released
November 24. NASA's Operation IceBridge North is an airborne survey of
polar ice aimed at learning how much snow and ice disappeared over the
summer, according to a NASA news release." John Sonntag/NASA/Reuters.
What History Gives, the Sea Steals.
Stronger storms and higher sea levels are eroding the coastline of
Scotland, creating a new set of challenges for archeologists. Here's an
excerpt from Hakai Magazine: "...Natural
coastal erosion is a long-standing problem in Scotland and the rest of
the United Kingdom, especially on sandy shorelines. But climate change
is generally expected to bring more of the severe storms that can tear
off whole chunks of the coast at once. Rising sea levels, too, mean the
waves during those storms can reach farther inland, eating the shore
away faster. “Climate change has the potential to make an existing
problem worse,” Dawson says. When intense storms pummel the coasts, they
often lay bare structures—like those at Meur—that were previously
hidden..."
Photo credit above: "The Meur burnt mound in situ on the shore of Sanday." Photo courtesy of SCAPE/University of St Andrews
Image credit above: Shutterstock.
Here's Why Satellites Aren't The Best Way to Measure Global Temperature Trends. Here's the intro to a Guardian article at Raw Story: "Satellites don’t measure the Earth’s temperature. Senator Ted Cruz (R-TX) and his fellow climate contrarians love the satellite data, but as Carl Mears of the Remote Sensing Systems (RSS) satellite dataset and Ben Santer recently wrote ,
they are not thermometers in space. The satellite [temperature] data … were obtained from so-called Microwave Sounding Units ( MSUs ), which measure the microwave emissions of oxygen molecules from broad atmospheric layers. Converting this information to estimates of temperature trends has substantial uncertainties.Scientists process the raw microwave data, applying a model to make numerous adjustments in order to come up with a synthetic estimate of the atmospheric temperature..." (Image above: NOAA).
How Reliable are Satellite Temperatures? Here's a link to a YouTube video from Yale Climate Connections: "We often hear from climate deniers that satellite measurements of global temperature are "the best data we have"? But is that true? Here, interviews with leading climate scientists, including Carl Mears, who keeps the dataset that he says Senator Ted Cruz, and others, are misusing."
Scientists process the raw microwave data, applying a model to make numerous adjustments in order to come up with a synthetic estimate of the atmospheric temperature..."they are not thermometers in space. The satellite [temperature] data ... were obtained from so-called Microwave Sounding Units (MSUs), which measure the microwave emissions of oxygen molecules from broad atmospheric layers. Converting this information to estimates of temperature trends has substantial uncertainties.
Graph credit above: "Estimates of the temperature of the lower troposphere from satellites by RSS vs. weather balloons by NOAA (RATPAC)." Created by Tamino at the Open Mind blog.
Graphic credit: Lawrence Livermore/Nature Climate Change.
Photo credit above: "Rolling waves driven by cyclone Christian appear in the Elbe estuary near the North Sea close to Brunsbuettel, northern Germany, in 2013." (European Pressphoto Agency/Christian Charisius).
No comments:
Post a Comment