36 F. "high" temperature yesterday in the Twin Cities. That's typical for March 5.
63 F. average high on April 27.
53 F. maximum temperature on April 27, 2016.
April 28, 1994: Heavy snow falls over parts of Minnesota with 7.5 inches at Tower and 4.5 inches in the Twin Cities.
April 28, 1966: A heavy snowstorm leaves 10 inches of snow on the ground across a wide chunk of northern Minnesota.
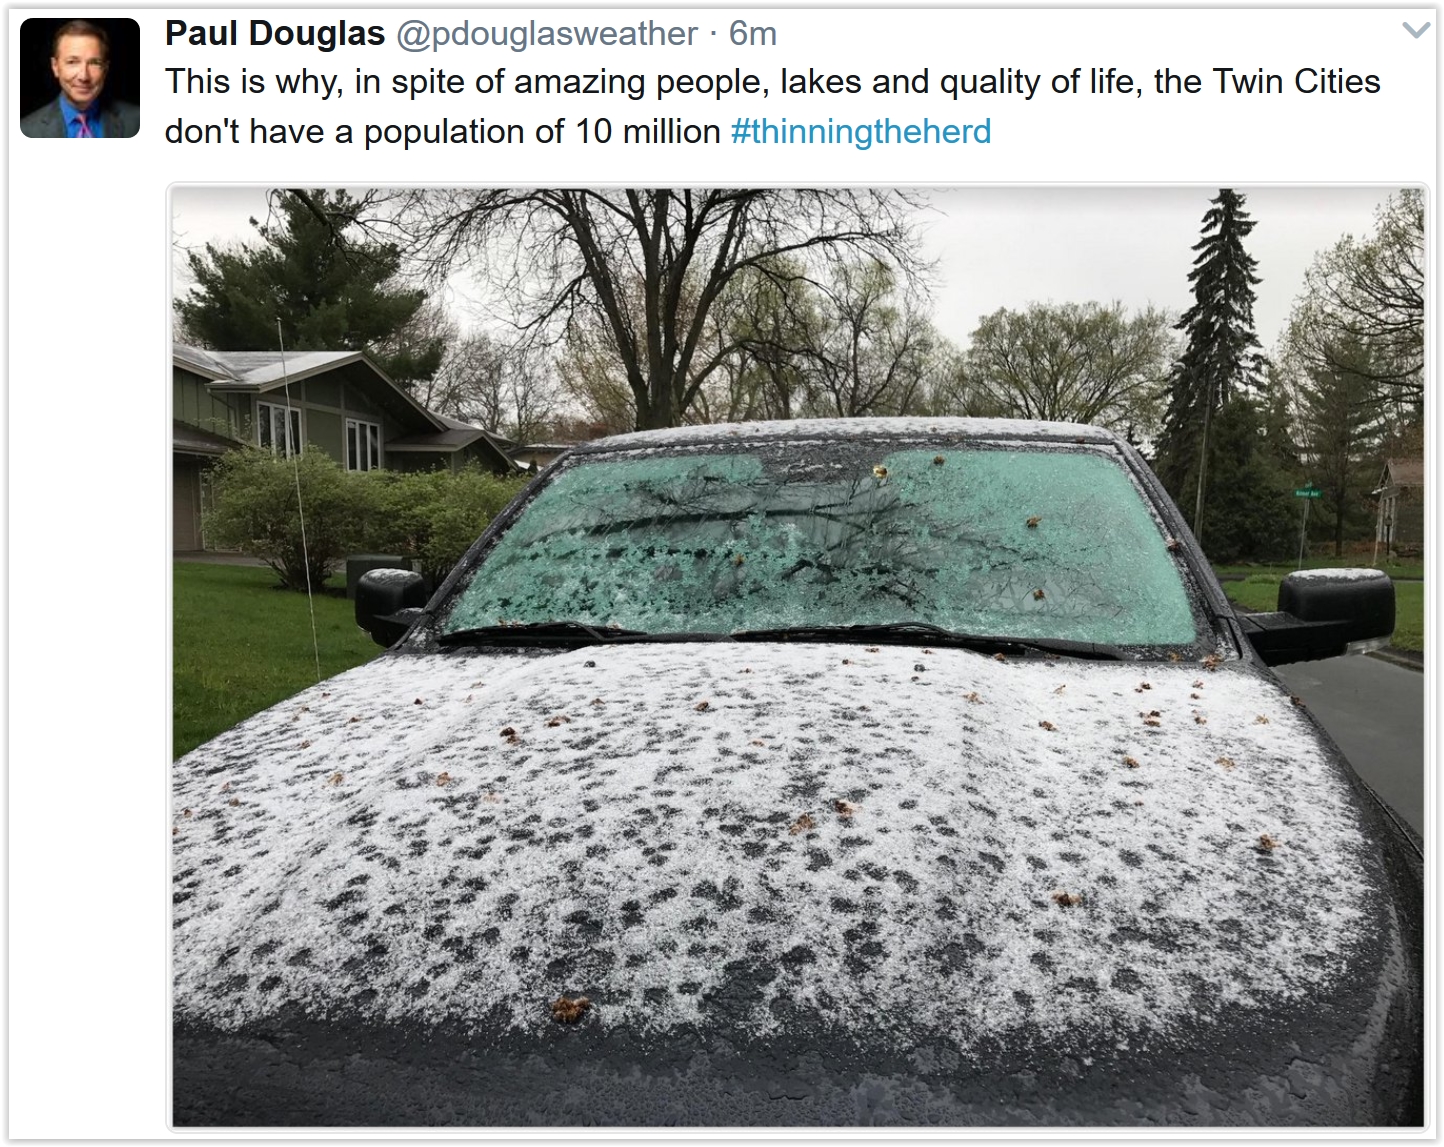 Stumbling Into Spring - Slushy Lawns on May 1?
The
weather never moves in a neat, straight line. At this latitude we
rarely "stroll into spring" It's more of a drunken stagger. Two steps
forward, one step back.
We pick up an average of 2.4 inches of
snow in April, a trace of flakes in May. The last time we picked up more
than an inch of snow in May was 1976. The reason I'm telling you this?
May 2017 may start out with an inch or two of slushy snow on lawns,
fields and dazed robins.
The details are very much up in the air,
but there's a potential for a plowable, 3-inch-plus snowfall from
Alexandria to Bemidji to Hibbing, based on the latest ECMWF (European)
model run. Oh boy.
No big worries today: the sun peeks out with
highs topping 50 degrees. Progress. Saturday still looks like the nicer,
drier, sunnier day of the weekend with mid 50s.
Models spin up a
big, sloppy southern storm Sunday, and a cold rain slowly mixes with wet
snow. Monday may illicit a chorus of primal screams. Please resist the
urge to dial 911
We are paying a very steep price for lukewarm 60s back in mid-February. Atmospheric payback is a pain.
 Historical May Snow Events in the Twin Cities.
 Yes, it may snow again late Sunday into Monday, May 1. Big gulp. Deep sigh. How unusual?
The Minnesota DNR provides perspective: "...
The
most recent measureable Twin Cities snow event was 0.5 inches on May 3,
2013. About once every 30 years or so, there is a snow event that is
enough to cover newly greened lawns and coat budding leaves. The last
time there was a snow event in May greater than an inch in the Twin
Cities was on May 2, 1976 with 1.2 inches. The most that it has snowed
in May in a single event for the Twin Cities is three inches. This has
happened on three occasions: May 20, 1892, May 1, 1935 and May 11-12,
1946."
Photo credit: "
Snow at Cross Lutheran Church, (Present Day Maplewood) May 12, 1946." Courtesy the Maplewood Area Historical Society.
European Solution.
This is from the 12z Thursday run, showing a bias toward heaviest
snowfall amounts over far western and northern Minnesota, with plowable
amounts from near Alexandria and Detroit Lakes to Bemidji and
International Falls. Place your bets. ECMWF model: WeatherBell.
NOAA GFS Solution.
The GFS model has a solution that is vaguely similar to ECMWF, but the
axis of heaviest snow is situated over central Minnesota, not far
northern counties. Again, it's WAY EARLY to speculate about amounts, but
there's now little doubt that significant snow is shaping up for Sunday
and Monday. Mayday! Mayday!
March Is Coming Late This Year.
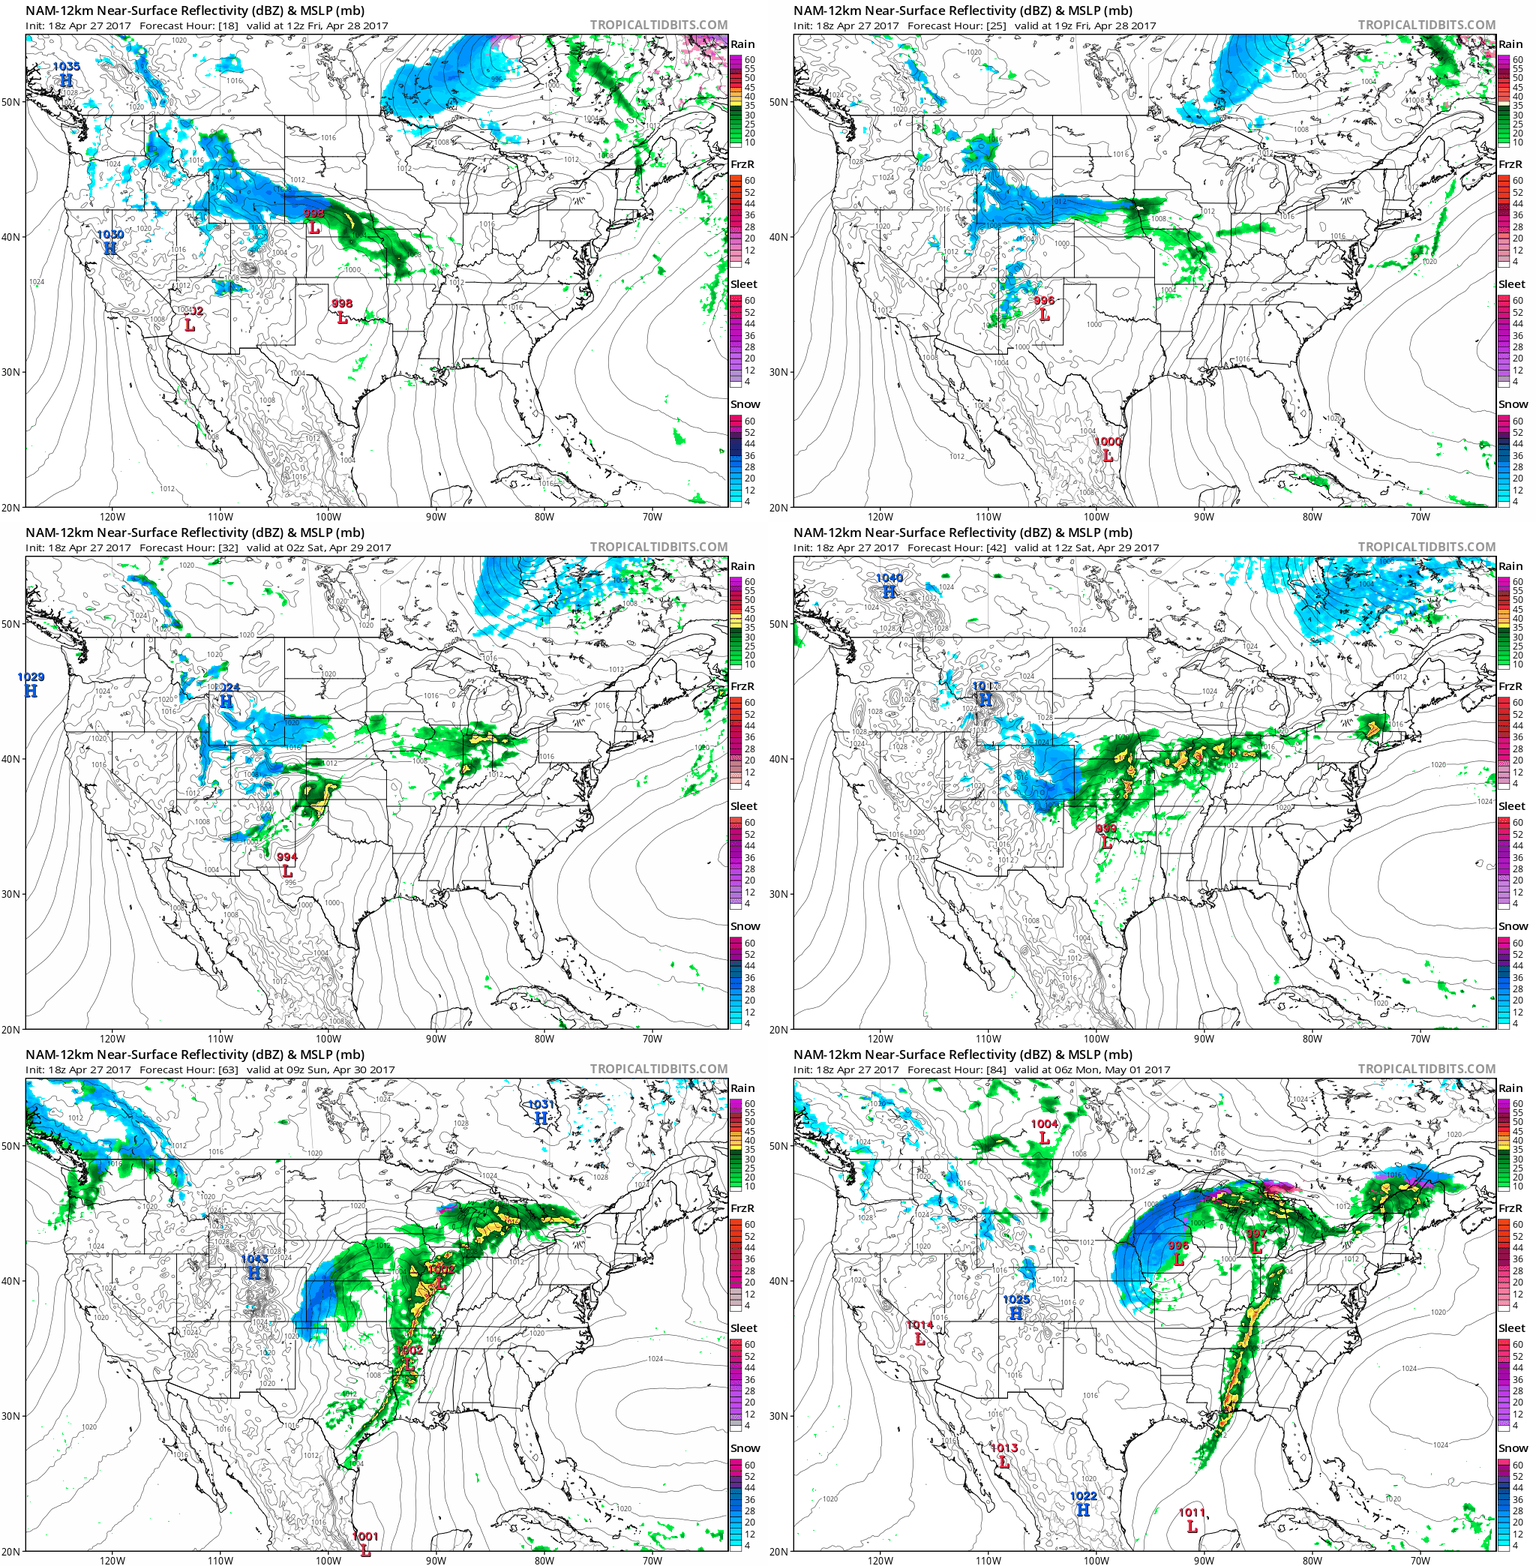
The maps really do look like something out of mid or late March,
especially Upper Midwest, where a storm approaching from the south,
brimming with Gulf moisture, may spark a cold rain changing to wet snow.
Plowable amounts of slush on May 1? Isn't this a great country! 12 KM
NAM solution: NOAA and Tropicaltidbits.com.

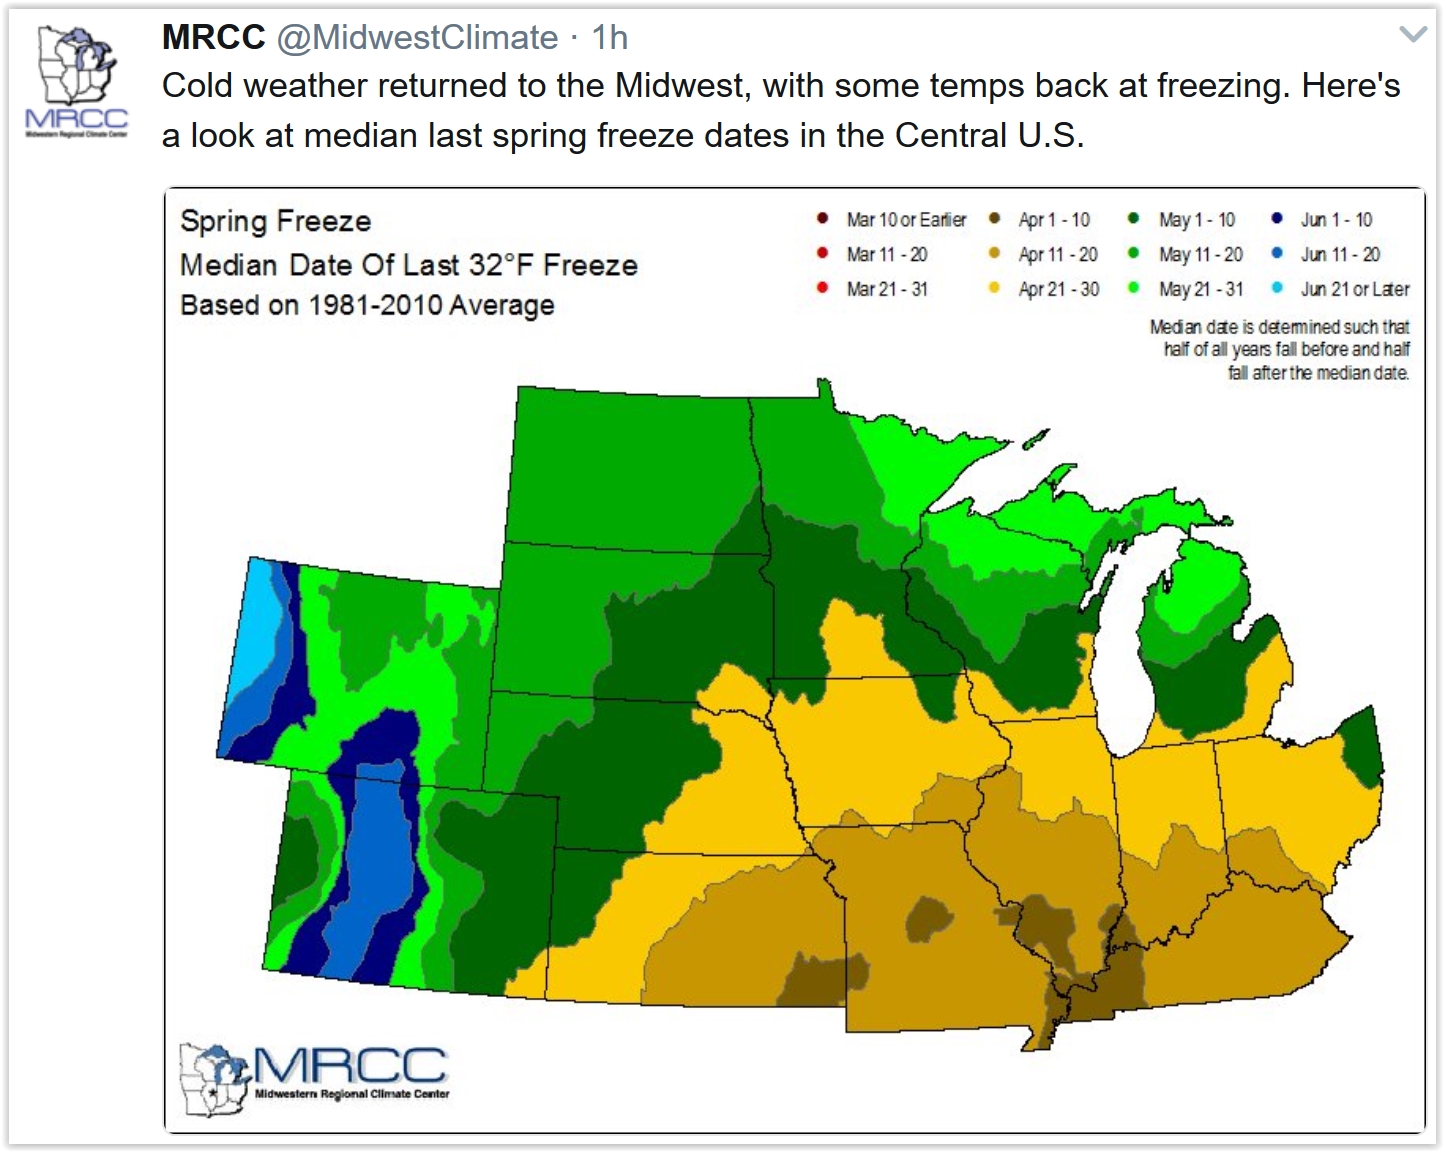 Don't Plant Annuals Until After Mother's Day.
It's tempting to get them in earlier - but don't. Here's the average
date of the last freeze (May 1-10 for much of the MSP metro), courtesy
of the Midwestern Regional Climate Center.
Spring Is Coming. Really.
After a harsh relapse Sunday and Monday, complete with snow, sleet and a
freaky February flashback, temperatures recover later next week with
60s for highs the first full weekend of May. Thank God. ECMWF numbers
for the Twin Cities: WeatherBell.
Increasingly Severe Northern USA by Mid-May.
I may be overthinking this, but if the GFS solution above verifies it
would imply a sharp temperature gradient with a series of storms
rippling along a frontal zone separating chilly air to the north from
hot, steamy air to the south. I could envision the first widespread
severe outbreaks of 2017 from the Dakotas and Upper Midwest into the
Great Lakes by the second week of May.
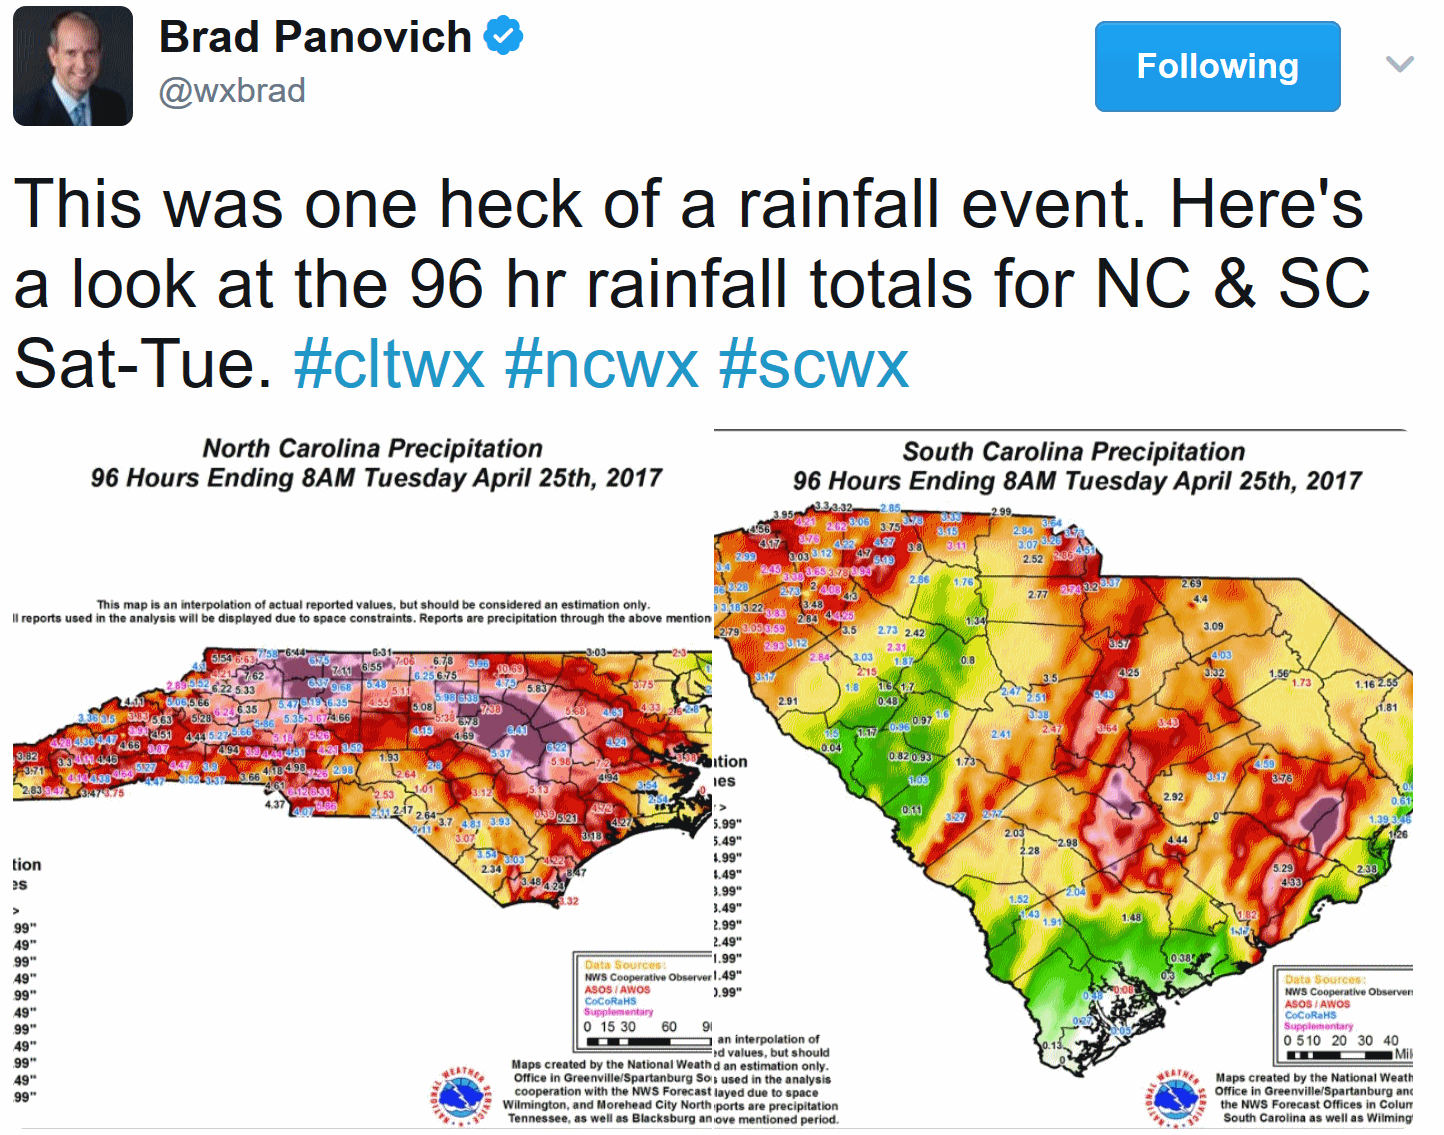 The Climate Context for Raleigh's Rains and Florida's Fires.
 Here's perspective from Andrea Thompson at
WXshift: "...
The number of heavy events has continued to be well above average over the last couple of years, maintaining the upward trend,” Ken Kunkel, a climate scientist with the North Carolina Institute for Climate Studies and N.C. State University, said in an email. A Climate Central analysis
shows that by mid-century, heavy runoff from rain-driven inland
flooding will increase between 20 and 40 percent. Of course, climate
change isn’t the only thing that impacts flooding, as the built
environment, such as impermeable pavement, exacerbates flooding in urban
areas like Raleigh. While this area of North Carolina has seen about 400 percent
of what would normally fall over the past two weeks, mostly from this
storm, much of Florida has been left thirsting for storms to quench the
dry conditions that are helping to fuel wildfires. The blazes have
burned the largest area of the state since 2011, some 115,000 acres, and will likely cost millions of dollars in damage and fire fighting costs..."
Early Look at 2017 Hurricane Season.
Praedictix meteorologist Todd Nelson takes a look at some of the things we're watching: "...
Despite
the early start to the 2017 Atlantic Hurricane Season, Colorado State
University is forecasting a slightly below average season this year.
Here's a look at the numbers, which was released on Thursday, April 6th:
Named Storms: Forecast (11) - Average (12)Hurricanes: Forecast (4) - Average (6-7)Major Hurricanes: Forecast (2) - Average (2)
The
reasoning behind the slightly below average hurricane forecast is due
to the development of a weak to moderate El Nino likely developing in
the Pacific Basin (According to NOAA). When an El Nino develops, wind
shear in the middle and upper levels of the atmosphere increases in the
Atlantic, which leads to less favorable weather conditions for tropical
development there. There is also some assumption by forecasters that
water temperatures in the Atlantic will be trending cooler than average
this year, which will may also help to keep tropical formation lower..."
Alabama and U.S. Both Above Average for Tornadoes So Far in 2017. A post at
AL.com
reminds readers how to dress for potential tornadoes and wind damage -
which makes sense, since the greatest cause for concern is flying debris
and blunt head trauma: "...
De Block again highlighted the need for
Alabamians to be prepared for all kinds of severe weather -- and that
includes having a helmet on hand for everyone in the family. "If you
haven't heard that you need to have a helmet during a tornado warned
event, then you haven't been listening because it's been preached now
for probably for six years," he said. "And I like to advise people to
dress like you're going to go biking through the woods. You don't want
to get scraped by the brush when you're driving through the woods ...
you don't want to be exiting a damaged building in your pajamas and your
bare feet..."
Graphic credit: "
According
to NOAA the U.S. has had about 100 more tornadoes than average so far
in 2017, but that doesn't mean the rest of the year will follow the same
trend." (NOAA)
Remembering the "Super-Outbreak" of April, 2011.
U.S. Tornadoes recaps those fateful, deadly days in late April, 6 years ago: "
Some
350 or so tornadoes — roughly 25 percent of which were strong/violent —
scarred the landscape from April 25-28, 2011, in what has been dubbed
the Super Outbreak of 2011. There were 321 people killed during this
period, with 316 of those deaths coming on April 27 alone. On April 27,
15 violent tornadoes
rated EF-4 or higher (including four EF-5s) struck the states of
Mississippi, Alabama, Tennessee and Georgia. Alabama was the hardest
hit, with 9 violent tornadoes touching down there, and 11 total crossing
within its boundaries. The top two deadliest tornadoes in April since modern records began hit that day. It was well advertised that an event of an unusual magnitude was on its way, with forecasters and hobbyists taking notice about a week out, and the alarm growing stronger by the day..."
Map credit: "
Tornado touchdowns in the U.S. from April 25-28, 2011." Map by Katie Wheatley.
The Aftermath: Hackleburg, Alabama.
I don't think any of us can fathom the aftermath of an EF-5 tornado.
Chris Allred put together a video that captures the horror and
resilience of one community in the aftermath of 2011's horrific tornado
outbreak. Check it out on
Vimeo: "
A
view of the aftermath of an EF5 tornado that devastated Hackleburg,
Alabama on April 27, 2011. I drove around Hackleburg to gather footage
for the Red Cross. My heart and prayers go out to all those who have
been effected from the April 27th storms. Shot with a Panasonic HPX170
in DVCPro 1080i. Most of the shots have a image stabilization effect
done in Apple Motion. Color treated in Apple Color. The song is "Gideon"
by Jason Upton from his "Live From Dublin" Album. The pad is from
"Ascend" Instrumental by Tyler England."
Why 1-Hour Lead Time May Be "Too Much" for a Tornado Warning.
Because the warning may lack the same sense of urgency, because people
may be tempted to drive to a 'safer' part of the county, with resulting
traffic jams. Dr. Marshall Shepherd takes a closer look at
Forbes: "...
The
survey revealed that the average preferred lead time was about 34.3
minutes. This is interesting because it means that we do have some work
to do in order to get to the "sweet spot" the public wants. It is also
interesting because respondents indicate that lead times in the 1 hour
range may make them less likely to respond with the same sense of
urgency. Dr. Gina Eosco, a Risk Communication Expert at Eastern Research Group, told me by direct message
The
utility of it depends on the context. Hospitals will use it.
Forecasters will use it. But the average person? My fear is they will
find something else to do. I don’t see anyone sitting in a shelter for
an hour. Perhaps we’re thinking about the purpose all wrong though. A
one hour heads up may spark awareness and more attention to the 10
minute warning....”
What's the Arctic Doing to Midlatitude Weather, and Vice Versa?
What happens in the Arctic doesn't stay in the Arctic. Rapid melting
and historic warming may already be impacting jet stream wind speeds and
amplitude over the Northern Hemisphere. Here's an excerpt of a post
from Bob Henson at
Category 6, courtesy of Weather Underground: "..
.One
thing that’s clear from the meeting is that Arctic-midlatitude linkage
is no longer a topic easily dismissed, if indeed it ever was. As
human-produced greenhouse gases heat up the planet, high latitudes have
been warming more than twice as quickly than midlatitudes and the
tropics. This phenomenon, known as Arctic amplification (AA), has been
well predicted by models. There’s also been a dramatic decrease in sea
ice extent across the Arctic, with the peak loss areas shifting in
location from winter to winter but often showing up in the seas north of
Eurasia, including the Barents and Kara. These trends were more obvious
than ever this past winter, as Arctic surface temperatures smashed records and sea ice extent hit its lowest yearly maximum on record.
But do scientists have a solid handle on how AA itself operates? That’s
one of several basic questions that made their way into the workshop
discussion. After all, heat can get into the Arctic atmosphere in a
variety of ways..."
Map credit: "
Surface
temperatures during winter (Dec – Feb) showed an increasing trend across
the Arctic Ocean and most of Canada from 1989 to 2016, but they dropped
markedly across most of northern Asia, with minor decreases over the
southeast U.S. and northern Europe." Image credit: Courtesy James Screen, adapted from “Far-flung effects of Arctic warming,” Nature Geoscience,
published online March 20, 2017.
 Republicans and Democrats Agree On One Thing: Solar Panels
. Here's a clip from
Yale Climate Connections: "
In
Washington D.C., solar energy is sometimes seen as a political issue.
But research suggests constituents – both Democrats and Republicans –
feel differently. A solar consulting company called PowerScout pulled
the addresses of one-and-a-half million political donors. Then, they
used satellite images to identify which of their homes had solar panels.
Attila Toth is CEO and Founder of PowerScout. Toth: “Across the twenty
states that we looked at, Democratic and Republican party donors
installed residential solar systems at very comparable rates...”
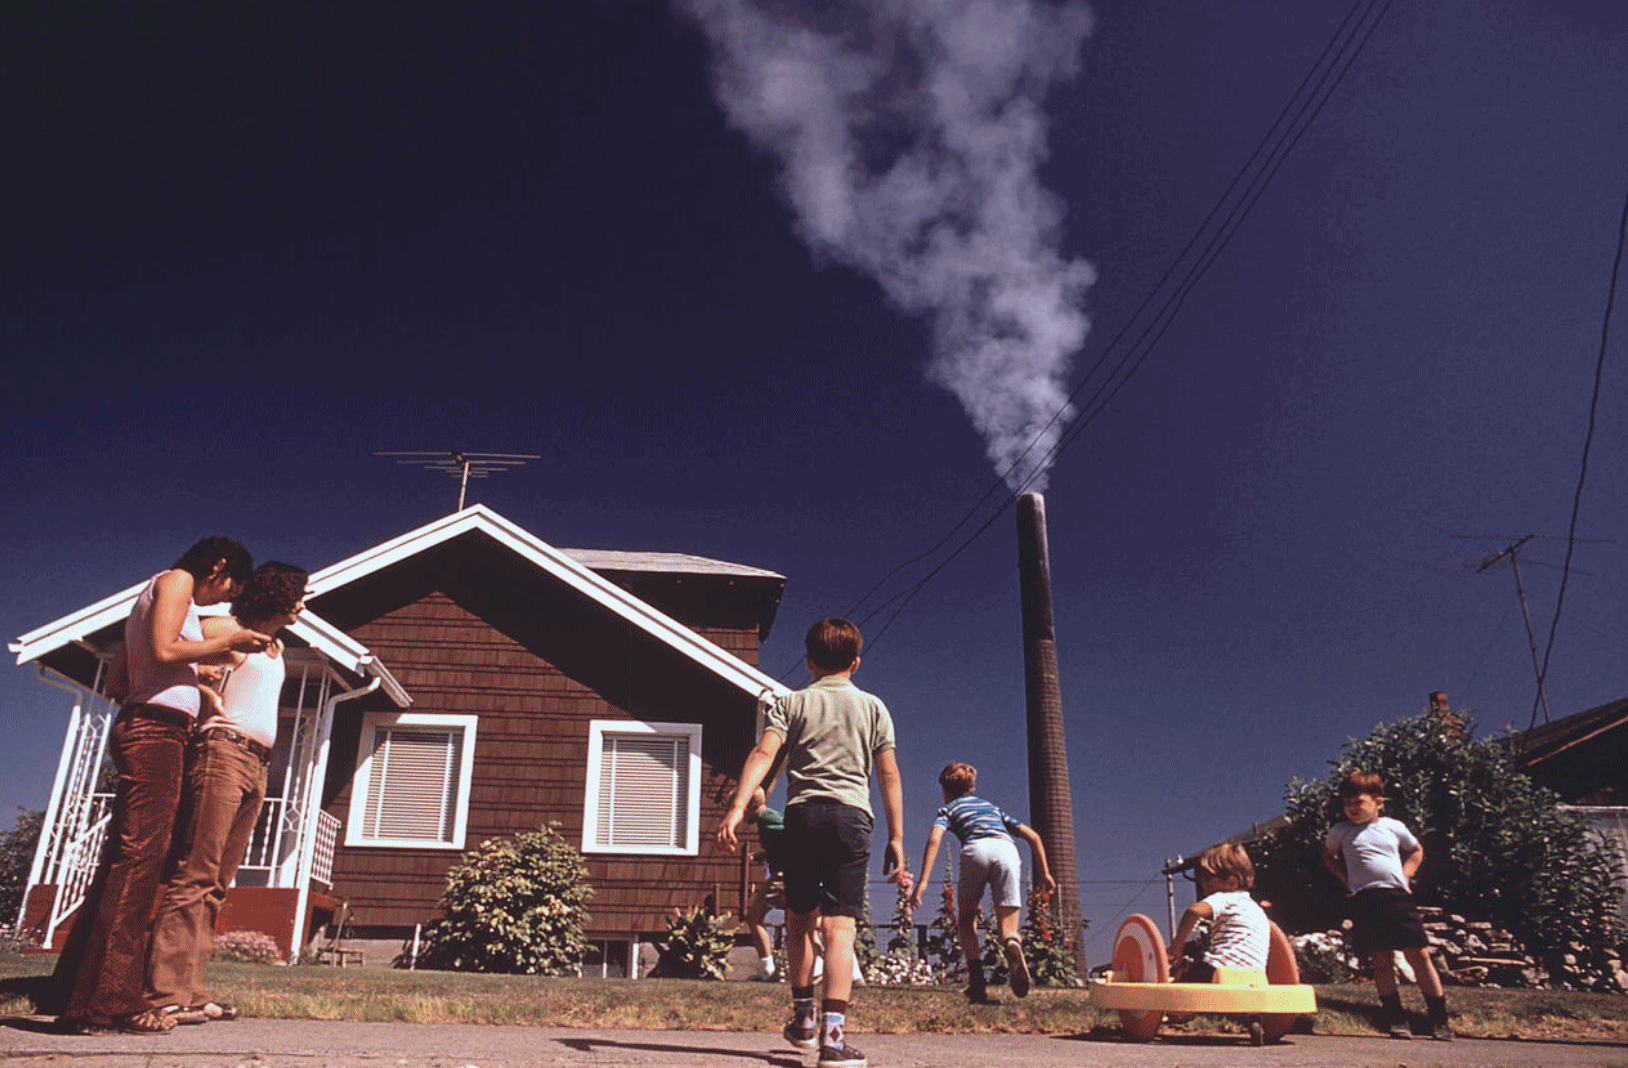 Why We Can't Just Leave Environmental Protection to the States
. That's the funny thing about pollution - it doesn't respect state boundaries. Here's an excerpt at
Grist: "...
First,
states often don’t enforce the laws within their own borders when the
people primarily harmed live downwind or downriver in another state.
States don’t want to spend their money or their political capital to
benefit other states. The federal government has the responsibility to
protect everyone — like the millions of people on the East Coast who
suffer the effects from large air polluters in the Midwest. Second, many
significant violators are national companies that operate in many
states. Individual states can’t effectively take on nationwide
operations. Filing cases one state at a time is inefficient and leads to
inconsistent results..."
File photo: Gene Daniels, U.S. National Archives.
The Electric-Car Boom is So Real Even Oil Companies Say It's Coming. Here's a clip from Bloomberg: "Electric cars are coming fast -- and that’s not just the opinion of carmakers anymore. Total SA,
one of the world’s biggest oil producers, is now saying EVs may
constitute almost a third of new-car sales by the end of the next
decade. The surge in battery powered vehicles will cause demand for
oil-based fuels to peak in the 2030s, Total Chief Energy Economist Joel
Couse said at Bloomberg New Energy Finance’s conference in New York on
Tuesday. EVs will make up 15 percent to 30 percent of new vehicles by
2030, after which fuel “demand will flatten out,” Couse said. “Maybe
even decline...”
Graphic credit: Bloomberg New Energy Finance.
 Flexible Working is Making Us Work Longer
. Really? Here's a story at
Quartz highlighting new research: "...
Contrary
to what you might expect, those with more control over their work
schedule work more than those with less control. In fact, people have a
tendency to work more overtime hours once they are allowed to work
flexibly, compared to when they were not. These were the findings of
research my colleague Yvonne Lott and I recently carried out, published in the European Sociological Review.
We examined data that followed workers across a number of years in
Germany to see what happened to the amount of overtime they did once
they started having more control over their working hours..."
Watch It While It Lasts: Our Golden Age of Television.
Financial Times takes a look at why there's so much (amazingly good) television out there right now: "..
.We
used to complain that there was never anything good on TV. Now we
complain about the opposite. Spoilt for choice as we may be, we should
not forget to be astonished that an industry once regarded as an
artistic wasteland has turned itself into the world’s most prolific
source of new stories. Whether we are in the middle or nearing the end
of television’s golden age is hard to tell. Our sense of being
overwhelmed by new shows is not illusory. According to FX Networks
research, in 2016 there were 455 original series in TV, up from 182 in
2002. Yet we haven’t necessarily reached what John Landgraf has called
“peak TV”. “We’re not seeing any slowdown in the appetite for new
content, from all kinds of buyers,” says Laura Kennedy..."
Now THAT Was Music.
Why does new music (sometimes) get on our nerves? Hey, I'm a classic
rock guy, but I just discovered a new band I really like (The 1975), but
I have to agree with the premise of an article at
Aeon: "...
For
one thing, it doesn’t happen to everyone. Musicians seem particularly
immune, for obvious reasons, and so do certain types of journalists, for
reasons touched on in the paragraph above. Still, it’s a very real
phenomenon, as real as anything that transpires in the mind. Famously,
something similar happens to us with sports, particularly spectator
sports, and at a much younger age. But no one really feels too badly
about that, because of the inherent meaninglessness of watching other
humans engage in physical activity. It’s like ruing the day you ever
stopped liking porn. But music is different. Denounce the music of the
present day, and you’ve instantly become a walking, talking, (barely)
breathing cliché, ripe for ridicule, a classic figure of parody and
invective. It doesn’t happen to everyone, but it could certainly happen
to you..."
Why Getting Fired Is Worse Than Divorce. A story at
Bloomberg raised a few eyebrows: "
It’s
just not working out” may be some of the most heartbreaking words in
the English language, leading to months of anguish, self-questioning and
sleepless nights. Even worse: when they come from your boss. Fired
employees never quite recover to the same level of well-being, a measure
that includes mental health, self-esteem and satisfaction with life,
according to data provided to Bloomberg this week from a review of more
than 4,000 research papers. Losing a job can be a sharp blow, one that
causes a bigger drop in life satisfaction than being widowed or getting
divorced, according to the review conducted by the University of East
Anglia and the What Works Center for Wellbeing, an independent body set
up by the U.K. government..."
Battery-Boosted Mountain Bikes Charge Onto the Trails. But is it still bicycling?
CNET.com has the story; here's a clip: "...
Mountain
bike innovation has been ceaseless over the decades: lightweight
aluminum or carbon-fiber frames, super-low gears to crawl up steep
hills, cushy suspension to float over bumps, disk brakes that stop you
in a moment and super-fat tires that offer a better grip. But electric
bikes don't just make riding easier, they actually do some of the work
for you. That raises the question of whether it's even biking anymore.
"I don't think it's cheating," said Monterey cyclist Chris Toplarski.
"It opens up an avenue for people who wouldn't ordinarily ride a bike.
They can go places they normally wouldn't go..."
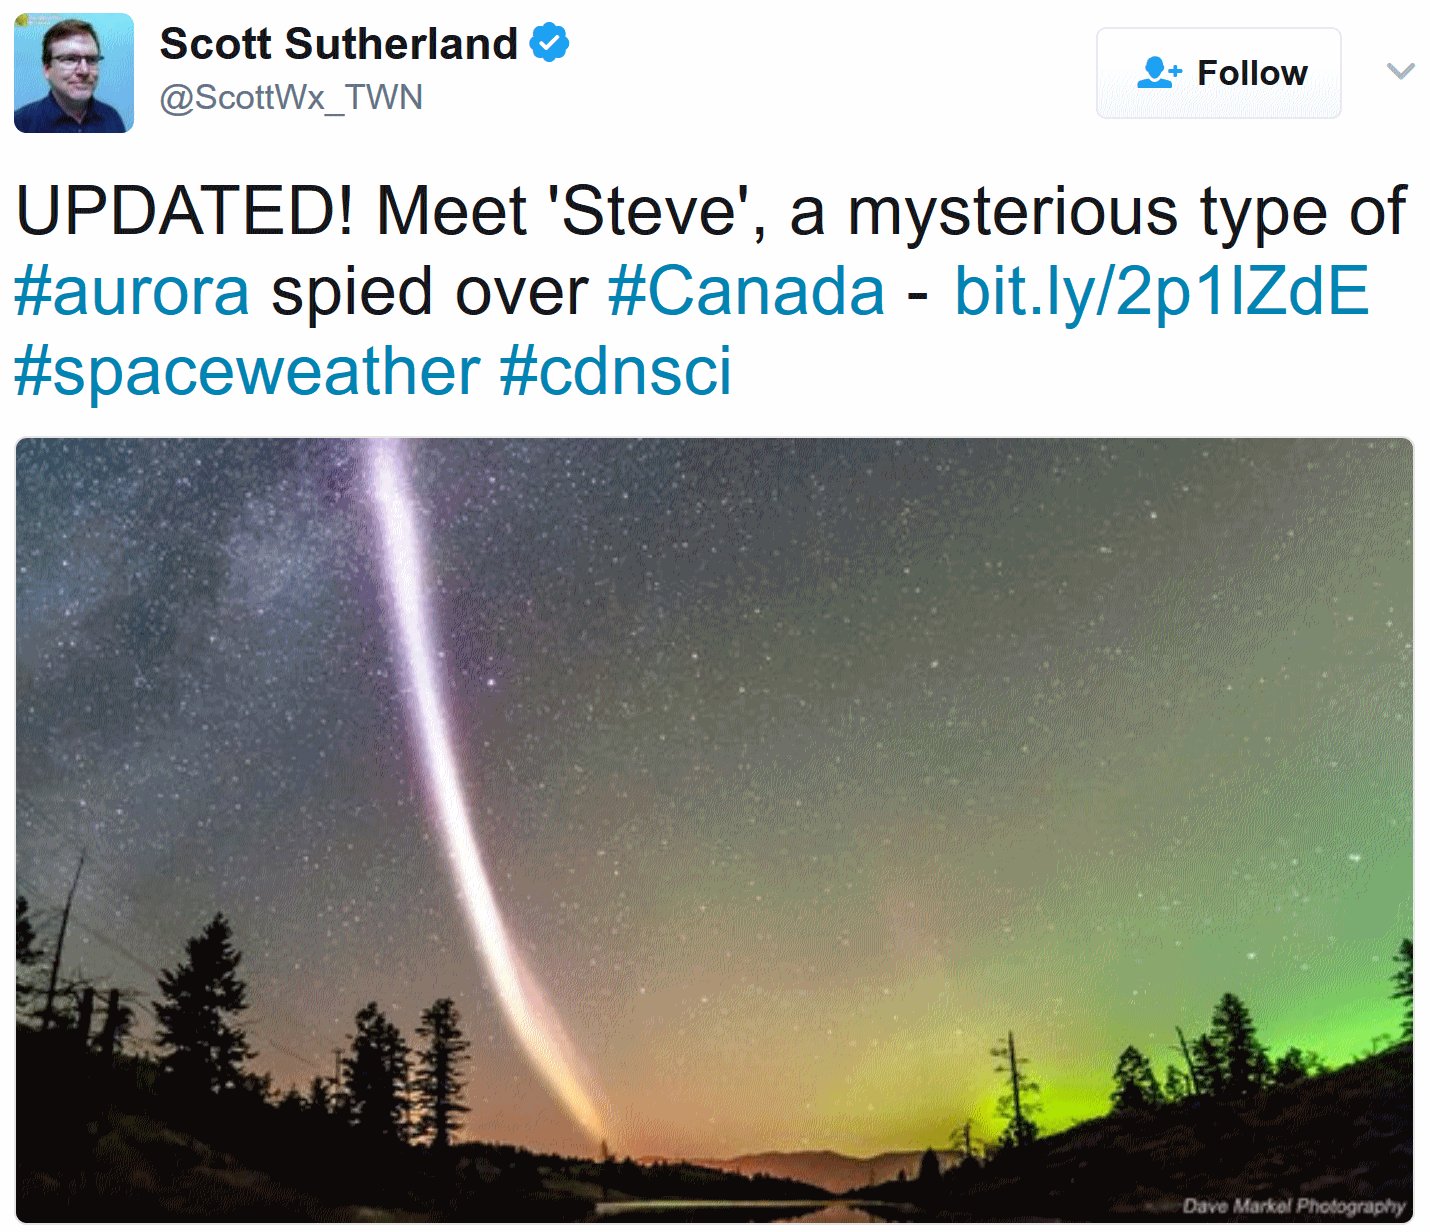 Meet "Steve", a Mysterious Type of Aurora Spied Over Canada
.
The Weather Network has the curious details: "
The
Aurora Borealis, or Northern Lights, is known for putting on a
different light show pretty much every time it shows up in the night
sky. It's one of the amazing features of this spectacular phenomenon.
Sometimes, though, something really different shows up, and it takes the
combined efforts of citizen scientists over social media, and
scientists with access to specialized satellites in orbit, to figure it
out. This is what happened with a special kind of aurora feature, which
some have been calling 'Steve'. Here is 'Steve', shown in the image
below, as the purple stream stretching across the sky, captured by
photographer Dave Markel in 2016..."
TODAY: Some sun, better. Winds: NW 7-12. High: 52
FRIDAY NIGHT: Partly cloudy, more frost outlying suburbs. Low: 33
SATURDAY: Clouds increase, get errands done. Nicer day. Winds: NE 8-13. High: 54
SUNDAY: Cold rain, snow mixes in late. Winds: NE 15-25. Wake-up: 38. High: 44
MONDAY: Rain/snow mix slowly tapers. Slushy accumulation? Winds: NE 10-20. Wake-up: 37. High: 41
TUESDAY: Still gray, sprinkles or flurries. Winds: NW 8-13. Wake-up: 35. High: 46
WEDNESDAY: More clouds than sun, still cool. Winds: W 5-10. Wake-up: 39. High: 55
THURSDAY: Unsettled, passing shower or two. Winds: NW 7-12. Wake-up: 43. High: 58
Climate Stories....
 Climate Change Altering the Arctic Faster Than Expected. Climate Central
 has the latest: "
Evidence
continues to mount that climate change has pushed the Arctic into a new
state. Skyrocketing temperatures are altering the essence of the
region, melting ice on land and sea, driving more intense wildfires,
altering ocean circulation and dissolving permafrost. A new
report chronicles all these changes and warns that even if the world
manages to keep global warming below the targeted 2°C threshold, some of
the shifts could be permanent. Among the most harrowing are the
disappearance of sea ice by the 2030s and more land ice melt than
previously thought, pushing seas to more extreme heights. The findings, released Monday in the Snow, Water, Ice and Permafrost in the Arctic
(SWIPA) assessment, come after a winter of extreme discontent for the
region. Sea ice receded a bit in November, a rare occurrence, and hit a
record-low maximum for the third year in a row. Temperatures averaged 11°F above normal, driven by sustained mild weather that was punctured by periods of almost unheard of heat when temperatures reached up to 50°F above normal..."
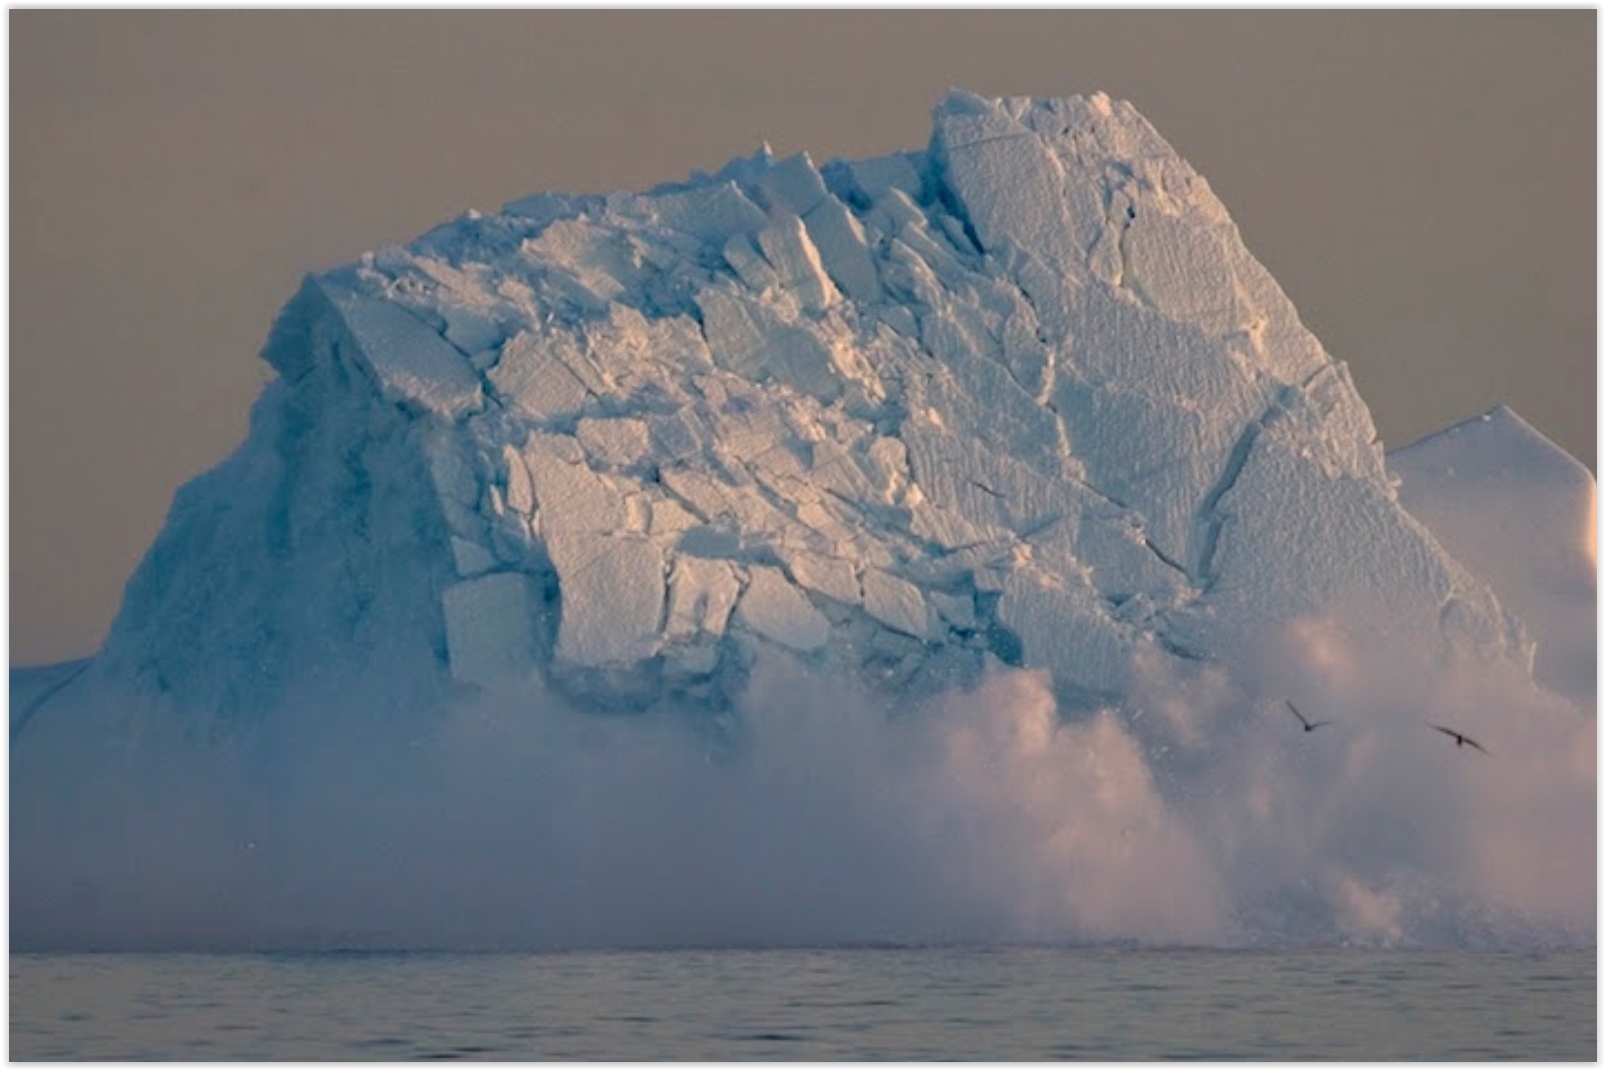
Photo credit: "
An iceberg collapses, Disko Bay, West Greenland." Credit: Carsten Egevang/arc-pic.com.
The Republicans Who Care About Climate Change: "They Are Done With the Denial". Here's an excerpt from
The Guardian: "...
But
amid climate activists’ despair, there are fresh shoots of hope that,
as a party, Republicans’ climate intransigence is shifting. A growing
group of Republicans
in Congress are newly emboldened and are speaking out in favor of
finally addressing a crisis that is starting to bite their constituents.
The Climate Solutions Caucus,
set up just last year, now has 38 members, half of them Republicans.
The congressional group, which is crafting bipartisan action on climate
change, is bolstered by a new chorus of big business, faith groups and
young college-based Republicans that are demanding the GOP drops the
climate skepticism that has become a key part of its identity over the
past decade..."
Photo credit: "
The March for Science in Washington DC. Members of the caucus say their goal is to depoliticize environmental policy in the US." Photograph: Jim Lo Scalzo/EPA
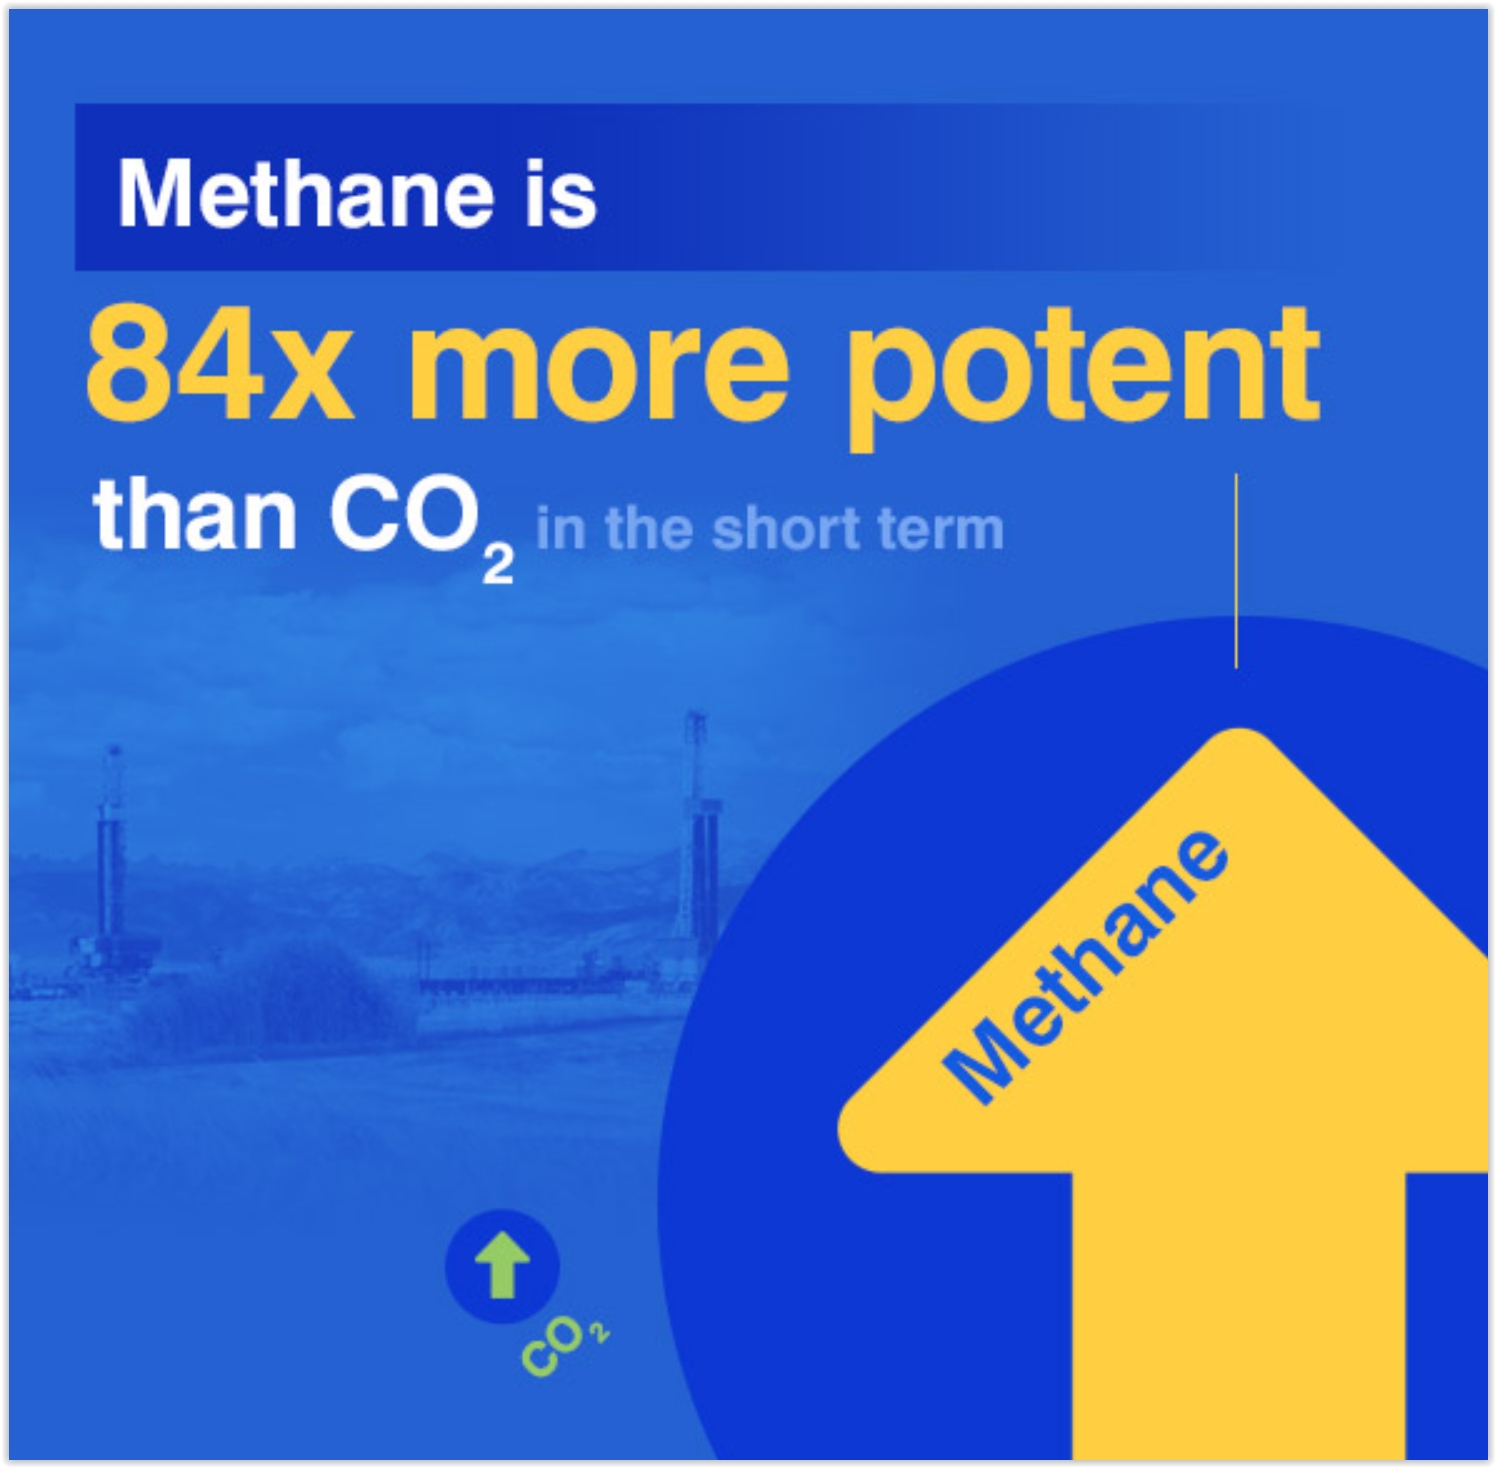 Worrisome Figures For Canadian Methane.
 Climate Nexus has a collection of media reports on methane releases to our north: "
Methane
emissions from the oil and gas industry in Canada could far exceed
official estimates, according to two new reports. A new study from
the David Suzuki Foundation and St. Francis Xavier University published
in the journal Atmospheric Chemistry and Physics finds methane
emissions from industry activity in British Columbia could be 2.5 times
higher than previous estimates. Meanwhile, a separate report
released from a Canadian nonprofit today estimates that methane
emissions in Alberta could be up to 60 percent higher than official
figures. The Canadian government announced last week that it would delay
planned methane reduction regulations by up to three years, garnering
fierce criticism from environmental advocates." (Studies: Toronto Star, Motherboard, Vancouver Sun, Globe and Mail. Regulation delay: CBC, Toronto Star).
Image credit: Environmental Defense Fund.
 The Policy Weapon Climate Activists Need. Buy out the fossil fuel companies to keep carbon in the ground? A nice idea, but probably a fairy-tale. Here's a clip from The Nation: "... The
most straightforward way to accomplish this is for the government to
take direct ownership of fossil-fuel companies. The price tag to
purchase outright the top 25 largest US-based publicly traded oil and
gas companies, along with most of the remaining publicly traded coal
companies, is in the region of $1.15 trillion. That
sounds like a lot of money, but spread out over seven years, the cost
would be less than $200 billion a year, a far from impossible amount—and
less than the annual cost of our string of recent wars. By way of
comparison, paying for the wars in Iraq and Afghanistan will have cost
somewhere in the range of $4-7 trillion when future costs for veterans
are factored in. Surely, radically reducing the threat of climate
catastrophe is a better use of the US government’s financial power than
was the disastrous invasion of Iraq
The Policy Weapon Climate Activists Need. Buy out the fossil fuel companies to keep carbon in the ground? A nice idea, but probably a fairy-tale. Here's a clip from The Nation: "... The
most straightforward way to accomplish this is for the government to
take direct ownership of fossil-fuel companies. The price tag to
purchase outright the top 25 largest US-based publicly traded oil and
gas companies, along with most of the remaining publicly traded coal
companies, is in the region of $1.15 trillion. That
sounds like a lot of money, but spread out over seven years, the cost
would be less than $200 billion a year, a far from impossible amount—and
less than the annual cost of our string of recent wars. By way of
comparison, paying for the wars in Iraq and Afghanistan will have cost
somewhere in the range of $4-7 trillion when future costs for veterans
are factored in. Surely, radically reducing the threat of climate
catastrophe is a better use of the US government’s financial power than
was the disastrous invasion of Iraq..."
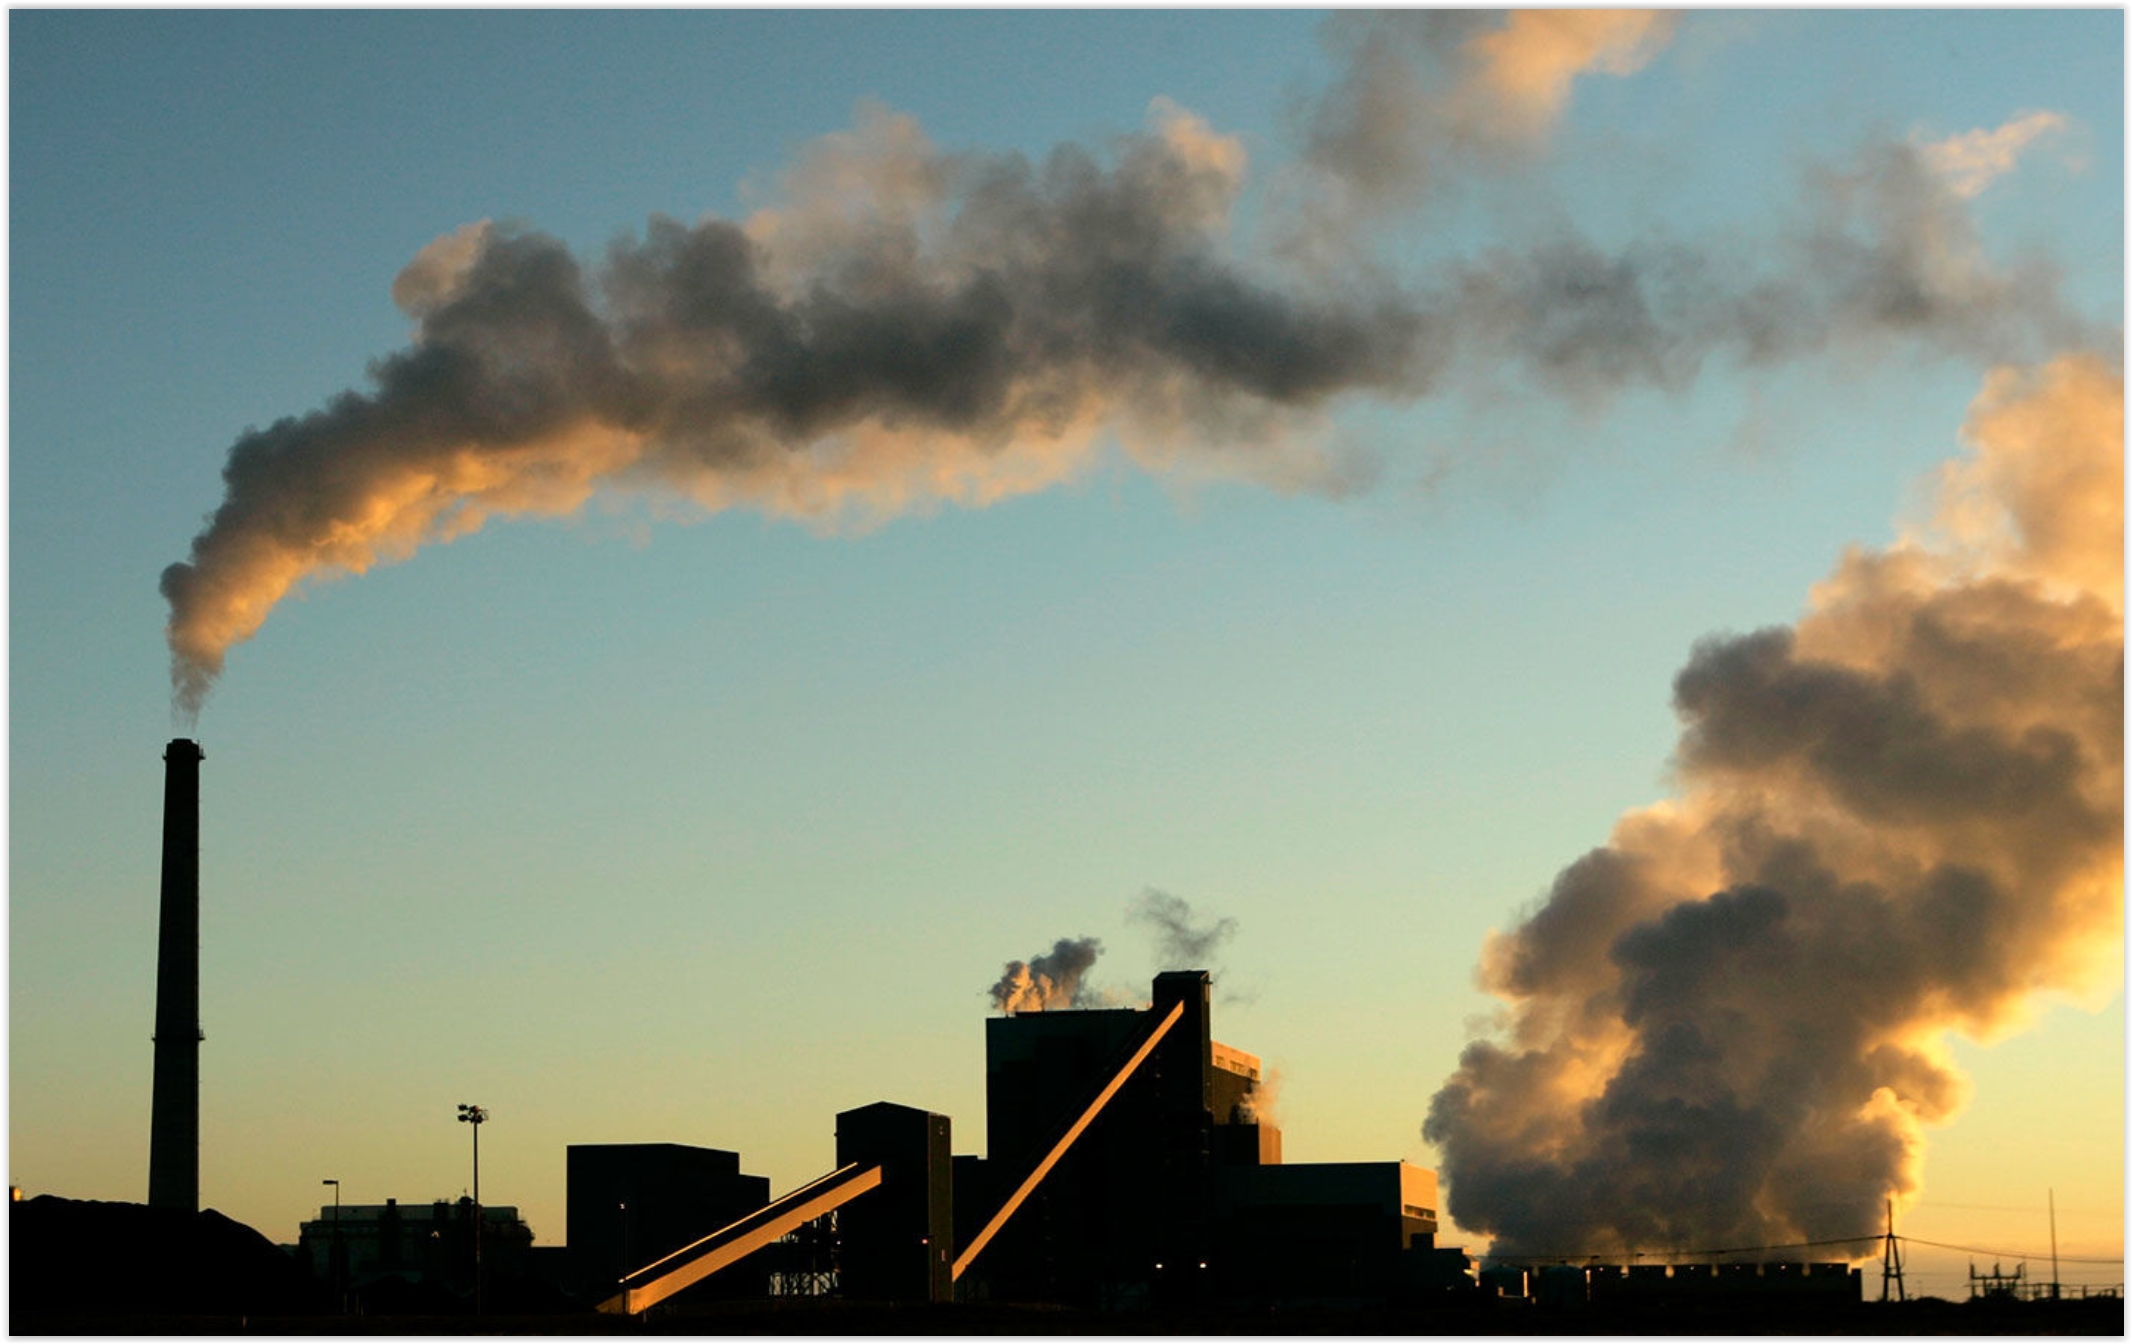
Photo credit: "
A coal-fired power plant in Holcomb, Kansas, in 2007."
(AP Photo / Charlie Riedel).
How Climate Evangelists Are Taking Over Your Local Weather Forecast. Eric Roston at
Bloomberg reports: "...
This
American reluctance to embrace scientific evidence hasn’t often been
counteracted by broadcast meteorologists—who are, in fact, no more
likely than the average citizen to agree that climate change is caused
by humans. There are plenty of possible explanations for this outcome,
including a shortage of climatology education within meteorological
training programs. Part of meteorologists’ reluctance to talk about the
climate stems from the treacherous tools of their trade. Meteorologists
learn very quickly that weather models are messy. Some no doubt sour on
finicky climate models because of this experience. If short-term weather
models make mistakes, it may seem reasonable to assume that a model
projecting into the next century is ridiculous. “Meteorologists are used
to looking at models and being burned,” says Paul Douglas, a former TV
weatherman-turned-serial entrepreneur, who recently published a book on climate change and faith..."
Image credit: Amber Sullins. Photographer: Ali Withers/Bloomberg.
U.S. Vulnerable to Worst of Extreme Sea Rise.
Keep in mind that the much-maligned climate models have done a fairly
good job predicting the warming that has already taken place, but if
anything these models have underestimated the rate of ice melt and sea
level rise. Here's an excerpt from
Climate Central: "
The
beginning of a collapse this century of sections of the Antarctic ice
sheet would disproportionately inundate coasts circling the U.S. — the
country that has done more than any other to pollute the climate. While
such a cataclysmic outcome of warming temperatures from greenhouse gas
pollution is considered unlikely, recent studies have shown it’s more
plausible than previously thought. Based on that research, the federal
government increased its worst-case scenario for the rise of the seas
worldwide by a quarter in January compared with 2014 findings, up to an
average of more than 8 feet by 2100. The impact would be even worse
around the U.S. A National Oceanic and Atmospheric Administration report
warned that regional effects of gravity and ocean current changes
triggered by the start of the ice sheet’s collapse could lead to more
than 12 feet of sea level rise engulfing some coastlines in the Lower
48. That’s about the height of a one-story house..."
Graphic credit: "
Projections for an extreme sea level scenario for New York City under NOAA's new guidelines."
Extreme Sea Level Rise and the Stakes for America. With more perspective here's an excerpt from Climate Central: "Should
a newly published sea level rise scenario come to pass, hundreds of
American landmarks, neighborhoods, towns and cities would be submerged
this century, at least in the absence of engineering massive, costly and
unprecedented defenses and relocating major infrastructure. Ocean
waters would cover land currently home to more than 12 million Americans
and $2 trillion in property. This extreme rise scenario, considered
unlikely but increasingly plausible, was published together with other
projections in a technical report
by the National and Oceanic Atmospheric Administration in January. NOAA
added “extreme” as a new sea level category in the publication,
supplementing high, intermediate and low categories that have also been
used in past reports. The new term reflects recent research suggesting
that some parts of the Antarctic ice sheet may begin to collapse much
sooner than scientists had previously anticipated, particularly if
ongoing emissions of heat-trapping gases like carbon dioxide and methane
remain high..."
80% of Heat Records Worldwide Linked to Climate Change. Increase the baseline temperature and extreme events become more common. Here's a clip at EcoWatch: "...Most scientific research examines the links between climate change and specific weather events, but a first-of-its-kind study
published Monday in the journal Proceedings of the Natural Academy of
Sciences used a new framework to take a comprehensive look at climate
measurements worldwide. The study found that over 80 percent of heat
records worldwide were linked to climate change, while climate change
influenced 57 percent of driest-year records and 41 percent of five-day
precipitation records..."
Most of the World's Largest Investors Taking Climate Risk Action.
Bloomberg reports: "
Most
of the world’s largest asset owners have gotten the message that
climate change poses a risk to their portfolios and are pivoting toward
greener investments. Funds worth $27 trillion that comprise 60 percent
of the world’s biggest investors are considering climate change when
making investment decisions, according to the Asset Owners Disclosure
Project. Funds listing climate as an investment criteria rose 18 percent
from last year.
“The Paris Agreement sent a clear message of global commitment to
tackle climate change,” said Julian Poulter, chief executive officer at
AOPD..."
Climate Denial in Schools. Keep an eye on attempts to question climate science in America's schools, according to a summary at
VICE News: "...
Currently,
six states have legislative measures pending or already on the books
that would allow anti-science rhetoric, including the rejection of
global warming, to seep its way into schools’ curricula. While these
types of proposals have become fairly routine in certain states, some of
the most recent crop have advanced farther than in the past. Senate
Bill 393 in Oklahoma, for example, would permit teachers to paint
established science on both evolution and climate change as
“controversial.” The “controversy,” however, doesn’t really exist — more than 97 percent
of actively publishing, accredited climate scientists agree that global
warming trends over the past century are directly attributable to human
activity. And some teachers might already be misleading students..."
 El Nino and the End of the Global Warming Hiatus. Here's an excerpt from Yale News: "...A
new climate model developed by Yale scientists puts the “global warming
hiatus” into a broader historical context and offers a new method for
predicting global mean temperature. Research by professor Alexey Fedorov
and graduate student Shineng Hu indicates that weak El Niño activity
from 1998 until 2013, rather than a pause in long-term global warming,
was the root cause for slower rates of increased surface temperature.
The research, published in the journal Geophysical Research Letters,
also finds that volcanic activity played only a minor role. “Our main
conclusion is that global warming never went away, as one might imply
from the term ‘global warming hiatus,’” said Fedorov, who has conducted
extensive research on the oceans’ role in climate. “The warming can be
masked by inter-annual and decadal natural climate variability, but then
it comes back with a vengeance.
El Nino and the End of the Global Warming Hiatus. Here's an excerpt from Yale News: "...A
new climate model developed by Yale scientists puts the “global warming
hiatus” into a broader historical context and offers a new method for
predicting global mean temperature. Research by professor Alexey Fedorov
and graduate student Shineng Hu indicates that weak El Niño activity
from 1998 until 2013, rather than a pause in long-term global warming,
was the root cause for slower rates of increased surface temperature.
The research, published in the journal Geophysical Research Letters,
also finds that volcanic activity played only a minor role. “Our main
conclusion is that global warming never went away, as one might imply
from the term ‘global warming hiatus,’” said Fedorov, who has conducted
extensive research on the oceans’ role in climate. “The warming can be
masked by inter-annual and decadal natural climate variability, but then
it comes back with a vengeance...”
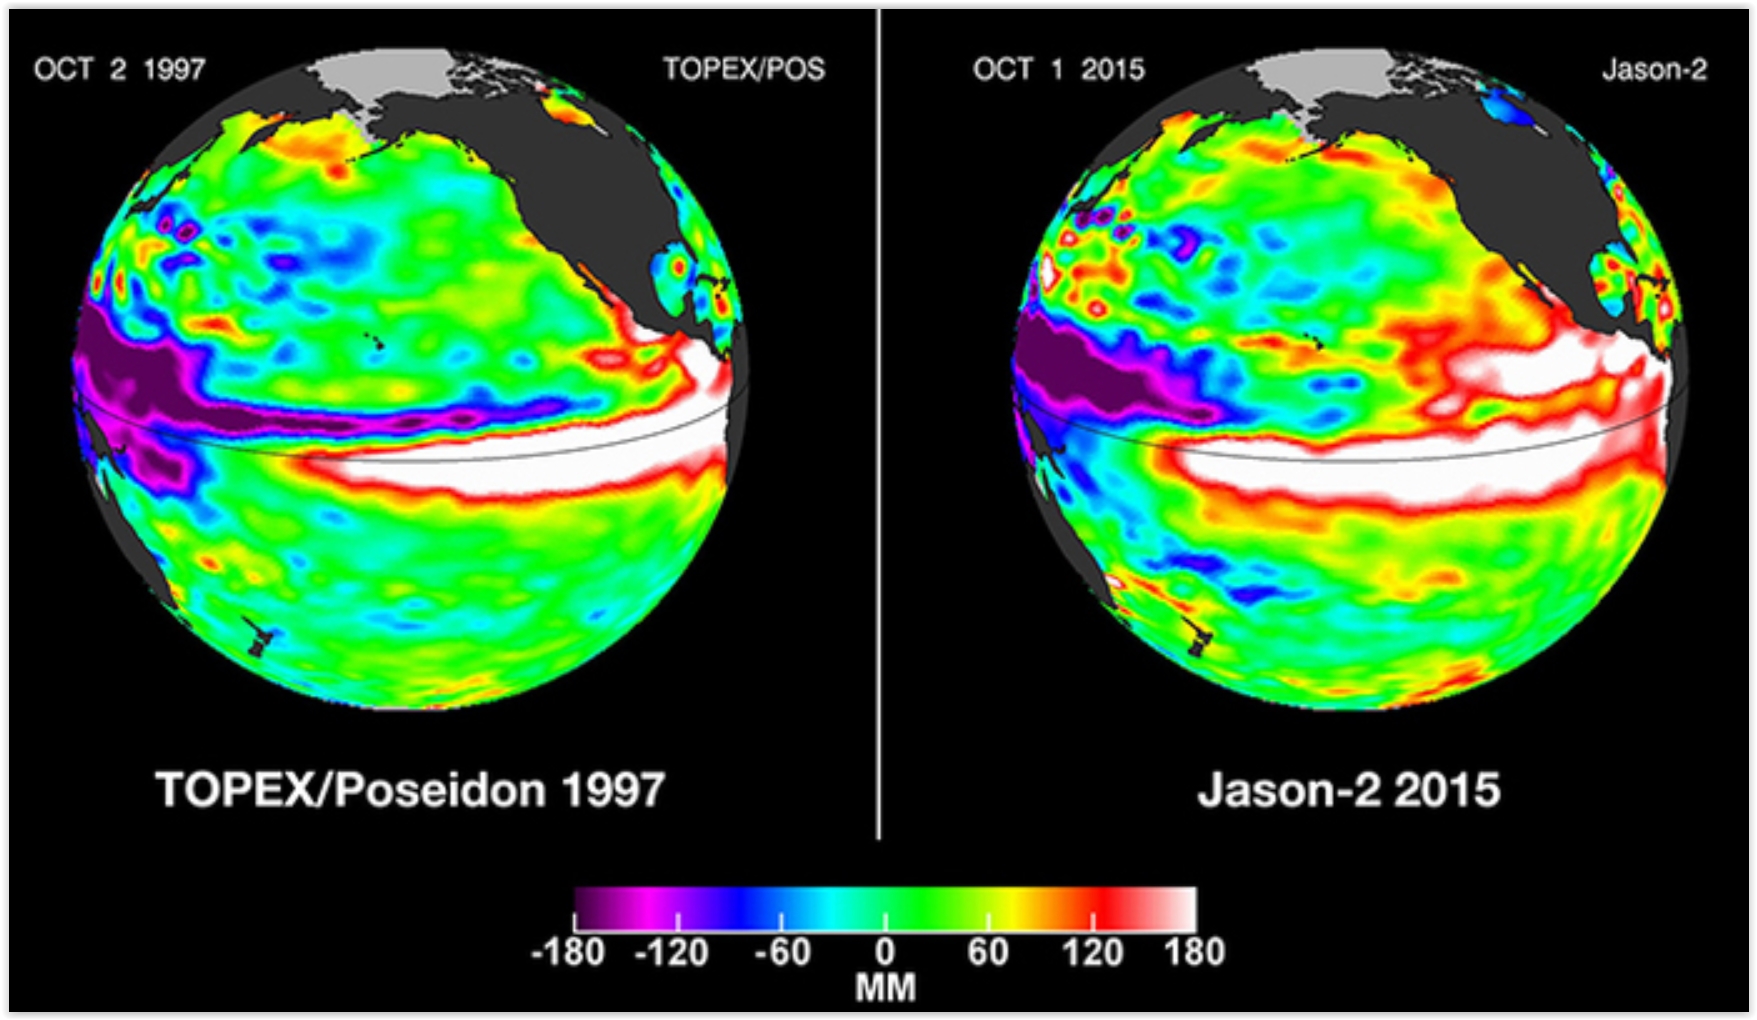
Graphic credit: "
Pacific
Ocean sea surface height anomalies during the 1997-98 El Nino (left)
are compared with 2015 Pacific conditions (right). The 1997 data are
from the NASA/CNES Topex/Poseidon mission; the 2015 data are from the
NASA/CNES/NOAA/EUMETSAT Jason-2 mission. (Image credit:
NASA/JPL-Caltech)."
No comments:
Post a Comment