Paul's Conservation Minnesota Outlook for the Twin Cities and all of Minnesota:
TODAY: Few flurries, a colder wind. Winds: NW 10-20. High: 15
SATURDAY NIGHT: Patchy clouds, few flurries. Low: -3
SUNDAY: Coating of flurries, still nippy. High: 8
MONDAY: Couple inches of snow possible from the next clipper. High: 18
TUESDAY: Peeks of sun, plenty cold. Low: -3. High: 5
WEDNESDAY: Another chance of snow, a few few inches? Low: -1. High: 17
THURSDAY: Blue sky, feel like hibernating. Low: 0. High: 9
FRIDAY: Clouds increase, still numbing. Low: -2. High: 10
* Computer models are hinting at a run of upper 20s to mid 30s for the last few days of January. With temperatures warmer than 32 F. predicted throughout the lowest mile of the atmosphere, it might even be warm enough for a little light rain after the 23rd. We'll see. I know - you'll believe it when you see it.
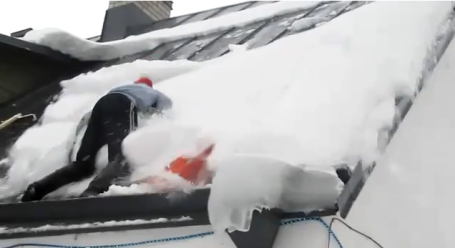
Ice Dam Removal FAIL. Anyone considering climbing up on the roof to remove an ice dam (or get the snow off) yourself might want to first check out
this You Tube video clip. The guy is OK, but odds are he'll never attempt this again.
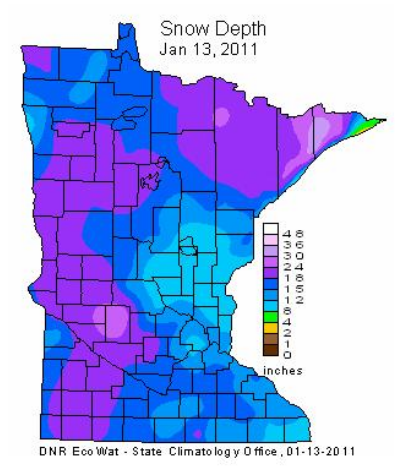
Minnesota Snow Depth. The latest DNR map shows 8-12" on the ground across most of the Twin Cities metro area to St. Cloud, but 18-24" over much of western MN and the Arrowhead. To see the latest observations for yourself, click
here. Looks like we'll be adding to these totals in the days ahead, no major, newscast-leading dumpings, just a series of "2-inchers" Monday, again Wednesday of next week. Feeling a little better about that prediction of a 70"+ winter at MSP.
* From Mark Seeley's popular "Minnesota Weather Talk"
blog: "
Through the first two weeks of January, Minnesota has reported the lowest temperature in the 48 contiguous states on seven days. The colder than normal trend in temperatures established across the state in December has continued into January. Since the 1st of December daily temperatures have climbed to the freezing mark (32 F) only 4-5 times around the state and most observers have yet to see a temperature of 30 degrees F this month."
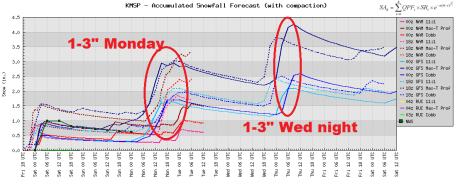
A Parade of (Mostly-Minor) Storms. Models are suggesting a couple inches Monday, again Wednesday. By the end of next week we'll probably have 55-56" so far this winter in the Twin Cities.
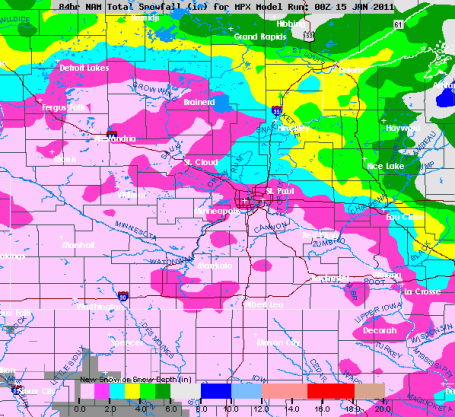 Expected Snowfall by Monday
. The latest NAM model is hinting at 1-2" Monday, best chance of 2"+ north/east of the Twin Cities metro area.
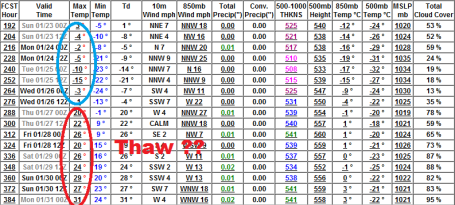
Looking Better For A Late-Month Thaw. The GFS is still hinting at a thaw, setting in after January 27 or 28, potentially mild enough aloft for a little light rain the last few days of January. Colder than average weather is likely through the 25th, but frankly, my confidence level in the extended "trend" is quite low - the GFS
model keeps swinging back and forth between thaw and no-thaw. It will (eventually) warm up. Just not sure when...
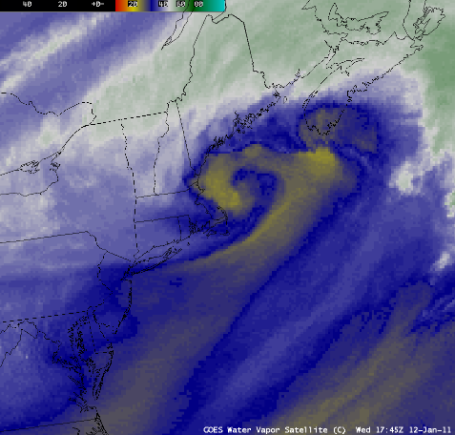
Anatomy Of A Coastal Storm. The CIMSS weather blog at the University of Wisconsin has more details on the powerful storm that dumped over 3 feet of snow on interior New England earlier this week in
this post.
Why The Wild Winter Weather? I thought this was a timely
article (helping to answer the question, "how can it be so cold and snowy if the global climate is, in fact, warming up over time?) "
Winter weather has been especially harsh this year, as it was last year. Scientists have long predicted that weather across the Northern Hemisphere could get colder with global warming. How might this work? Some commentators have invoked changes in atmospheric circulation over Siberia to explain the severe winter weather besieging Europe and parts of the U.S. But there is another part of this puzzle lying closer to our own shores. Warming may be leading to cooling via melting Arctic ice. For the past 16 months a climate phenomenon known as the North Atlantic Oscillation (NAO) has been locked in one mode; a negative phase, an unusually long stretch with unusually high atmospheric pressures over the Arctic, and low pressure to the south. Highs persist over cold areas, for cold air is heavy and sinks. Lows, meanwhile, form over warm regions, for hot air rises. And winds and weather fronts flow "downhill," as it were, from highs to lows. So why might a High pressure system be locked in over the North Atlantic?"
Global Warming Waning? Hardly. 2010 Was Tied As Warmest Year On Record. An
article from Pete Spotts at the Christian Science Monitor: "
Last year tied 2005 as the warmest year on record, federal climatologists said Wednesday, adding that an analysis of the year's data strengthened the notion that greenhouse gases from burning fossil fuels are continuing to warm Earth's climate. According to a preliminary analysis of year-end data released Wednesday, the global average temperature in 2010 topped the 20th century average by 1.12 degrees Fahrenheit. This caps a decade marked by nine of the 10 warmest years on record and represents the 34th consecutive year in which global average temperatures topped the 20th-century average, according to data compiled by the National Oceanic and Atmospheric Administration's Climatic Data Center in Asheville, N.C. In addition, the year was the wettest on record globally, although rain and snowfall varied widely from place to place."
Forecaster: Two Phenomena Responsible For World's Bizarre Weather. I think there is a significant amount of merit to this scientist's observations and theories - all these factors superimposed over a warmer, wetter atmosphere, one primed to result in more frequent and extreme weather events. Think of it this way: the Earth is running a fever. The fever (in and of itself) might not kill you. But when the fever mutates into tangible symptoms (pneumonia, heart failure, etc) the fever can result in something far worse. Maybe I'm taking this analogy too far, but the bottom line: a warmer, more moist atmosphere increases the potential for these weather spasms we're currently witnessing around the planet.
From an
article at CNN.com: "
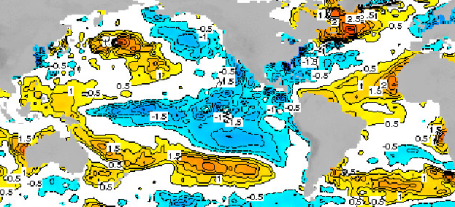
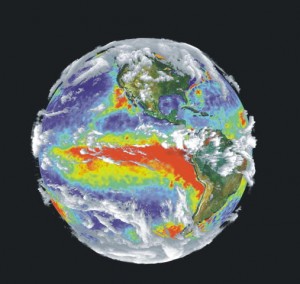
A graphic outlining sea temperature anomalies the first week in January shows drops in the Pacific as air temperatures rise between the U.S. and Europe (continents in gray). La Niña and the North Atlantic Oscillation are to blame, an expert says. The catastrophic weather events taking place across the globe – from Brazil’s and Australia’s flooding to the Eastern United States’ heavy snowfall – have two likely explanations. Tony Barnston, lead forecaster at Columbia University’s International Research Institute for Climate and Society, said two phenomena – La Niña and the North Atlantic Oscillation – are likely responsible for the patterns we’re seeing. Though La Niña is different every time, it can be simply defined as a drop in water temperature in the eastern and central tropical Pacific Ocean. This particular La Niña appeared in July, Barnston said, and will last through spring."
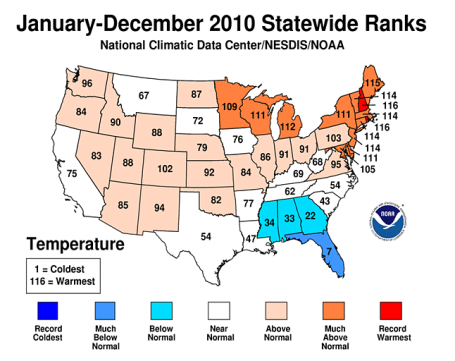
2010: 7th Warmest Year On Record For Minnesota. Click
here for a good (national) summary of 2010 from NOAA. Vermont experienced the warmest year in the last 116 years, the 2nd or 3rd warmest ever recorded for most of New England, 5th warmest in Wisconsin and 4th warmest for Michigan. A few highlights:
- In the contiguous United States, 2010 was the 14th consecutive year with an annual temperature above the long-term average. Since 1895, the temperature across the nation has increased at an average rate of approximately 0.12 F per decade.
- Precipitation across the contiguous United States in 2010 was 1.02 inches (2.59 cm) above the long-term average. Like temperature, precipitation patterns are influenced by climate processes such as ENSO. A persistent storm track brought prolific summer rain to the northern Plains and upper Midwest. Wisconsin had its wettest summer on record, and many surrounding states had much above-normal precipitation. Since the start of records in the U.S. in 1895, precipitation across the United States is increasing at an average rate of approximately 0.18 inches per decade.
Sharks Spotted Swimming Through Flooded Streets In Australia. Forget the snakes and crockodiles - now there are reports of SHARKS showing up in the flooded neighborhoods throughout Queensland, in northeastern Australia.
More from NewsCore and myfoxorlando.com:
"
Two bull sharks, renown for their aggression, were spotted swimming through the flooded streets of a small town in the inundated Australian state of Queensland, the Queensland Times reported Friday. The amazing sightings were made in Goodna, a center of around 8,000 people which lies between the state capital Brisbane and the nearby southeast city of Ipswich. One of the sharks was spotted by local butcher Steve Bateman swimming in floodwaters near his shop Thursday while another one was seen in water covering the town's main street."
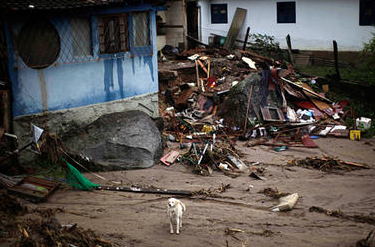
Mudslide Alert. Southeastern Brazil is bracing for more flooding and more mudslides. Over 500 people (mostly poor slum-dwellers perched in precarious homes on the hills outside Rio de Janeiro, have lost their lives from a series of massive mudslides. More from the Christian Science Monitor
here.
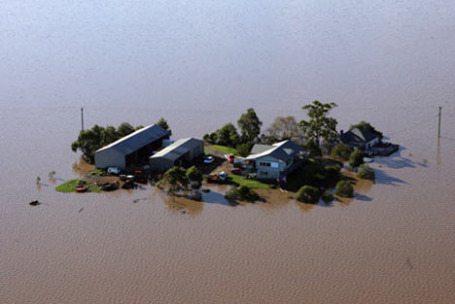
Australian Flooding Tied To La Nina. The floods that have killed over 2 dozen people in Queensland, inundating more than 20,000 homes and 5,000 businesses, seemed to peek on Thursday, but the damage in Brisbane, the capital of Queensland, has been devastating. And now (some) scientists are linking the prolonged flooding to La Nina, the strong cooling of Pacific Ocean water that has a domino effect from Australia to the USA. From a recent
story: In Australia's third largest city, Brisbane, there have been dozens of dramatic rescues from fast moving flash floodwaters . As many as 35,000 homes have been destroyed. Dozens of people have died and even more are still missing. "As we look across Queensland and see 3/4 of our state having experienced the devastation of raging flood waters, we now face a reconstruction task of post-war proportions," said Anna Bligh, Queensland Premier. Some are now tying the flooding rains to La Niña , a phenomenon where the water in the eastern Pacific Ocean cools and drastically changes long-term weather patterns. Northern Australia typically sees more rain during a La Niña event. December 2010 was the wettest on record for Queensland, Australia."
National Weather Service On Facebook. Why not friend NOAA? You can get some great (breaking) information and weather-related stories via Facebook. Click
here to learn more.
On The Go: Top Gear In The Year 2031. Gizmag.com has an interesting round-up of some of the technology we may be tapping in the decades ahead. An excerpt from the
article: "
When you look back 20 years to the era of brick-like mobile phones, film-based cameras and – scary as it is – no Facebook, it's easy to see how far technology has come. But how far will it go? In the final installment of our "on the go" series we've cast our minds two decades into the future to take a look at some of the most promising mobile technologies that are likely to reach maturity by the year 2031, delivering connectivity, convenience and portability on a science fiction scale."
Hey, What's Your (New) Sign? Uh oh. All along I thought I was a Gemini; the whole dual-personality thing kind of works in my case. Am I Paul or Doug? Depends on who I'm chatting with. Now it turns out I'm a Taurus. Say what? Talk about an identity crisis. The MN Planetarium Society (I'm on the board) has stirred up a bit of a hornet's nest with their assertion that the current astrological signs are off, a bit, Apparently the moon's gravitational tug has caused the Earth's axis to "wobble", creating a one month bump in the sun's alignment. Click
here to the read the Star Tribune article on the "discovery". According to Parke Kunkle, another board member of the MN Planetarium Society, here are the new, adjusted (improved?) dates and signs for your consideration:
YOUR REAL HOROSCOPE
Astrology buffs should be using these dates, reflecting where the stars currently are aligned:
Capricorn: Jan. 20-Feb. 16.
Aquarius: Feb. 16-March 11.
Pisces: March 11-April 18.
Aries: April 18-May 13.
Taurus: May 13-June 21.
Gemini: June 21-July 20.
Cancer: July 20-Aug. 10.
Leo: Aug. 10-Sept. 16.
Virgo: Sept. 16-Oct. 30.
Libra: Oct. 30-Nov. 23.
Scorpio: Nov. 23-29.
Ophiuchus:* Nov. 29-Dec. 17.
Sagittarius: Dec. 17-Jan. 20.
* Discarded by the Babylonians because they wanted 12 signs per year. (source: Star Tribune).
 Snow-Weary
. Hey, I love snow - just not on I-494 at rush hour. It took me close to 2 hours getting from Excelsior to MSP International Friday late afternoon - way too much snow on the freeway, and glaze ice. Not sure if the budget crisis in St. Paul is impacting the number of plows on the highway, but that's the perception that a lot of people are having right now. The truth may be more complicated: the TIMING
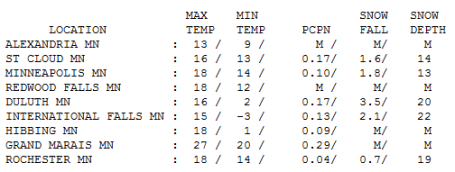
of the snow (came during the height of rush hour) coupled with the air temperature: mid teens, which makes it much tougher to melt snow and keep roads wet/slushy. 1.8" snow fell on the Twin Cities, with 1.6" at St. Cloud, .7" Rochester and 3.5" on Duluth. For the record we're up to 51.7" for the winter, to date, at MSP.
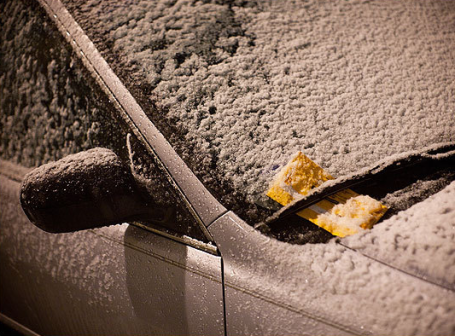
"Wheel Track Glazing"
It's getting to the point where I'm afraid to pick up the morning paper or turn on the news. Based on the moon's gravitation tug creating a "wobble" of the Earth's axis, I'm no longer a Gemini, I'm now a Taurus? My world has been turned upside down. My real sign? "Slippery when wet." Yep.
Another eye-opening discovery: warm tires passing over freshly fallen snow can create instant melting, the tracks in the snow then freezing almost instantly into glaze ice, the "black ice" we hear so much about. It's a much bigger problem when air temperatures are colder than 10-15 F. I'll say it again: an inch falling at 10 F is FAR more dangerous than 4" falling at 27 F, when MnDOT chemicals do a far better job keeping roads wet.
Flurries taper today, a fairly quiet weekend on tap. But a series of (mostly minor) mini-storms are shaping up, a couple more inches possible Monday, again Wednesday.
Next week's cold wave has been neutered; each successive computer run cuts back on the severity of the polar outbreak - maybe 2 or 3 night below zero, but hardly record-breaking. Models still (strongly) suggest a thaw after the 22nd, maybe a week or more > 32 F, possibly warm enough for rain. Rain?
2010 Ties For Hottest Year: Will Climate Change Denials Persists? A
post from Max Fisher at theatlanticwire.com: "
2010 has tied 2005 for the planet's hottest year on record, according to data collected by NASA and the National Oceanic and Atmospheric Administration. The past decade has included 9 of the 10 hottest years on record. Those records go back to 1880, when scientists first began reliably tracking global temperatures. Andrew Sullivan has a disturbing graph illustrating the rise. The past 34 years have all been warmer than the 20th-century average. 2010 also had the highest rainfall on record, possibly highlighting the connection between climate change and an increase in extreme weather events. Bloggers are responding to the data with frustration and dismay."
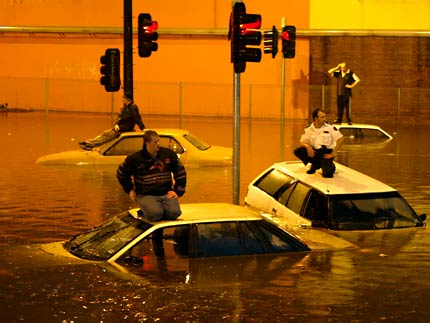
Raging Waters In Australia and Brazil A Product Of Global Warming? It should be pointed out that no one storm, front (or even summer/winter) can be seen as "proof" of climate change - it's the global accumulation of not only temperature trends (water and land) but the frequency and intensity of severe weather events. If you increase the global temperature, even slightly, you increase the amount of evaporation, which means more water vapor floating overhead. A 4% increase in water vapor/moisture has been observed worldwide. That means more potential "fuel" available for storms, and a subsequent spike in flooding events, which is what we seem to be seeing in the data trends. From a recent article at ABC News: "
The pictures today from around the world of dramatic rooftop rescues from raging waters, makes it seem as though natural disasters are becoming an everyday occurrence. But they're not all that natural; climate scientists say man-made global warming is the sudden force behind the forces of nature. In the mountains of southeast Brazil, more than 340 people have died after fierce mudslides swept away homes. At least 50 are still missing and victims continue to search for loved ones. On the other side of the globe, floods in Queensland, Australia have ravaged an area the size of France and Germany combined."
Could The Chevy Volt Really Help To Reduce Global Warming? From an
article at theatlantic.com: "
Accolades keep pouring in for the Chevy Volt, the electric car darling of the 2011 Detroit auto show, including the show's North American Car of the Year award this week from a jury of swooning auto journalists. In his corny acceptance speech, General Motors vice-chairman Tom Stephens' thanked "all of the jurors who Volted, or voted, for the Chevrolet Volt," a plug-in electric hybrid with gas backup. Its all-electric rival, the Nissan Leaf, was a runner-up. But public acceptance, pricier sticker numbers, charging challenges, and a willingness to break old driving habits (goodbye to pedal to the metal) will determine whether the Volt and its brethren actually electrify (sorry, couldn't resist) the auto marketplace -- and ultimately improve the environment -- or fall short of current industry and media hype."
Year 3000 Not Looking Pretty In Climate Model. A recent
story from msnbc.com: "
Even if humans stop producing excess carbon dioxide in 2100, the lingering effects of global warming could span the next millennia. The results? By the year 3000, global warming would be more than a hot topic — the West Antarctic ice sheet could collapse, and global sea levels would rise by about 13 feet (4 meters), according to a new study. Using a computer model, researchers looked at two scenarios – an end to humans' industrial carbon dioxide emissions by 2010 and by 2100 – stretched out to the year 3000. Even if humans were to stop emitting excess carbon dioxide — or if they figured out a way to completely capture it — the effects of global warming would continue to accumulate. That's because previously emitted carbon dioxide lingers in the atmosphere and the oceans, unlike land, warm only gradually, according to one of the study researchers, Shawn Marshall, an associate professor of geography at the University of Calgary."


No comments:
Post a Comment