* The severe icing caused by Thursday's clipper may have been an example of something called "
wheel track glazing". I didn't even know this phenomena had a name, but the Quad City Times
explained the process that can turn fluffy, powdery snow into a glaze of sheer ice:
"
The combination of light blowing snow and cold surface temperatures is causing icy roadways because to a phenomenon called wheel track glazing. “Wheel-track glazing” is caused by warm tires trapping the ground level blowing snow. As more vehicles travel over the same wheel tracks a glaze of ice forms, which becomes very slippery. The condition is very difficult to treat, according to the Iowa Department of Transportation, as the ice is continuously forming on heavily traveled roadways."
 A Taste Of Minnesota
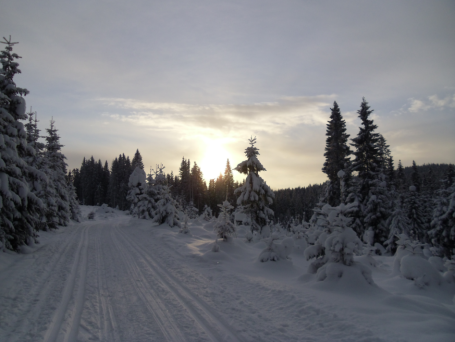
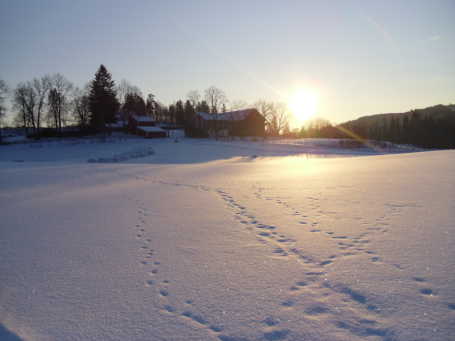
. Thanks to Sean Garvey for sending in a couple of terrific photos from a recent visit to Norway. "
These photos were taken in Asker Norway while cross country skiing. They were taken on the winter solstice 2010, and 1 day afterward. Both photos were taken at about noon, so the sun was at its highest for the day. The landscape reminded me of Minnesota (born and raised in Rochester), and it was also especially impressive to see the incredibly low sun angle. I thought Paul might find these interesting."
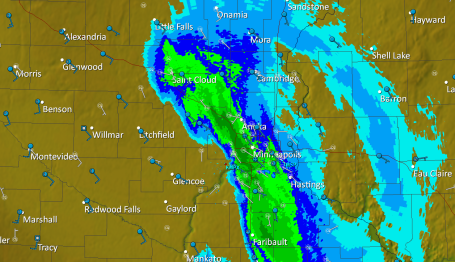
Like Turning On/Off A Light Switch! Every storm is different, every clipper has its own eccentricities - but yesterday's burst of snow was another head-scratcher. We went from no-snow at 8:45 am, to a heavy snow squall at 9:30 am, back to no-snow again by 10:35 am. The band of snow was all of 40 miles wide, moving at about 20 miles an hour, like a line of summer thundershowers. All in all about a 2 hour snow event, dropping 1/2 to 1" on much of the metro - just enough to make the highways a minor mess. GR3 Analyst Doppler image taken at 10:40 am Thursday.
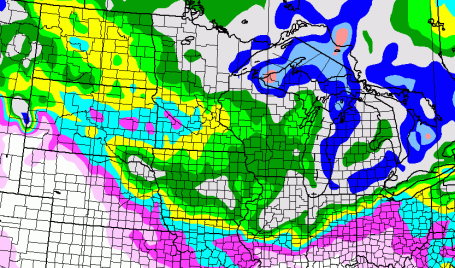
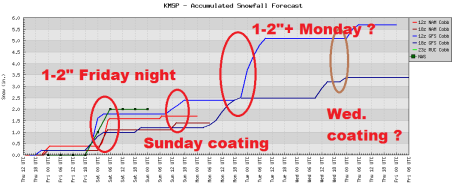
Potentially Plowable. The latest GFS model is suggesting some 2-4" amounts by next Tuesday morning, coming in two distinct clippers: Friday night, again late Sunday into Tuesday, as the leading edge of Arctic air approaches. I'm leaning more toward 1" for most of the metro from tonight's clipper.
A Flurry Of Snow Events. 1" tonight, another coating of flakes possible Sunday, maybe a couple inches Monday, another coating next Wednesday? Not much of a break in-between the clippers, but that's the pattern we're in. When in doubt (which is much of the time) just predict snow. Chances are you'll be right.
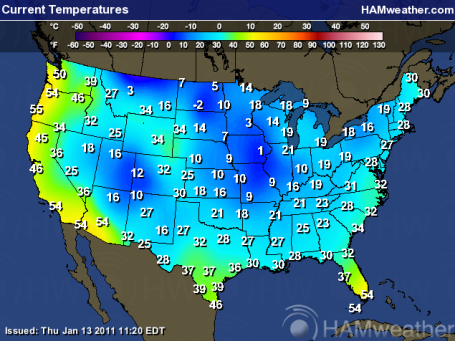
Misery Loves Company. It helps (on some primal level) to know that most of America is shivering right along with us, even down in Florida. The 10 am Thursday temperature in Tampa was 37, a brisk 54 in Miami (I'm sure the locals were not happy, nor the tourists who shelled out hundreds or thousands of bucks to thaw out). 32 in Jacksonville? Good grief.
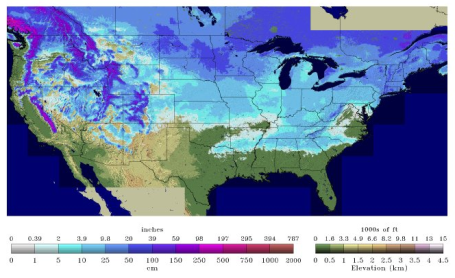
71% Of America Covered In Snow. It's not a record, but it's certainly above average for the second week of January. Snow on the ground on 49 of the 50 states (including Hawaii - snow on the top of extinct volcanoes, Mauna Loa and Mauna Kea). Again, this is "weather", not "climate". Easy to get the two confused.
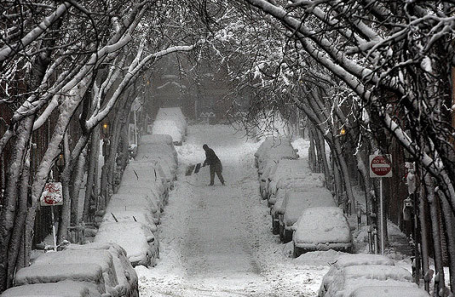
Digging Out. Boston picked up close to a foot of snow (in the city), but the town of Savoy, MA picked up an astounding 38.2", more than 3 feet (without the drifts). The Boston Globe has more on the storm
here.
More Snowfall Totals From The Recent Coastal Storm:
North Haven, CT: 29.5"
Harford, CT: 22.5" (new record)
New York City (Central Park): 9.1"
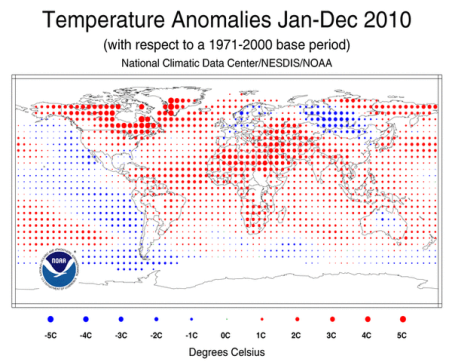
2010: Tie For Warmest Year On Record. According to NCDC, the National Climatic Data Center (division of NOAA) 2010 tied 2005 as the warmest year since 1880, for land and ocean temperatures. Here in the USA it was the 23rd warmest year since 1880. Click
here to see all the details in the 2010 State Of the Climate Global Analysis. A few highlights:
- For 2010, the combined global land and ocean surface temperature tied with 2005 as the warmest such period on record, at 0.62°C (1.12°F) above the 20th century average of 13.9°C (57.0°F). 1998 is the third warmest year-to-date on record, at 0.60°C (1.08°F) above the 20th century average.
- The 2010 Northern Hemisphere combined global land and ocean surface temperature was the warmest year on record, at 0.73°C (1.31°F) above the 20th century average. The 2010 Southern Hemisphere combined global land and ocean surface temperature was the sixth warmest year on record, at 0.51°C (0.92°F) above the 20th century average.
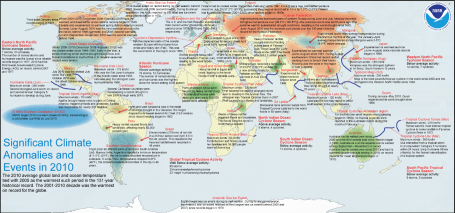
2010: Most Significant "Climate Anamolies". Last year was off-the-scale weird, in terms of extreme weather events around the planet. From record heat/drought in Russia to historic flooding in Pakistan. The number (and severity) of floods seemed to spike, the Northwest Passage opened up - making it possible to sail from the Atlantic to the Pacific on a route well north of the USA. Click
here to see a blown-up version of this map, courtesy of NCDC and NOAA.
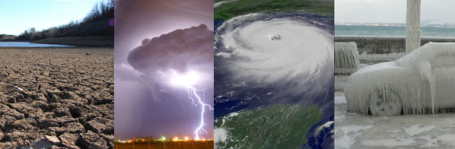
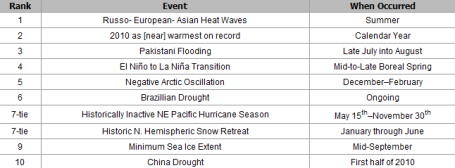
Top 10 Weather/Climate Stories For 2010. This is somewhat subjective, and yet if you look at overall impact: dollars (or rubles) lost, number of fatalities, injuries, people displaced - it becomes a bit more straightforward categorizing the most extreme events of last year. Click
here to see more details on what was a thoroughly forgettable year. I had forgotten just how amazing last year was, like Mother Nature had lost her mind. It's anyone's guess whether those atmospheric tantrums will spill over into 2011, but a killer tornado outbreak in the St. Louis area on New Year's Day (earliest on record) may have set the tone.
"High Tide Heels". For stylish women who live next to fickle rivers, Hurricane Alley, now you can be prepared for the next flood and not worry about footwear!
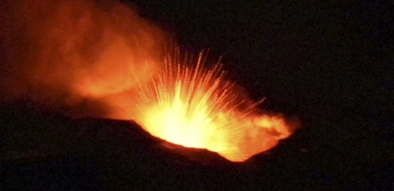
Fire In The Hole. Mt. Etna erupted Wednesday night for 2 hours. The volcano killed an estimated 15,000 Italians in 1185, locals are holding their breath that this will be a minor eruption and not lead to something worse. More from Yahoo News
here.
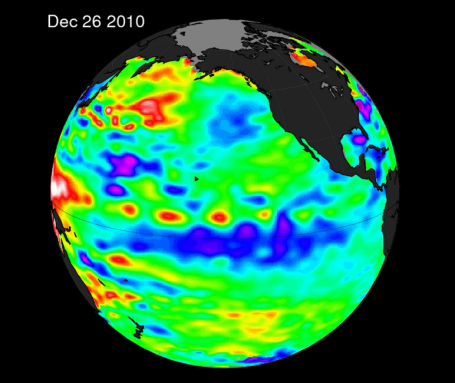
NASA Satellites Capture A Stronger La Nina. This has been one of the stranger La Nina's (cooling phases in the Pacific) in recent memory. It's also one of the strongest ever observed in the roughly 50 year span where scientists have been tracking and measuring this strange oscillation of pressure and water temperatures sloshing across the Pacific. La Nina events usually correlate with colder, snowier weather for much of the northern USA, and drier, warmer weather for the west coast. Tell that to residents of California, where a series of wild storms triggered flooding and mudslides a few weeks ago. More from
NASA: "
New NASA satellite data indicate the current La Niña event in the eastern Pacific has remained strong during November and December 2010. A new Ocean Surface Topography Mission (OSTM)/Jason-2 satellite image of the Pacific Ocean that averaged 10 days of data was just released from NASA. The image, centered on Dec. 26, 2010, was created at NASA's Jet Propulsion Laboratory (JPL), Pasadena, Calif. "The solid record of La Niña strength only goes back about 50 years and this latest event appears to be one of the strongest ones over this time period," said Climatologist Bill Patzert of JPL. "It is already impacting weather and climate all around the planet."
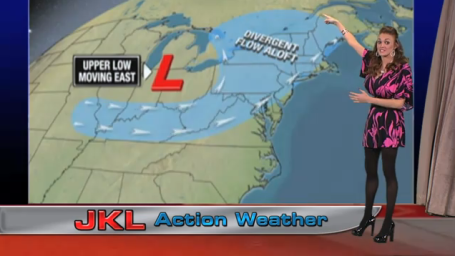
Jimmy Kimmel Has A New "Chief Meteorologist". Say hi to receptionist/meteorologist Candy, who delivered an insightful
weather report on Wednesday night's Jimmy Kimmel show. I get it now. But I can't remember a word of what she actually said. A trend?
What I'd Give To Be On This Boat. Heck, a kayak and 50 degrees would look good right about now. Dream on...
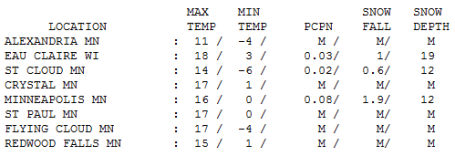
Another Snow-Burst. Officially 1.9" of snow fell Thursday at MSP, in roughly 2 hours. Yes, it was really coming down for a time during the late morning as the clipper raced across the state.
That brings us up to 49.9" for the winter season so far. That's how much we normally get during an entire winter season (the rolling 30 year average) and we have that as of January 13! St. Cloud picked up .6", highs statewide in the teens.
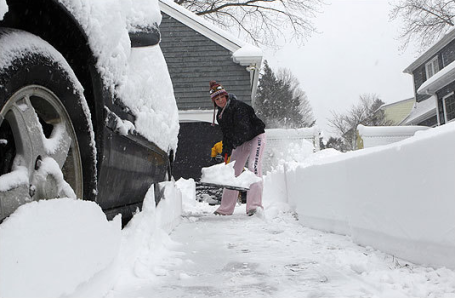
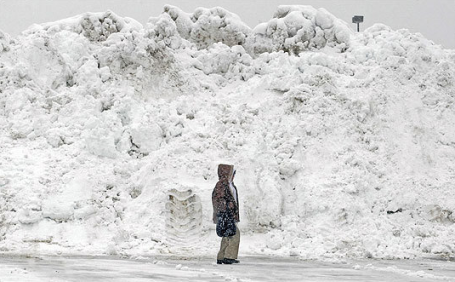
Mountains of Snow. Photo courtesy of the Boston Globe. (some days I feel like that guy). What's the word? Forlorn. Overwhelmed. Awed. Humbled. In spite of all our technology (and smarts) there's not a darned thing we can do to stop Mother Nature from making her appointed rounds. Weather modification? Not in our lifetime, not on a large scale. Besides, if you were to start a company and start tinkering with the weather, your business would be composed entirely of lawyers. Not good.
Paul's Conservation Minnesota Outlook for the Twin Cities and all of Minnesota:
TODAY: Mostly cloudy with snow developing PM hours.. Roads get slippery again late in the day and at night. Winds: Winds: S 5-10. High: near 20
FRIDAY NIGHT: Snow likely, totals of 1" possible, 2" north/east of the metro. Low: 9
SATURDAY: Flurries taper, colder wind kicks in. High: 13
SATURDAY NIGHT: Patchy clouds, getting colder. Low: -3
SUNDAY: More clouds, few flakes capable of a coating. Even colder. High: 8
MONDAY: Clipped again, Couple inches late? Low: -4. High: 16
TUESDAY: Light snow tapers to flurries with improving travel. High: 10
WEDNESDAY: Cold sun, hardly record-setting. Low: -6. High: 8
THURSDAY: Sun snuffed out, some recovery. High: 18
A 70-80" Winter?
Bear with me here. I'm not a math major, don't play one on TV. After tonight's clipper (2" possible) we should have 50-51" for the winter season so far. Based on a rolling 30 year average from the National Weather Service, we SHOULD pick up another 28.8" by April (7" the second half of January, 8.2" February, 10.4" March, 3.1" April, .1" May). Then again, you can prove anything with statistics.
I was amazed how bad the roads were yesterday, after a lousy inch of snow. What happened? When it's colder than 10-15 F traffic literally compacts snow into a thin film of ice; it seems to take at least 1-2 hours for MnDOT chemicals to kick in and start to melt the icy concoction. I know, an inch qualifies as "flurries", but some days it's not the amount, it's the air temperature as the snow is falling.
Our incredible shrinking cold wave arrives next week, maybe 3 or 4 subzero nights all week. But this looks like a glancing blow of Siberian air, nothing prolonged or horrific. We can take it. A more moderate, Pacific flow returns the last week of January; 20s should feel good. Snowmageddon? Don't see it: maybe a couple inches next Tuesday, again late-month. 70-75" by late April? Maybe.
Weather Geek Alert. The forthcoming Motorola XOOM tablet will have a built-in barometer, which is pretty cool, possibly a sign of future (meteorological) attachments, add-ons to come. More from Engadget
here.
2010 Tied 2005 As Hottest Year, Climate Figures Show. From a
story in the New York Times: "
New government figures for the global climate show that 2010 was the wettest year in the historical record, and it tied 2005 as the hottest year since record-keeping began in 1880. The new figures confirm that 2010 will go down as one of the more remarkable years in the annals of climatology. It featured prodigious snowstorms that broke seasonal records in the United States and Europe; a record-shattering summer heat wave that scorched Russia; strong floods that drove people from their homes in places like Pakistan, Australia, California and Tennessee; a severe die-off of coral reefs; and a continuation in the global trend of a warming climate."
* It was the 34th year running that global temperatures have been above the 20th-century average; the last below-average year was 1976. The new figures show that 9 of the 10 warmest years on record have occurred since the beginning of 2001.(source: NYT, NOAA, NASA).
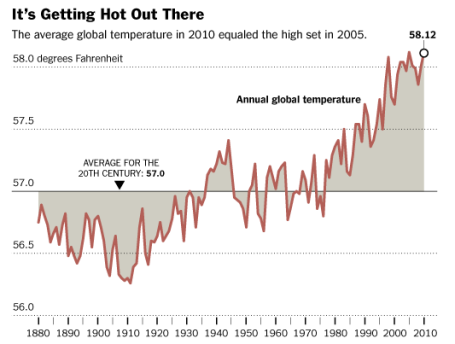
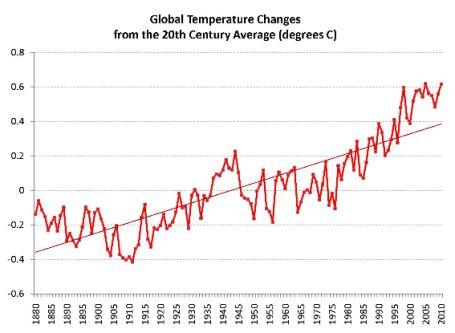
The Graph That Should Be On The Front Page Of Every Newspaper In America. From Peter Gleick, a water and climate scientist at the Pacific Institute: "
Climate change is worsening, fast. The National Climate Data Center of the National Oceanic and Atmospheric Administration has just announced that for the entire planet, 2010 is the hottest year on record, tied with 2005. And the period 2001 to 2010 is the hottest decade on record for the globe. The actual data are here. This graph and this information should be on the front page of every newspaper in the world. Every Congressional representative should see it.


No comments:
Post a Comment