32 F. high in the Twin Cities Tuesday.
27 F. average high for February 7 at KMSP.
23 F. high temperature one year ago, on February 7, 2011.
-29 F. today's record low in the Twin Cities (most recently in 1991).
+ 13.4 F. Temperatures during the first week of February are running more than 13 degrees above average.
+ 18.8 F. Duluth temperatures are running nearly 19 degrees above average since February 1.
+ 20 F. Temperatures at International Falls since February 1 averaging 20 degrees above normal.
+5.5 F. January temperatures across the lower 48 states were 5.5 F. warmer than the 1901-2000 averages. Source:
NCDC.
$2 million. The amount of money that the City of Minneapolis has saved on snow removal so far this winter.
4th warmest January on record for the lower 48 states. USA Today has details below.
Driest winter on record for much of the Red River Valley. Source: inforum.com.
1 million square miles of snow cover in January. "
According to data from the Rutgers Global Snow Lab, the average snow cover in January was 1 million square miles, which was 329,000 square miles below average. This marked the 3rd-smallest January snow cover extent in the 46-year period of record." - from a USA Today article on January climate below.
Record cold January for much of Alaska. Check out the details from KTVA-TV
here.
300. As many as 300 tornadoes/year may touch down on Europe, according to estimates from local meteorologists. By comparison the USA sees an average of 1,000 tornadoes/year - most in the world.
 February 8, 1835
: A severe cold wave gripped the southeastern U.S. The mercury dipped to 8 above at Jacksonville FL, and to zero at Savannah GA. Orange trees were killed to the roots.
"
If you count all your assets, you always show a profit." - Robert Quillen
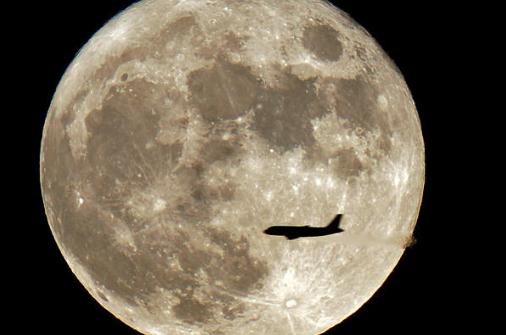
Snow Moon. "A jet is silhouetted on the full moon in St. Petersburg, Russia, early Thursday, April 29, 2010. This month’s full moon is known as a ‘milk moon’ in English-speaking countries. Photo: Dmitry Lovetsky/AP.
158.5. "
The three New Madrid 8.0 earthquakes were 158.5 times bigger than the 5.8 (Virginia) quake in August (2011) and almost 2000 times stronger in terms of total energy released." - from a Capital Weather Gang article about the growing potential for a devastating earthquake on the New Madrid fault, impacting St. Louis and Memphis. Details below.
1991. The current cold wave and heavy snow is the most severe to hit Europe and northern Africa since February, 1991. Source:
Wunderblog. Photo above courtesy of AP/Jens Meyer.
 Global Weirding
. "
Some of this research shows that sea ice loss may favor winters with predominately negative phases of the Arctic Oscillation. One potential result of global warming, referred to as the “Arctic Paradox,” is that sea ice loss can help warm the Arctic during the winter, while setting in motion a chain reaction of events that make winters colder than they otherwise would be in Europe and the U.S." - from an article below on how changes in the Arctic (and stratosphere)
may be impacting global weather circulations.
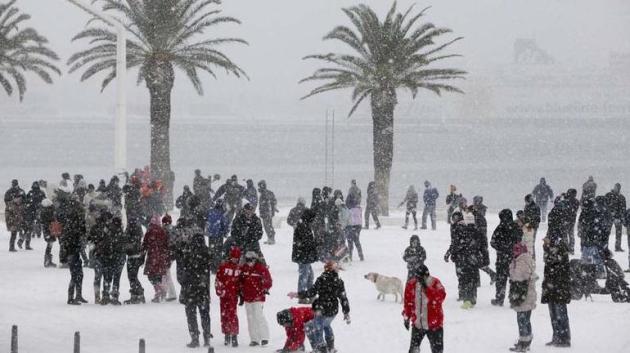
Palm Trees...And Snow? Germany's
Tagesschau.com has some amazing photos of the snow and bitter cold gripping all of Europe. Photo above courtesy of Reuters.
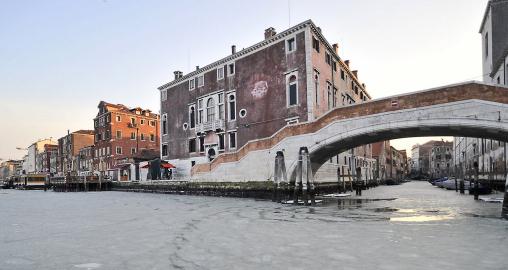
Frozen Canals In Venice. I can't remember the last time I saw this - the gondoliers have to be pretty irritated (along with everyone else in Europe and northern Africa). Details: "
A view of the north lagoon, partially iced because of unusually low temperatures, in Venice, Italy, Monday, Feb. 6, 2012. Schools will be closed in Rome on Tuesday, as Italy copes with unusually heavy snow for the Mediterranean country. So far, ten deaths have been linked to winter weather, including two people who were crushed under a collapsed roof south of Rome, and a 91-year-old woman in the northeast port of Trieste who was knocked down by strong winds. In the north, rescuers had to pluck people from their homes, as piles of snow reached 3 meters (10 feet) in some areas. In Milan, Italy's fashion and financial capital, temperatures fell to minus 12 Celsius (10 Fahrenheit) on Monday, and the authorities opened a section of the city subway to shelter some 100 homeless people. (AP Photo/Luigi Costantini)."
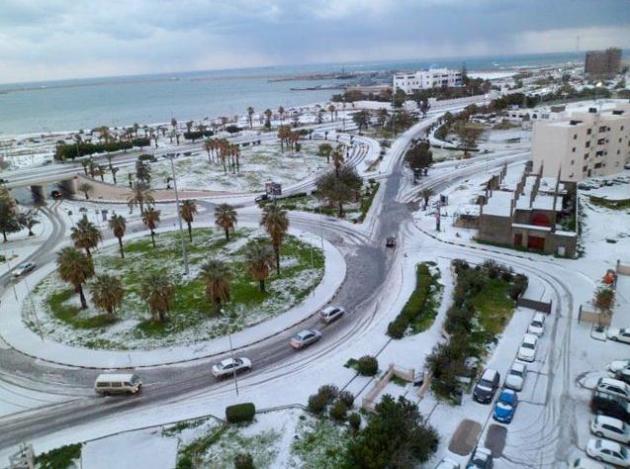
Harsh Winter Weather Continues In Europe; Rare Snowstorm Hits Libya. Dr. Jeff Masters has a good recap of the wild and wintry weather gripping Asia, Europe, even northern Africa in his weekly
Wunderblog: "
Europe's winter onslaught continues unabated this week, with very cold temperatures and heavy snows over much of the continent. Yesterday, a rare snow storm hit North Africa, bringing 2 - 3 inches of snow to Tripoli, Libya. It was the first snow in Tripoli since at least 2005, and may be the heaviest snow the Libyan capital has seen since February 6, 1956. Across Europe, at least 250 deaths have been blamed on the winter weather since the cold spell began on January 26. Hardest hit has been Ukraine, with 135 deaths--mostly of homeless people. According to weather records researcher Maximiliano Herrera, the current cold snap is the most severe for Europe since February 1991."
Photo credit above: "
The scene in Tripoli, Libya, on February 6, 2012, after a rare snowstorm. Image credit: libyall.com." An estimated 40,000 Libyan troops have been deployed to clear streets and help the sick.
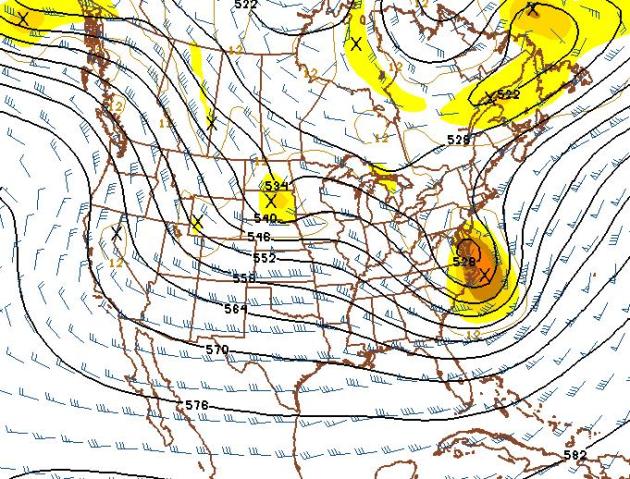
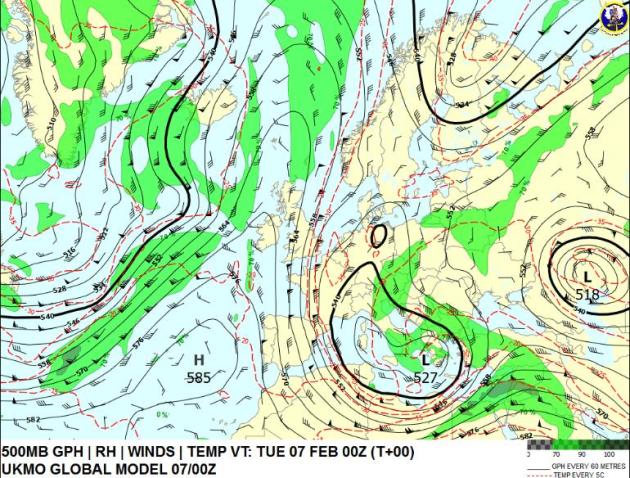
Wild Gyrations. Check out the 500mb wind flow across Europe, upper level winds have buckled dramatically, plunging bitter air as far south as Africa, a vast upper level low temporarily stalled over Italy. This holding pattern has kept a steady flow of numbing air pouring southward across the British Isles into France, Germany and Italy, a blocking pattern preventing the cold low from moving out anytime soon. More records will fall in the days ahead. Map courtesy of the
21st Operational Weather Squadron.
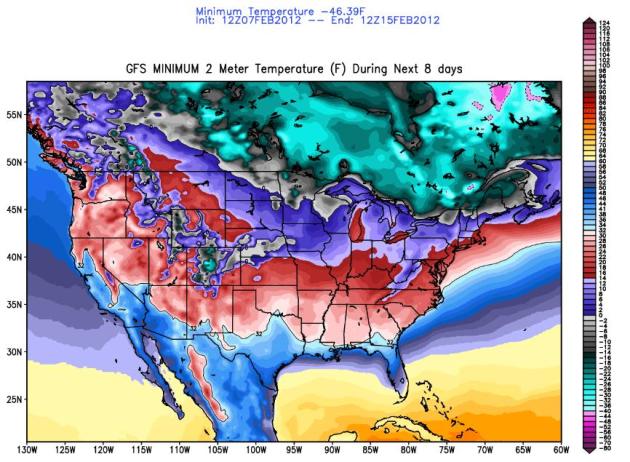
Brushed By Arctic Air. This map, courtesy of
policlimate.com, shows the coldest air temperature expected over the next 8 days, the zero-line running from Fargo to St. Cloud into western Wisconsin....parts of upstate New York and northern New England may dip just below zero by the weekend. Not as cold as last month, but chilly enough to get your attention.
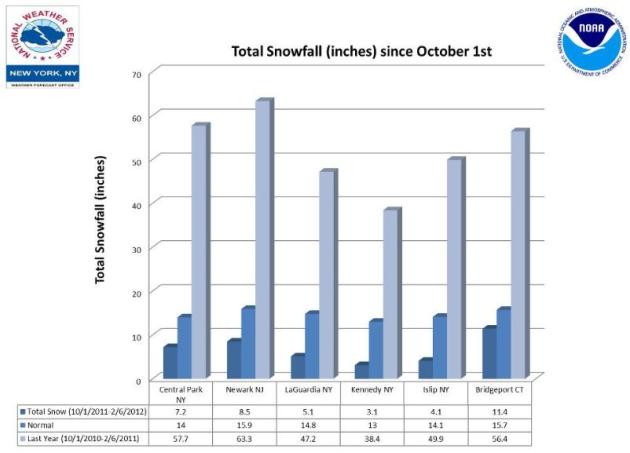
The Snow-Less Big Apple. Check out the stats from the New York office of the National Weather Service. So far only 7.2" snow has fallen on New York City, in stark contrast to the 57.7" that had fallen as of last year. More details from the NYC Weather Service
Facebook page: "
The following graph shows total snowfall for the climate sites since October 1st (10/1/2011-2/6/2012) and compares it to normal for this time period as well as the same time period the previous year (10/1/2010-2/6/2011)."
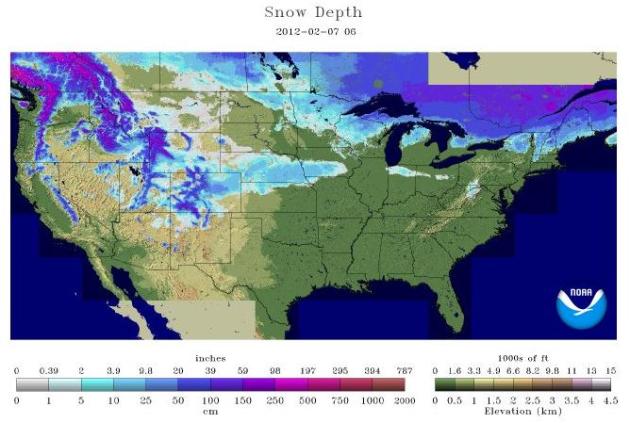
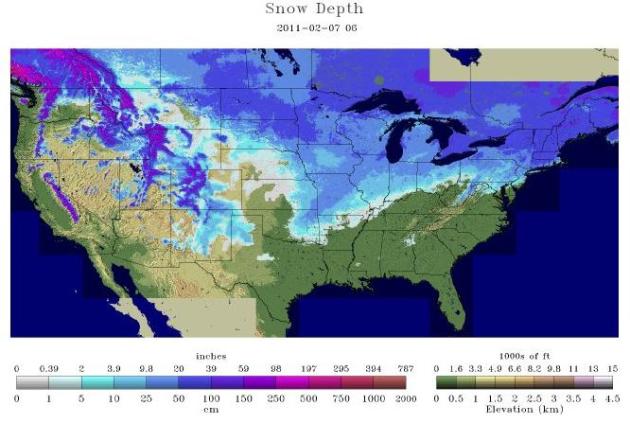
February 7, 2012 February 7, 2011
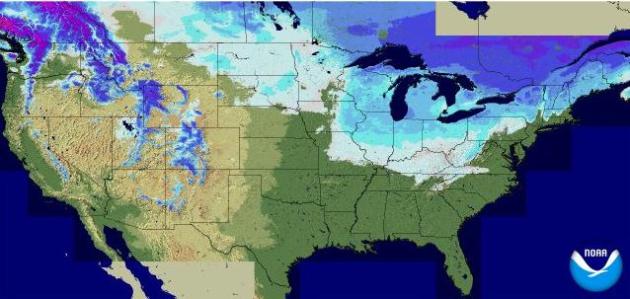
National Snowcover as of February 7 (lower 48 states of the USA). Source:
NOAA.
2012: 25.5%
2011
: 48.9%
2010
: 60.8%
2009
: 33.2%
2008
: 51.1
2007
: 38.9%
2006
: 26.6%
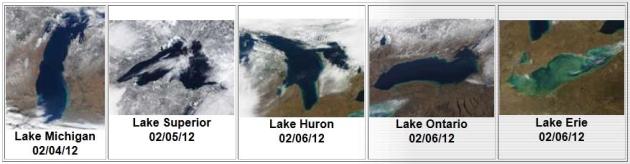
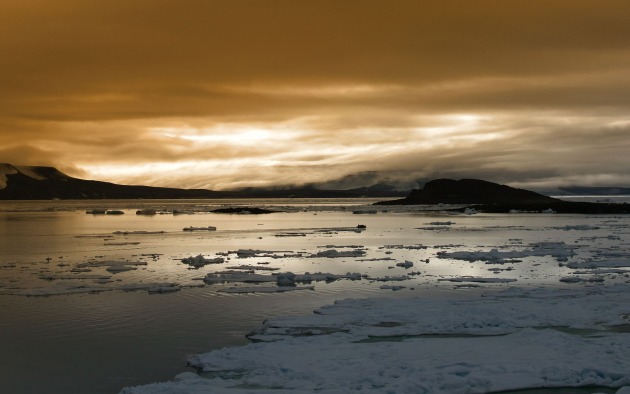
Lack Of Ice On Great Lakes. The Wilmington, Ohio office of the National Weather Service has a
good recap of the state of ice on the Great Lakes this winter. The maps look like early November, not early February: "
These striking satellite images of the Great Lakes from February 4-6 came from NASA polar orbiting satellies equipped with special observing instrumentation known as MODIS (Moderate Resolution Imaging Spectroradiometer). One can see only a little ice cover over the northern and western bays and inlets of Lake Superior. Lake Michigan currently exhibits only patchy ice cover in Green Bay, and Lake Huron has only a small area of ice visible in Saginaw Bay and very little in its typically ice-covered northern areas. While ice usually forms over the northeastern fringes of Lake Ontario by this time of year, none can be easily seen at this time. And while much of Lake Erie is ordinarilly covered by ice this time of year due to its relatively shallow depth, only a small amount of ice can be seen over the western portion."
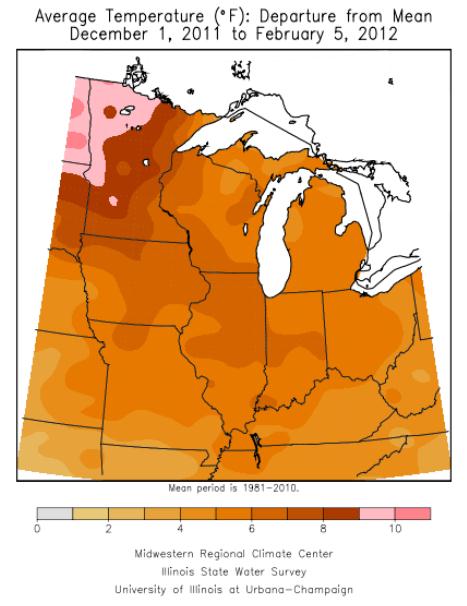
Since December 1: 6-11 Degrees Above Average. Check out the
temperature anomalies since December 1 across the Great Lakes and Upper Midwest, courtesty of the Midwestern Regional Climate Center at the University of Illinois at Urbana-Champaign.
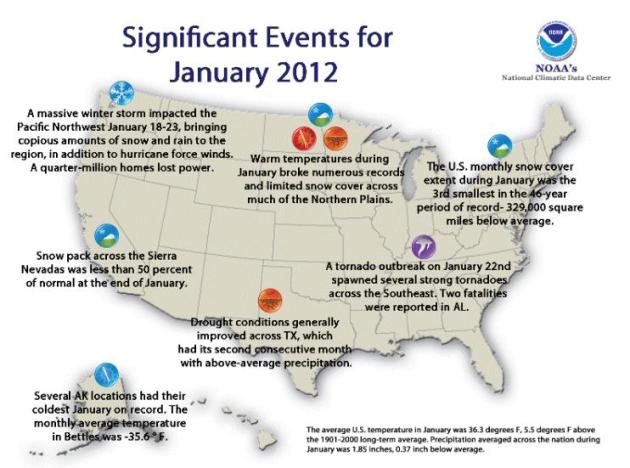
January Was USA's 4th Warmest On Record. The details from
USA Today:
"The warmth last month wasn't a mirage: January 2012 was the USA's 4th-warmest January on record, federal climate scientists announced on Tuesday. The national average temperature in January was 36.3 degrees F, which is 5.5 degrees F above the long-term average and the warmest since 2006, according to the National Oceanic and Atmospheric Administration's National Climatic Data Center. The other warmer Januarys were in 1990 and 1953. The data is based on records dating back to 1895."
January Climate Highlights. Last month was 5.5 F. warmer than the 1901-2000 average, according to NCDC, the
National Climatic Data Center, a division of NOAA . Here are a few highlights:
- The average contiguous U.S. temperature in January was 36.3 degrees F, 5.5 degrees F above the 1901-2000 long-term average — the fourth warmest January on record, and the warmest since 2006. Precipitation, averaged across the nation, was 1.85 inches. This was 0.37 inch below the long-term average, with variability between regions. This monthly analysis is based on records dating back to 1895.
- Many locations across the Northern Plains exceeded all-time warm January maximum temperature records during the month, including Minot, North Dakota, which reached 61 degrees F on January 5th. This surpassed the previous record of 59 degrees F for the city, set on January 28th, 1906.
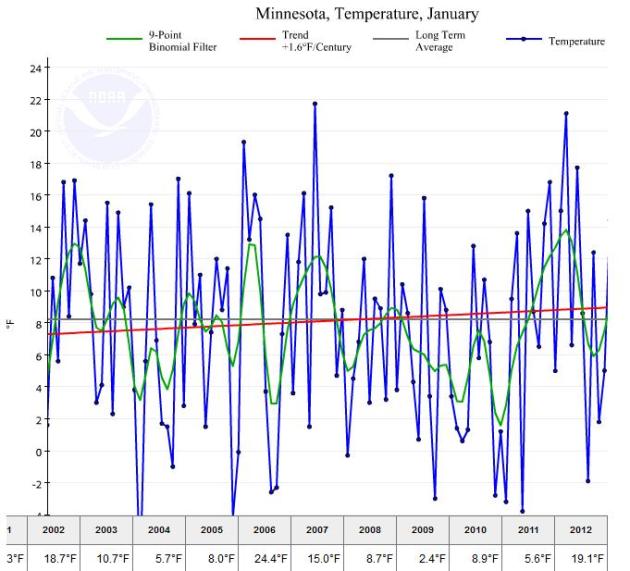
Minnesota January Temperature Trends. With an average temperature of 19.1 F. only 2006 was warmer, statewide. 1944 was another unusually mild January. More details from NCDC
here.
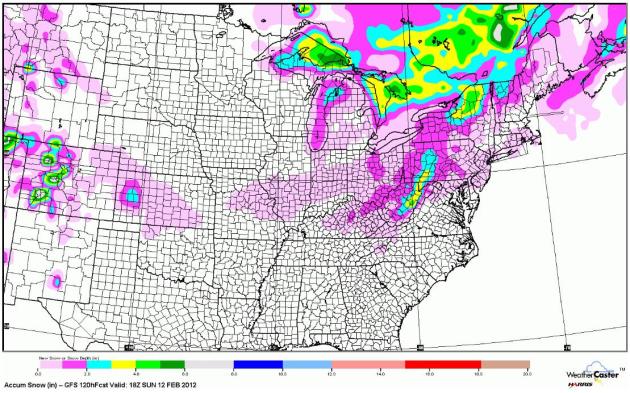 Ditto. The Same. No Change
. I
feel like Bill Murray in the movie "Groundhog Day", forever sentenced to repeating the same day (until I get it right). Seems like I keep recyling the same snowfall prediction map. One more time: the GFS shows an utter lack of accumulating snow into midday Saturday across the Upper Midwest, the only snow showing up downwind of the Great Lakes (lake effect snow). Again, the maps look like something out of late October or early November.
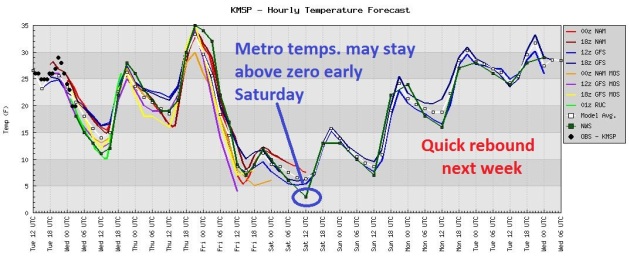 Fleeting Goosebumps
. No, it won't get as cold as it did back in January, when MSP
experienced 4 nights at or below zero (Jan. 18-21). That was the low point, the nadir, the depth of winter, the bottoming-out point. The urban heat island (more homes, industry, asphalt, etc) may keep immediate metro temperatures just above zero Saturday morning, but I
expect the suburbs to dip below zero (for only the 4th time all winter). Temperatures reach the mid 30s tomorrow before tumbling Thursday night and Friday, and then climb back up above freezing by Monday and Tuesday.
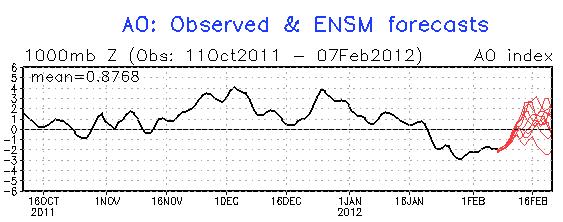
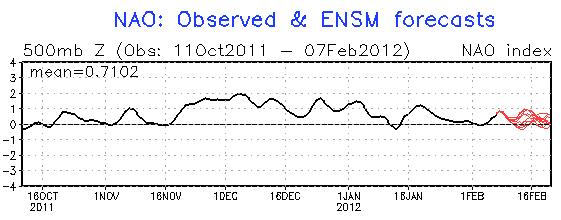
Trending Milder Again? Both the AO (Arctic Oscillation) and NAO (North Atlantic Oscillation) show indices at or above zero by mid February, implying stronger westerly winds aloft - a tendency for the coldest Canadian air to remain locked up in central and northern Canada. More from CPC
here. When both the AO and NAO are strongly negative, the odds of severe cold (and significant snow) seem to rise across the lower 48 states. Although the AO went negative in late January and early February the NAO has been neutral to slightly positive.
Theories about, including the possibility that melting arctic ice is triggering a domino effect, displacing the coldest air away from the pole. This winter the jet buckled over Europe, not North America, which may just be random atmospheric variability. Another theory: stratospheric winds. When winds 15-25 miles above the ground ease winds in the troposphere (where all the weather occurs) can also ease, increasing the potential for bitter air to plunge southward. Further complicating matters:
global warming may be warming the stratosphere, with uncertain consequences. It's the ultimate puzzle, and although we're learning more every year - there is still much we don't understand about complex circulations in the stratosphere, and how changes in the Arctic are impacting weather patterns worldwide. We'll see more cold fronts, but I'm still fairly convinced that the coldest temperatures of winter are now behind us. Famous last words.
 Peering Out Over The Horizon.
 The 384 GFS outlook for steering winds aloft (500 mb) show a series of clipper impacting Minnesota, temperatures still trending at or slightly above average the last week of February. The map above is valid February 23. I
have a hunch the pattern will favor significant snow for the northeast, but there's no sign our dry spell will let up anytime soon.
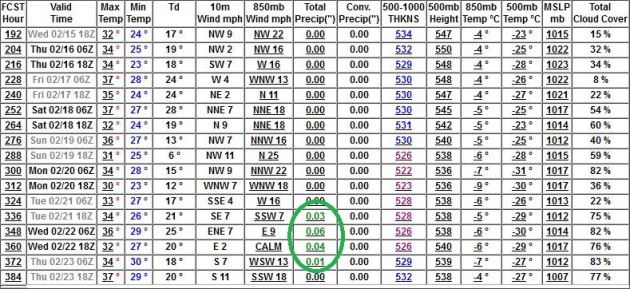 Paul, Will It Snow (In My Lifetime)?
 The short answer is yes, but nothing I'd be bold enough to label a "storm" is brewing. The GFS model prints out a whopping .14" liquid around February 22, which may (or may not) translate into a sloppy inch of snow. Wow. It's come to this. Highs from Feb. 15 to Feb. 23 reach the 30s fairly consistently; I wouldn't be surprised to see a few days above 40.
"
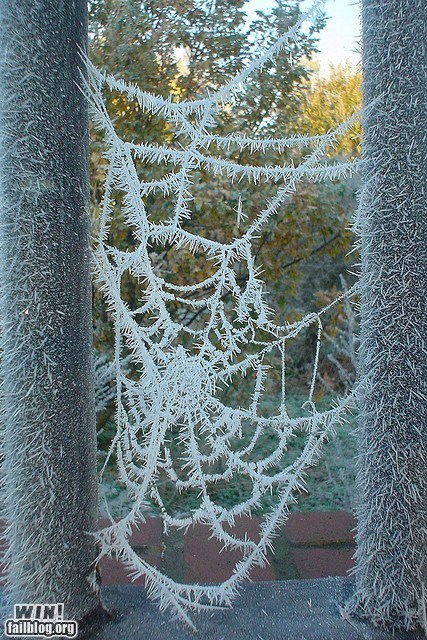
Winter is not a season, it's an occupation." - Sinclair Lewis
Frozen Web. Now that's one persistent spider. Thanks to
failblog.org for passing this one along.
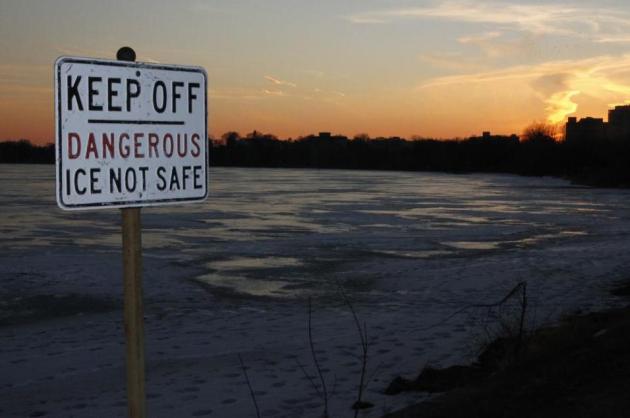
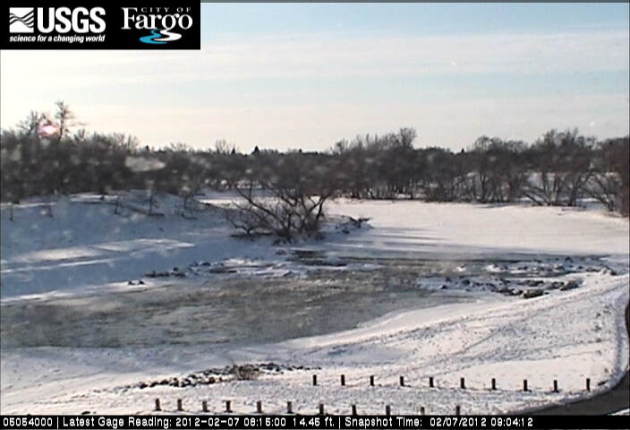
Red River Flows Well Above Average Despite Driest Winter On Record. Fargo's
inforum.com has the details: "
The Red River’s volume of water is flowing at more than twice its long-term average this winter despite months of abnormally dry weather. But the flows are less than a third of last winter’s gushing volume as of Feb. 1, as the area experiences its driest winter on record to date. The above-normal flows on the Red River, Missouri River and many other rivers in the region are a lingering effect of last year’s record water volumes. “2011 was the biggest flood year that we’ve seen in the area and the region,” Greg Gust, a National Weather Service meteorologist, said Monday. “It was a record year for North Dakota. It was a record year for much of the northern Plains.” Live Fargo webcam above courtesy of
USGS.
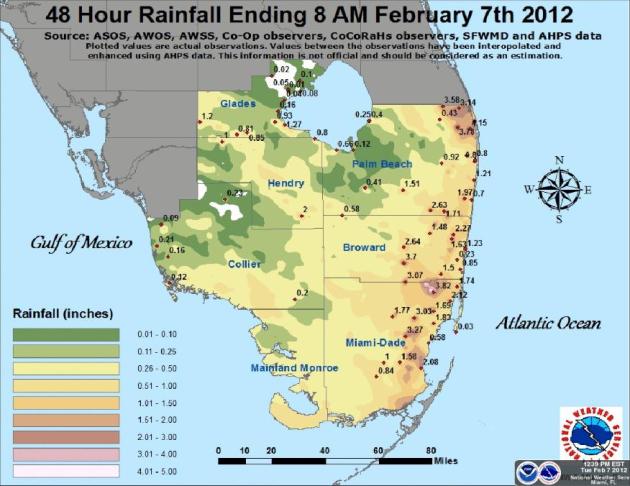
Florida Soaking. Much of south Florida picked up 1 to 3.5" of rain in the last 3 days, nearly a month's worth of rain in less than 72 hours. Source: NOAA.
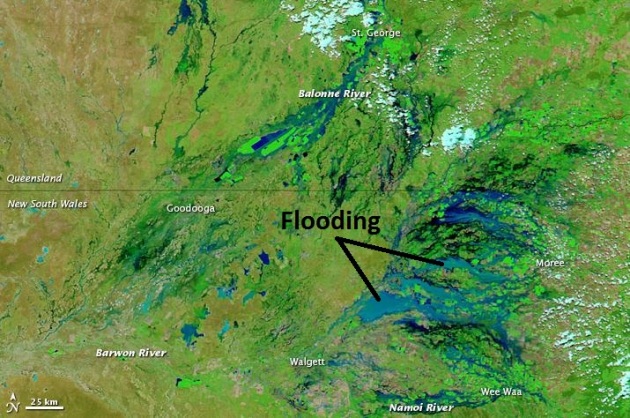
Severe Flooding Down Under. NASA's
Earth Observatory has more details on widespread flooding across Australia: "
Severe flooding affected multiple communities along Australia’s Queensland-New South Wales border in early February 2012. On February 5, 2012, the Australian Associated Press reported that several thousand residents were isolated from the outside world by a “virtual inland sea.” The Moderate Resolution Imaging Spectroradiometer (MODIS) on NASA’s Terra satellite captured the top image on February 6, 2012. For comparison, the bottom image shows the same region a month earlier, on January 3, 2012. These images use a combination of visible and infrared light to better distinguish between water and land. Water varies in color from electric blue to navy. Vegetation is bright green. Bare ground is earth-toned. Clouds are pale blue-green."
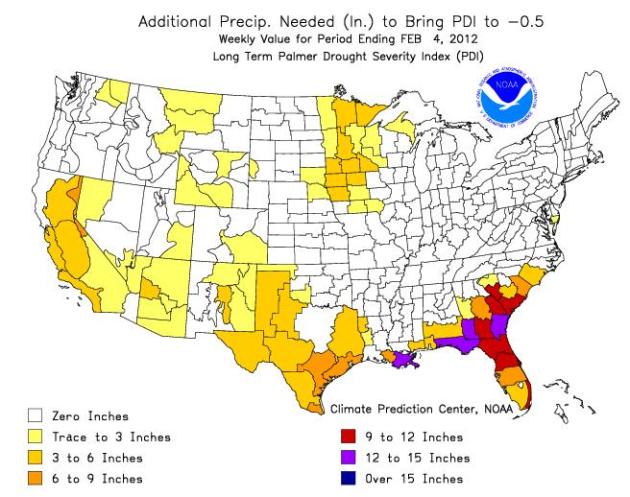
Rainfall Needed To Ease Drought. Much of Minnesota is running a 6-9" rainfall deficit, but the drought is much worst from New Orleans to Panama City and Savanah, where 12-15" needs to fall to erase a growing drought. Map: NOAA.
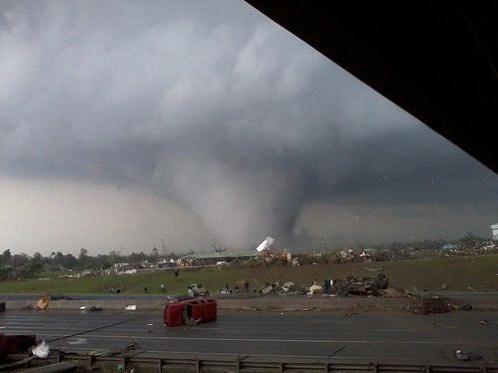 Lessons From The Tuscaloosa Tornado
. Here's an interesting article from
The Red And Black on what first responders and city authorities learned from last spring's devastating tornado in Tuscaloosa, Alabama: "
The tornado that struck Tuscaloosa, Ala. in April 2011 was among the most damaging storms of the past year. It significantly destroyed the community and put considerable strain on the University of Alabama’s Office of Emergency Prepardness as they dealt with a the kind of disaster many institutions hope they never have to see. Donald Keith, the director of the University of Alabama Emergency Preparedness, gave a lecture at the Tate Student Center that focused on what his university had learned from the storm — and what the University here can do in case of devastating weather."
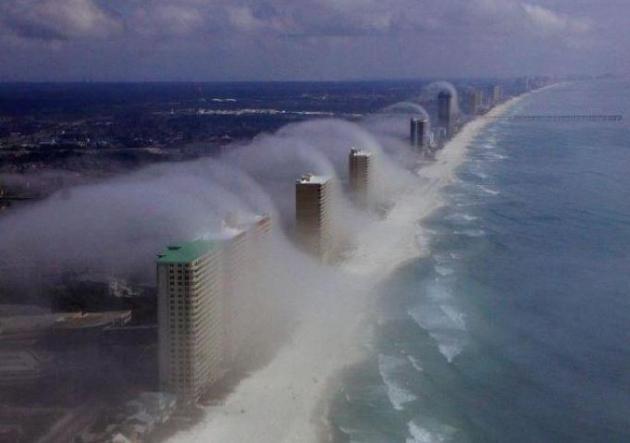
Photo Of The Day. This is one of the most amazing (and peculiar) photos I've ever seen, passed along by Panhandle Helicopter in Panama City and Rob Marciano over at CNN (via
yfrog.com). The air along the Gulf Coast was close to saturation (temperature close to the dew point). Humid air rising up and over the condos triggered just enough upward motion for condensation to occur; clouds forming on the ground (fog). A remarkable sight.
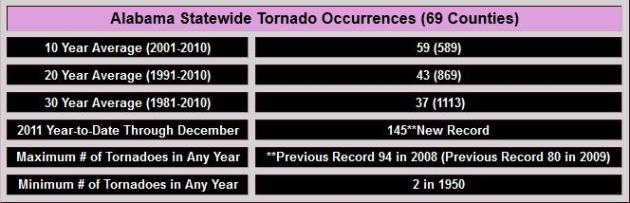
"Dixie Alley" The most tornadoes last year...Texas, Kansas, Oklahoma? Not even close. It was Alabama, with a record 145 tornadoes (roughly the same number Minnesota experienced in 2010, our wettest year on record). The big different. Last year those Alabama tornadoes hit heavily populated areas, like Tuscaloosa and Birmingham. More from NOAA
here.
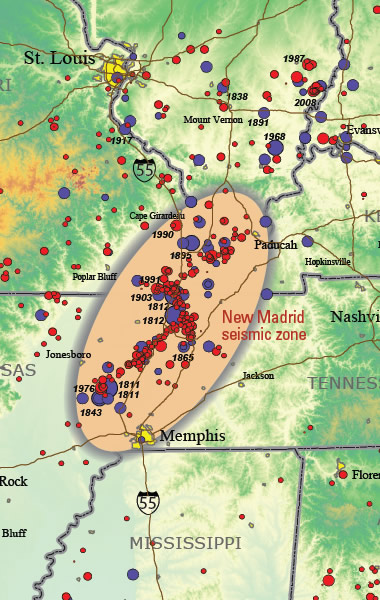
Bicentennial Of The New Madrid Earthquake Sequence: Can It Happen Again? The Washington Post's
Capital Weather Gang has the story. God forbid the New Madrid earthquake fault ever comes to life again - St. Louis and Memphis could experience widespread devastation: "
This winter is the bicentennial (200th) anniversary of the New Madrid, Missouri earthquakes, a series of the most powerful earthquakes to strike the eastern U.S. in recorded history. Three of the quakes in the series are estimated to have reached a magnitude between 7.0 and 8.0. The first earthquake occurred on December 16, 1811, the second on January 23, 1812, and the third on February 7, 1812 - exactly 200 years ago to date. New Madrid was the closest settlement to the epicenters of the immense tremors. According to eyewitness accounts it was totally destroyed. At the time, most of the region, including many of the larger cities such as St. Louis were only sparsely populated with few permanent structures. Consequently, deaths and damages were limited. Should a comparable sequence of earthquakes occur now, it would have consequences above and beyond any natural disaster the U.S. has ever experienced (and not in a sci-fi movie!)." Image above courtesy of
geology.com.
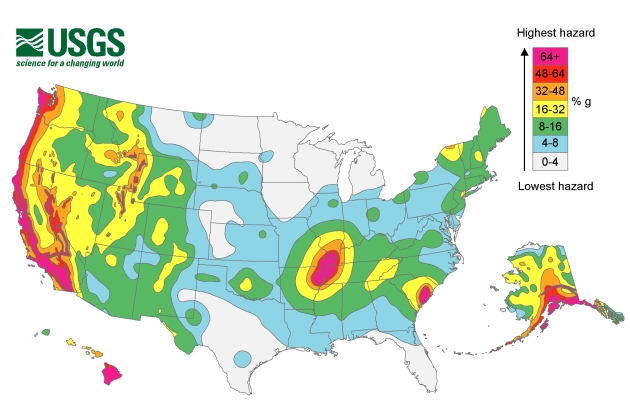
Feeling Better About Minnesota's Cold Fronts. Here is an earthquake hazard map, showing fault locations and overall earthquake risk for the USA. The risk of a major tremor is just as great in Memphis and St. Louis as it is along the well-publicized San Andreas fault in California. Source:
USGS.
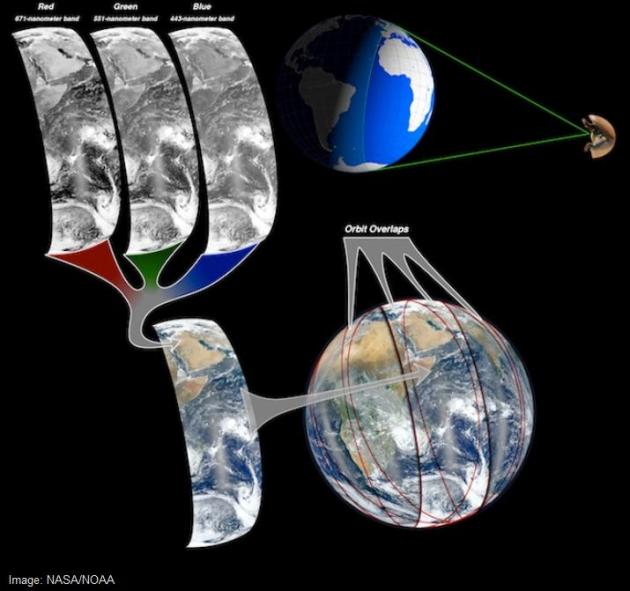
How NASA Makes Those Incredible High-Res Images Of Earth.
Wired Science has a fascinating article about those high-res, up to 250 meter resolution images we all tend to take for granted: "
In recent weeks, a pair of high-resolution images of the Earth has captivated the public. Taken by the Suomi NPP satellite, these pictures portray our planet’s incredible beauty with 8,000- by 8,000-pixel and 11,500- by 11,500-pixel detail. How were these highly detailed images created? The satellite flies 512 miles above the Earth, but the images appear as if they were taken from a much higher perspective: an altitude of 1,242 for the first image and 7,918 miles for the second. This little trick was accomplished by stitching together data from several orbits, creating an image that appears to be “pulled back.” NASA launched the 4,600-pound Suomi in October to remotely sense variations in the Earth’s oceans, continents, and atmosphere and get a better understanding of climate change. It passes directly from pole to pole 14 times a day, imaging 1,865-mile swaths of our planet with each trip."
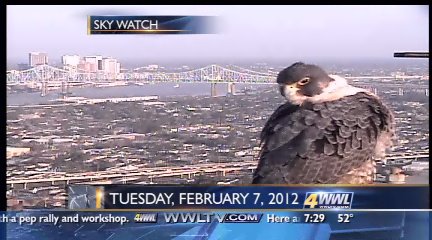 Falcon-Cam
. Viewers of WWL-TV (New Orleans) had quite a surprise when they tuned in Tuesday morning: "
A surprise on our skywatch camera this morning - a falcon! He (or she) sat on the platform for our camera for almost an hour. Wonder if he knew all of Southeast Louisiana was watching!" Check it out on their
Facebook page.
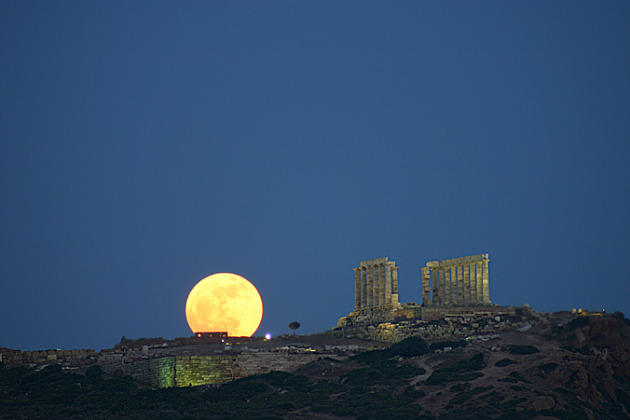
Welcome Snow Moon. Why Does It Appear So Much Larger On The Horizon? WJLA-TV's Bob Ryan has a
good explanation about this optical illusion. The truth: the moon is the same size near the horizon as it is at the zenith, directly overhead. But our brains perceive the moon as larger near the horizon, because we assume it's closer to our location. Confused? Here's an explanation: "
Moonrise is at 5:44 p.m. this evening. A perfect time of the year (not too early . . .not too late) to see one of the great tricks there is. How big do you think the rising Full Moon is? Why is it so huge when it rises tonight but then looks smaller high in the sky around midnight? After all, the Full Moon is really 4000 miles closer to us (the earth's radius) at midnight than at moonrise. Shouldn't it look larger overhead when it is closer than on the horizon? Yes it is but no it doesn't. OK enough of trickery by me. A little explanation here." Moonrise photo courtesy of NASA.
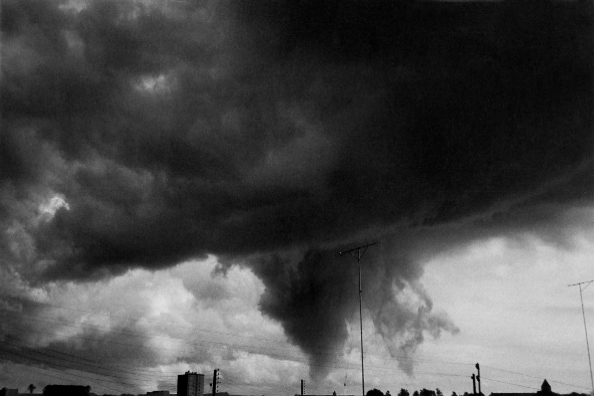
Tornadoes Not A Uniquely American Phenomenon; Europe Gets Its Share, Too.
Stars and Stripes has the details: "
The sudden, violent and awe-inspiring nature of tornadoes has made them common fodder for legends. For example, Pecos Bill is said to have lassoed a tornado, leaped onto its back and rode it across the Texas plain until it had calmed itself. Here’s another one: Europe has no tornadoes. That, too, is a tall tale of Bunyanesque proportions. Europe has plenty of tornadoes, perhaps 300 or more a year, according to a study by Nikolai Dotzek, a scientist with the Institute of Atmospheric Physics — in Wessling, Germany. That figure includes roughly 170 observed tornadoes in 25 countries and an educated guess that about 130 others were not reported because they dropped from the sky too briefly to be observed or landed unseen in unpopulated areas of the continent." Photo above shows a tornado/waterspout that touched down on northern France in 1961, courtesy of
Skywarn Germany.
 "App Economy" Has Created Nearly Half A Million Jobs Since 2007
.
Mashable.com has the details: "
That app you use to play Words with Friends on your phone or book a reservation using Open Table might be giving the American economy a nice boost, at least according to a new survey by TechNet. The new “app economy” has created about 466,000 jobs in the United States since 2007, according to the survey. “America’s App Economy – which had zero jobs just 5 years ago before the iPhone was introduced – demonstrates that we can quickly create economic value and jobs through cutting-edge innovation,” Rey Ramsey, President and CEO of TechNet, said on the company’s blog. “Today, the App Economy is creating jobs in every part of America, employing hundreds of thousands of U.S. workers today and even more in the years to come.”
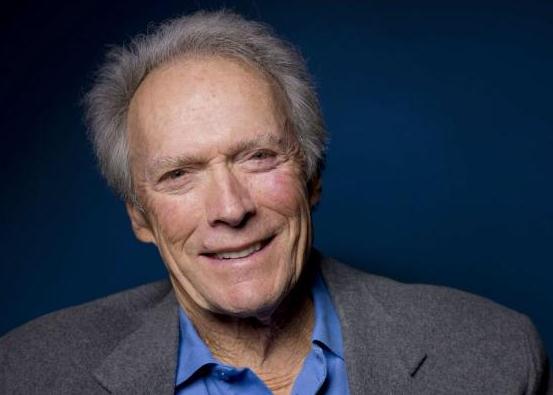
Superbowl Ads Vs. Campaign Ads. I liked John Rash's take on the (much hyped/much-debated) Clint Eastwood Chrysler spot during the Superbowl, in Tuesday's
Star Tribune: "
The best political ad of 2012 may have already aired -- during Sunday's Super Bowl. Only it wasn't for a candidate, or a cause, but a car company: Chrysler. "It's Halftime in America" defined the themes of the election better than the candidates have. "It's halftime," narrator Clint Eastwood begins. "Both teams are in their locker room discussing what they can do to win the game in the second half. It's halftime in America, too. People are out of work, and they're hurting. And they're all wondering what they're going to do to make a comeback. And we're all scared, because this isn't a game."
"Supergiant" Shrimp-like Beasts Found In Deep Seas. (Bad) sushi anyone? Good grief.
National Geographic has more details:
"Marine scientists have hoisted up a mysterious new species of "supergiant" amphipods from one of the deepest ocean trenches in the world, scientists announced Thursday Seven of the pinkish, shrimp-like animals crawled into a trap left in the Kermadec Trench, an abysmal rift in the seafloor off the northern coast of New Zealand that sinks down 6.2 miles (10 kilometers). The largest amphipod measured in at 11 inches long (28 centimeters)—nearly three times larger than the previous record-holder—and was captured at a depth of about 4.35 miles (7 kilometers). It's not yet clear whether the newfound giants represent a new species or just especially big supergiant amphipods."
KNOP-TV Airs Will Ferrell Superbowl Ad; GM Calls It Odd. Will Ferrell odd? I prefer "quirky". It's worth a look, if you haven't seen it yet.
TVSpy.com has the details: "
KNOP in North Platte, Nebraska has a unique distinction: it was the only station in the country to air an Old Milwaukee commercial featuring Will Ferrell during Sunday’s Super Bowl. After airing on KNOP, in the second-smallest market in the country, the ad went viral on Monday, edging out actual Super Bowl ads as the topic of watercooler conversation. Back in North Platte, KNOP general manger Lewys Carlini thinks the whole thing is a bit strange."
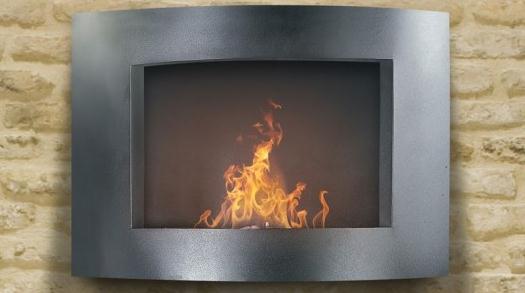
Pureflame Let's You Hang A Fireplace On Your Wall. What will they think of next? Kind of a cool concept, I guess.
Gizmag.com has more information: "
At this time of year, many of us living in the upper reaches of the Northern Hemisphere start wishing that we had a fireplace in our home. Unfortunately, installing a fireplace and chimney in a house that doesn't already have them is quite an involved and expensive process. Here's a solution in the form of a functioning fireplace that you simply hang on the wall like a picture - it's made by a company called Pureflame."
 A November Without End
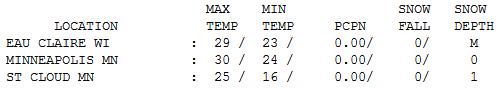
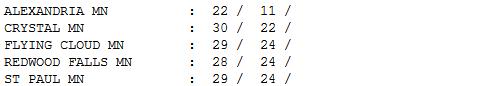
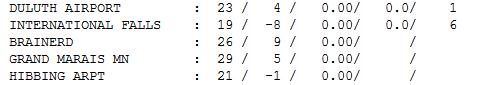
. I can't tell you how much the weather maps look like early November, not early February. Tuesday highs ranged from 19 at International Falls to 25 St. Cloud, 30 in the Twin Cities. Duluth is reporting 1" snow on the ground, but all the webcams I see show a very brown Duluth. The most snow at any reporting station? International Falls is reporting a whopping 6".
"
The antidote for fifty enemies is one friend." - Aristotle. Photo courtesy of
wikipedia.
Paul's Conservation Minnesota Outlook for the Twin Cities and all of Minnesota:
TODAY: Bright sun, seasonably cool. Winds: W 10-15. High: 29
WEDNESDAY NIGHT: Patchy clouds, seasonably cool. Low: 19
THURSDAY: Still mild. Clouds increase. High: 35
FRIDAY: Brisk! Feels like winter. W.C. -10. Low: 7. High: 15
SATURDAY: Subzero start in the suburbs. Bright sun. Low: 2 (MSP International). High: 18
SUNDAY: Fading sun, not as cold. Low: 6. High: 28
MONDAY: Coating of light snow possible. Turning milder. Low: 11. High: 32
TUESDAY: Slow clearing, March-like again. Low: 17. High: 33
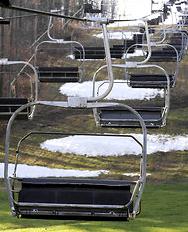
A "Useless Winter"
Old Man Winter is pulling his punch. I can't tell you the number of (snow lovers) who have come up to me and said some variation of "Paul, what good is winter if you can't have snow? It's surreal staring out at brown ground in early February! I'm depressed." Older Minnesotans seem relieved, but younger people who EXPECT snowcover in mid winter are baffled. Welcome to the club. Lately I've been more of a therapist than a meteorologist.
The ying and yang of weather: cold spells are usually followed by warm bips. Dry weather gives way to wet periods. Weather, like life, is cyclical. Ups and downs.
That's what makes this winter so extraordinary: how STUCK our pattern has been. La Nina, La Schmeena! Blocking patterns? Nothing I know of adequately describes how persistent this mild, dry pattern has been.
Our late week cold front will be a pale imitation of January's chill. The mercury bottoms out Saturday morning, dipping below zero in the suburbs, for the 4th time all winter. A typical winter brings 28 nights below zero. What happened to "typical"?
When in a drought, don't predict rain (or snow). Amen to that.
Repeat after me: "no big storms (of any flavor) are in sight."
* Photo above courtesy of the AP.
Climate Stories....
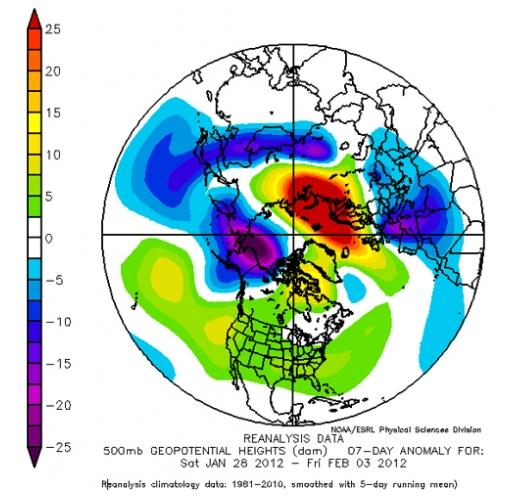
 Arctic Oscillation And The Winter Of Global Weirding.
 A good explanation of a baffling weather pattern from
Climate Denial Crock Of The Week: "
Weirdly warm and snowless in the US. Brutally cold and icy in Europe. What’s going on? Note in the satellite map above, how cold air is shifted out of the arctic and on to the European land mass – while large polar areas are warmer than usual. Climate Central: The weather pattern responsible for bringing the frigid air to Europe and Eurasia, and locking it in place, is being driven in part by a naturally-occurring pattern of climate variability known as the Arctic Oscillation. The Arctic Oscillation, or AO, is is a climate index that describes the characteristics of the atmospheric circulation over the Arctic, and a related index describes the circulation over the North Atlantic. Depending on whether it’s in a “positive” or “negative” phase, the Arctic Oscillation can bring warmer or cooler than average wintertime conditions to the U.S. and Europe. Right now the Arctic Oscillation is in a negative phase, which tends to favor colder than average weather in Europe and the U.S. Scientists don’t fully understand what causes the Arctic Oscillation to switch from one phase to the other, which limits their ability to forecast these changes ahead of time beyond a week in advance."
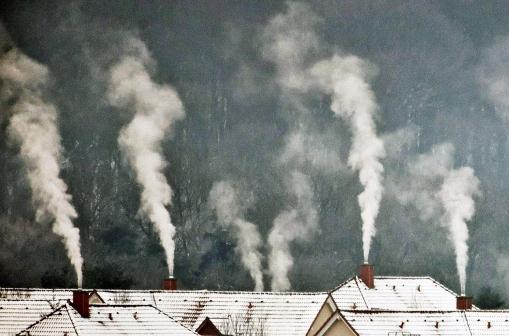
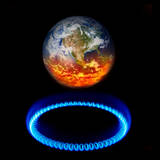
The Great Carbon Bubble. Here's a post from Bill McKibbon, courtesy of TomDispatch and
Huffington Post: "
If we could see the world with a particularly illuminating set of spectacles, one of its most prominent features at the moment would be a giant carbon bubble, whose bursting someday will make the housing bubble of 2007 look like a lark. As yet -- as we shall see -- it’s unfortunately largely invisible to us. In compensation, though, we have some truly beautiful images made possible by new technology. Last month, for instance, NASA updated the most iconic photograph in our civilization’s gallery: “Blue Marble,” originally taken from Apollo 17 in 1972. The spectacular new high-def image shows a picture of the Americas on January 4th, a good day for snapping photos because there weren’t many clouds."
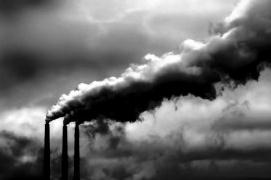
Carbon Emissions Rise Despite Climate Change Policies. More from
The Telegraph: "
The latest figures from the Department of Energy and Climate change show emissions rose by more than 3 per cent in 2010, the first increase since 2003. The rise in carbon dioxide and other gases comes despite a swathe of Government policies to cut emissions, such as building wind farms and installing solar panels. Ed Davey, the new Energy and Climate Change Secretary, said it was just a blip in the long term goal to halve emissions by 2025."


No comments:
Post a Comment