Lower Your Expectations. Yesterday a friend asked me
if we'd see any more 70s. Nope. I think we're done with 70s. Be happy
to see 50s from here on out, with a 1 in 4 shot at another 60 degree
high. Then again, when you lower your expectations you'll never be
disappointed...
18 F. Tuesday morning in the Twin Cities, coldest temperature since March 9.
43 F. high yesterday; average high for November 13 is 43 F.
It was
71 F. on November 13, 1999.
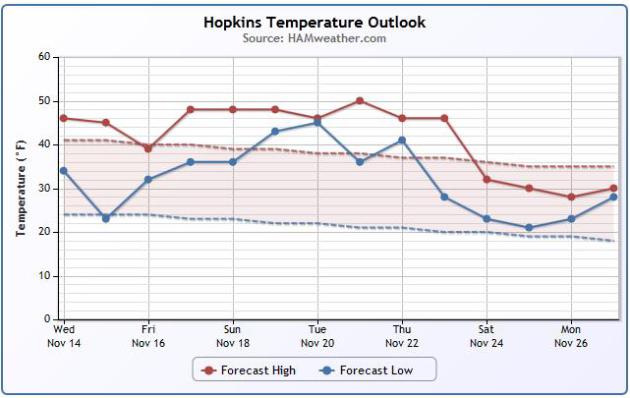
Above Average. Winter is on hold until further
notice, at least until the weekend after Thanksgiving. Although rain
showers are possible the first half of next week temperatures trend
above average, with highs in the upper 40s to near 50 into Thanksgiving
Day. You can see the average high/low above for Hopkins (dashed lines).
To check out the temperature forecast for your hometown enter your zip
code in
this site, courtesy of Ham Weather.
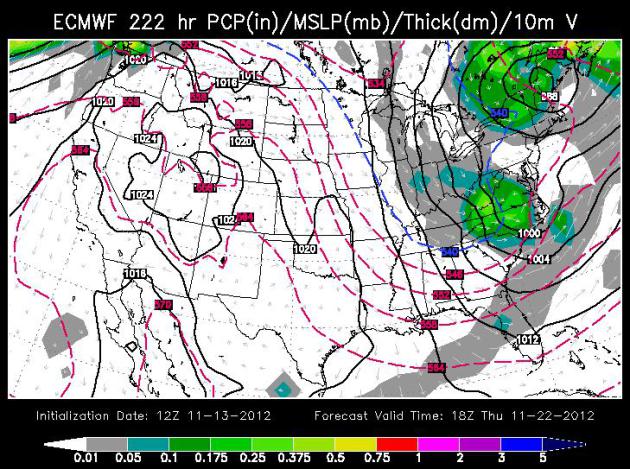
Thanksgiving Day Weather. Here's the Tuesday 12z
ECMWF solution, valid midday next Thursday, showing stormy weather for
New England, but a dry sky with unusually mild temperatures over the
western half of the USA. A cold front will bring unseasonable chill as
far south as Atlanta and Tampa. Map above: WSI.
Thanksgiving Weather Preview for the Twin Cities: Partly sunny, breezy and seasonably cool. High:
37-40
A Fine Thanksgiving
On your mark. Get set. Hesitate. Will we see a
real winter this year? I've gone on record predicting slightly colder
& snowier than last winter.
Wait, did we even have "winter" last year?
The pattern is whisking big storms south and
east of Minnesota - the east coast a veritable punching bag for
Nor'easters. We're still in a persistent drought, a signal which will
probably linger thru at least the first half of winter.
Yesterday I put on my snow tires and staked my
driveway, going through the motions. But there's nothing wintry or
forbidding on the weather map into next week. Highs approach 50 today
and tomorrow; again Saturday into Wednesday of next week.
Models kick up a few light showers next Tuesday
& Wednesday, but nothing to interfere with Thanksgiving travel
within 500 miles of home. In fact we may end November on a remarkably
quiet, mild note over the western half of America.
While Old Man Winter pulls his punch here, the
parade of coastal storms continues out east. New England may see rain,
high winds and minor coastal flooding on Thanksgiving Day. I could see
some travel complications for Boston and Portland.
No worries here looking out 2 weeks.
Maybe we'll ease into winter after all.
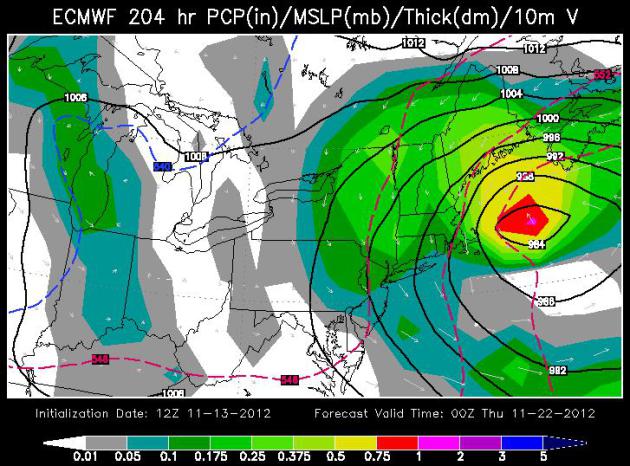
Another Nor'easter Next Week.
The same (WSI) ECMWF solution shows another vigorous coastal storm
pushing into coastal Maine, New Hampshire and Massachusetts next
Wednesday into Thanksgiving Day, capable of high winds, heavy rain and
minor to moderate coastal flooding. Right now it looks like metro New
York, New Jersey, Long Island and Connecticut may be spared a direct
strike. But there's little question that the emerging weather pattern
favors major storms for the east coast, a reflection of a negative phase
of the NAO, the North Atlantic Oscillation, which may be linked to
record ice melt over the Arctic 2 months ago.
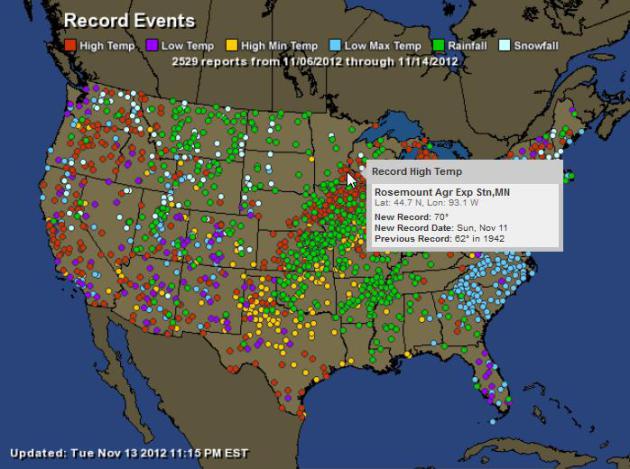
More Crazy Records. 2,529 weather records in just the last week from coast to coast.
Click here for an interactive map from Ham Weather.
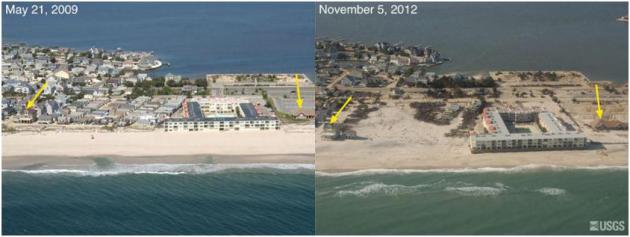
Photos Reveal Severity Of Hurricane Sandy's Coastal Impacts. The
USGS
has an article, and a series of before and after photos that underscore
the scope and severity of Sandy's storm surge. It's hard to believe
this was "only" a Category 1 storm. Here's an excerpt: "
The USGS has
released a series of aerial photographs showing before-and-after
images of Hurricane Sandy’s impacts on the Atlantic Coast. The photos,
part of a USGS assessment of coastal change from as far south as the
Outer Banks of North Carolina to as far north as Massachusetts, show
that the storm caused dramatic changes to portions of shoreline
extending hundreds of miles. Pre- and post-storm images of the New Jersey and New York shoreline
in particular tell a story of a coastal landscape that was considerably
altered by the historic storm. "Sandy taught us yet again that not all
Cat-1 hurricanes are created equal: the superstorm's enormous fetch
over the Atlantic produced storm surge and wave erosion of historic
proportions," said USGS Director Marcia McNutt. "We have seized this
opportunity to gather unique data on a major coastline-altering event."....
Photo credit above: "
Oblique aerial photographs of Mantoloking, NJ.
View looking west along the New Jersey shore. Storm waves and surge
eroded the beach exposing building foundations, protective dunes, and
houses in this part on Mantoloking. The burned houses are visible in
the center of the bottom photograph. Only a few pilings remain of the
first line of houses. Sediment was deposited on the island, remains on
some roads, or has been cleared and placed in large piles in the parking
lot behind the house marked by the arrow on the right. The yellow arrow
in each image points to the same feature. [larger version]."
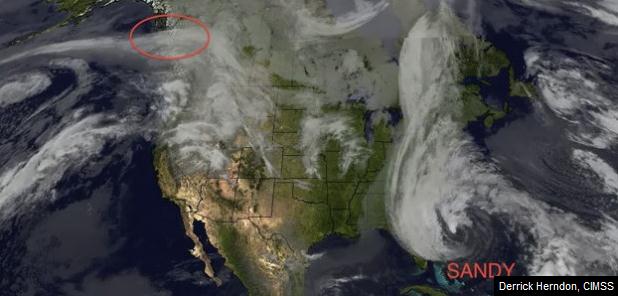
Satellite Imagery Helps Forecast Path Of Sandy. The
University of Wisconsin meteorology department had a hand in the
(extremely accurate) forecast path of Sandy a couple weeks ago, as
reported at
madison.com. Here's an excerpt: "
Thanks
to satellite imagery done in part by researchers at the University of
Wisconsin-Madison through the Cooperative Institute for Meteorological
Satellite Studies, people along the mid-Atlantic coast were prepared
for the worst when Superstorm Sandy made landfall Oct. 29. “I think
this storm was very much a success story,” CIMSS research specialist
Derrick Herndon said. “If this storm had hit 30 [to] 40 years ago or
longer, that 13-foot storm surge that came into Long Island … wouldn’t
have been prepared for. They wouldn’t have known it was coming.”
Herndon is right at the center of UW-Madison’s effort to provide
satellite imagery to agencies such as the National Hurricane Center so
they can properly forecast both the path and intensity of storms.
Herndon and other researchers at CIMSS look at the satellite imagery of
storms in the tropics and attempt to use that data to analyze the
features of the storm and predict its wind speeds, structure and size
along with other systems that may affect it..."
Image credit above: "
A satellite image from Oct. 27
showing the low pressure system (circled in red) as it moves down from
Alaska. The disturbance would eventually pull Sandy (labeled) back
towards the east coast."
How We Beat Hurricanes' Deadliest Element: Surprise.
Before weather satellites meteorologists relied on ship reports to get a
handle on where a hurricane was. Yes, pretty archaic, and the result
was a huge death toll when hurricanes swept ashore. Weather satellites
and numerical weather models changed all that, as reported in this
excellent overview from
Fast Company: "
Instead
of 24-hour updates on Sandy's movements, what if you had turned on the
news last week and heard this: "The usual signs which herald the
approach of hurricanes was not present in this case. The brick-dust sky
was not in evidence to the smallest degree...There were cirrus clouds
moving from the southeast during the forenoon of the 7th, but by noon
only alto-stratus from the northeast were observed." In 1900, that's
how Weather Bureau employee Isaac M. Cline
described the forecast of the Galveston Hurricane, which is still
known as the deadliest storm in American history. In addition to
130-mph winds and 20-foot storm surges, storms of this era often
arrived with a disastrous element of surprise. “They might have a
barometer and some surf indications and a wet finger,” explains Jim
Fleming, the editor of peer-reviewed journal History of Meteorology. “But they couldn’t have known where the cone of the hurricane was...”
Satellites, Supercomputers, And The Challenge Of Forecasting Storms. Here's a good overview of the challenge, including a video from
The PBS Newshour: "
As
Superstorm Sandy barreled its way west from the Caribbean to the
Mid-Atlantic states and then swiveled north up to Canada, forecasters
scrambled to understand it. The storm was unusual. It arrived late in
the season and was fed by unseasonably warm waters. It was pushed inland
by a high-pressure system and then merged with a cold front moving
east from California. Add to all that a full moon and resulting high
tide, and you have a real forecasting challenge. At the National Center for Environmental Prediction's
National Hurricane Center in College Park, Maryland, scientists
gathered global data from weather balloons, satellites, commercial
airplanes, buoys at sea and weather stations. That data gets fed into a
supercomputer, which uses differential equations to create a model that
predicts the track and intensity of the storm. Every six hours, the
center comes up with possible weather outcomes, which scientists use to
make a forecast..."
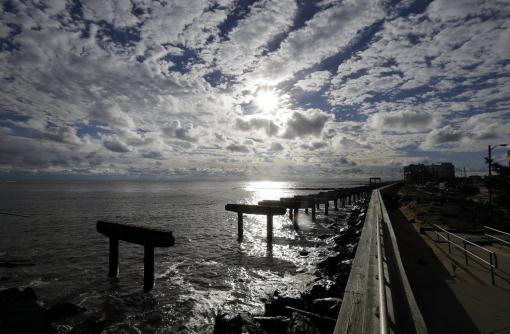
What To Do When The Storm Ends.
The Journal News
has a good article highlighting what people should do before, and after
a damaging weather event or other natural disaster. Yes, there's an app
for that. Here's an excerpt: "
If Superstorm Sandy hit your home,
you’ve probably lost something, from a few shingles to the whole
shebang. If you’ve planned well, you can keep your losses as low as
possible. And if you haven’t planned well, you can take action now to
minimize your losses in the next disaster.The best thing you could have
done before Sandy struck was make an inventory of your house and your
possessions. There’s even an app for that if you still want to do it.
Go to the Insurance Information Institute’s website (www.iii.org/software) and download its home inventory app..."
Photo credit above: "Piers remain from a boardwalk that was
destroyed by surge from Superstorm Sandy in Atlantic City, N.J.,
Wednesday, Oct. 31, 2012." (AP Photo/Patrick Semansky)
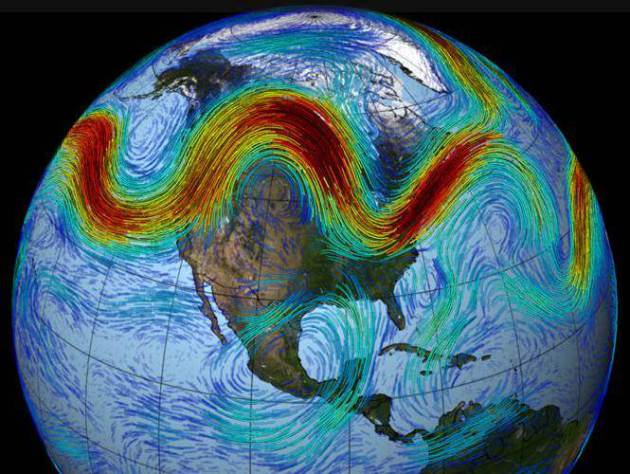
What Happens In The Arctic Doesn't Stay In The Arctic.
Here's a good explanation of how record Arctic melting in September
may be impacting weather farther south, creating "Arctic
Amplification", slowing jet stream winds, creating more dips and ridges
in the steering winds aloft, leading to more intense storms
(especially for the east coast). Here's an excerpt from Asheville's
Citizen-Times: "
As
the fastest-warming region of Earth, the Arctic is the leading
indicator of global warming, both in carbon dioxide and its effects. As
determined by ice core samplings, for the first time in 800,000 years
the Arctic has passed 400 parts CO2 per million; before the Industrial
Age, CO2 levels were at 275 ppm. CO2 is the principal greenhouse gas
and stays in the atmosphere for hundreds of years.Drawing on new
satellite data, scientific experts of the National Snow and Ice Data
Center issued a report on Sept. 19 showing that Arctic ice has
dramatically receded to levels not previously known. NSIDC Director Mark
Serreze declared, “We are now in unchartered territory.”
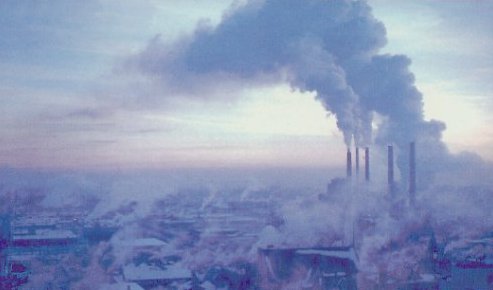
People Most Likely To Die Of Heart Problems In Winter, Regardless Of Climate. The story from CBS News and
kmov.com; here's an excerpt: "
People
are more likely to die from a heart-related issue in the winter,
regardless of if you have chilly winds knocking at your door or warm
weather year round. New research presented this week at the American Heart Association’s Scientific Sessions 2012
in Los Angeles showed that total and circulatory system-related deaths
rose considerably during the relatively coldest season of the year in a
variety of different climates. “This was surprising because climate
was thought to be the primary determinant of seasonal variation in
death rates,” said Dr. Bryan Schwartz, a cardiology fellow at the
University of New Mexico said in a press release.
Researchers from Good Samaritan Hospital in Los Angeles looked at
death certificates from between 2005 to 2008 in seven different U.S.
cities with different types of winter temperatures: Los Angeles County,
Calif., Texas, Arizona, Georgia, Washington, Pennsylvania and
Massachusetts..." Image: NOAA.
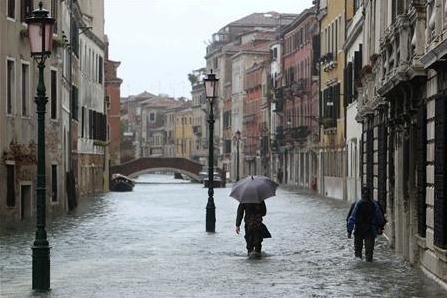
Tourists Swim In Venice Square As Heavy Rain Pounds Italy.
Reuters has the photo and accompanying article - here's the intro: "
Nearly
three quarters of Venice was flooded on Monday and tourists swam in St
Mark's Square as a wave of bad weather swept through northern and
central Italy, forcing the evacuation of 200 people from their homes in Tuscany. Shops, homes and historic palaces filled with water in Venice and authorities said 70 percent of the lagoon city was flooded.
High water in Venice reached 149 cm (5ft), the sixth highest level
since records began in 1872, forcing residents to wade through
waist-deep water. Tourists in swimming costumes sat at cafe tables
under the water..."
Does Your Thanksgiving Turkey Come With A Cardiologist?
Nothing like smothering your favorite bird with bacon. Mmm good. Thanks
to Todd Nelson for passing this one along. I can feel my chest
tightening up just staring at this...
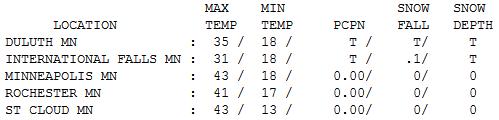
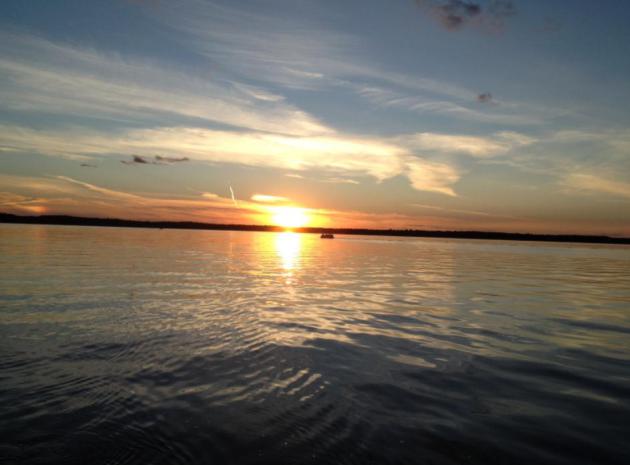
A Welcome Thaw. After a numbingly cold, icy Monday
our weather moderated a bit yesterday; under a blue sky highs ranged
from 31 at International Falls to 43 at St. Cloud and the Twin Cities,
47 at Redwood Falls.
Paul's Conservation Minnesota Outlook for the Twin Cities and all of Minnesota:
TODAY: Plenty of sun, getting better. Winds: SW 10. High: near 50
WEDNESDAY NIGHT: Clear to partly cloudy. Low: 33
THURSDAY: Mix of clouds and sun, quiet. High: 48
FRIDAY: Cooler with blue sky. Not bad for mid November. Low: 25. High: 43
SATURDAY: Partly sunny. Winter on hold. Low: 29. High: 48
SUNDAY: Patchy clouds. Good travel weather. Low: 34. High: 49
MONDAY: More clouds, passing shower possible. Low: 37. High: 48
TUESDAY: Unsettled, late showers? Low: 36. High: near 50
Climate Stories...
Experts Argue Global Warming's Impact on Sandy's Unusual Path To New Jersey. Here's an excerpt of a very interesting story at
NJ.com: "
That’s
what the weather experts kept saying immediately before, during and
after Sandy smacked New Jersey in the face. Not this far north, they
said, not in autumn, and certainly not this bad. Which is why the global
warming finger-pointing that usually begins after a natural disaster,
preceded this one. But six weeks before Sandy was even a specter
threatening the Caribbean, Rutgers scientist Jennifer Francis — not
your normal climate change Cassandra — issued a warning during a
teleconference call on global warming. The melting ice caps, she said,
appeared to be tied to recent extreme weather events, especially those
occurring in the fall. "It’s probably going to be a very interesting
winter," she said..."
Image credit above: NASA.
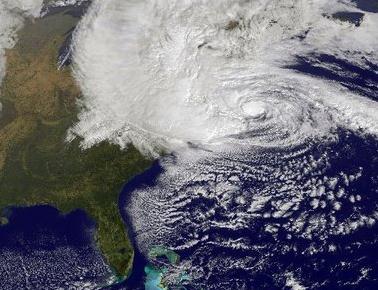
Superstorm Sandy Shows Climate Change Isn't Science Fiction, Top U.N. Official Says.
Phys.org has the story - here's a clip: "
Until
recently, climate change seemed like a science fiction scenario," Helen
Clark told a Stanford audience recently. Clark, the administrator of
the United Nations Development Program and former prime minister of New
Zealand, argued that a lack of coordinated global action on the issue is
undermining efforts to alleviate extreme poverty. Climate change is
damaging agriculture, driving up food prices, creating water insecurity,
destroying coral reef fishing grounds and exposing millions to diseases
such as diarrhea, dengue fever and malaria, she said. Ahead of global
climate negotiations set to begin in Doha, Qatar later this month, Clar
visited campus on the the heels of Superstorm Sandy in the eastern
United States and a wave of extreme weather events worldwide. "It's not
just a problem for small coastal regions in developing countries," she
said...."
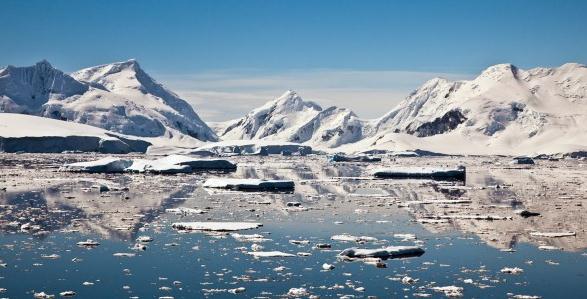
How Climate Change Is Causing Antarctic Sea Ice To Expand. Here's an excerpt of a fascinating article from
National Geographic: "
As
rising temperatures continue to shrink the extent of Arctic summer
sea-ice, there has been much speculation as to why the ice cover on the
opposite side of the planet has expanded slightly in recent years. Now
British scientists have found the explanation–and it’s related to
climate change. Using data gathered by U.S. military satellite-tracking
of the motion of the Frozen Continent’s icepack between 1992 and 2010,
the researchers have found a link between Antarctic winds and the
growth of sea-ice in the Weddell, Cooperation and Ross seas. The
analysis, “Wind-driven Trends in Antarctic Sea-ice Drift,” was published
online yesterday in the science journal Nature Geoscience...."
Photo credit above: "
Picture of Antarctic sea-ice by Edward Bacon//National Geographic My Shot."


No comments:
Post a Comment