22 F. high in the Twin Cities Tuesday.
29 F. average high on December 9.
12 F. high on December 9, 2013.
1" of snow on the ground - officially - in the Twin Cities.
December 9 in Minnesota Weather History. Source: MPX National Weather Service office:
1992: By this time there is partial ice cover in the Duluth harbor.
1979: Heat wave across Minnesota. High of 54 at Twin Cities and 57 at Winona.
1978: Alexandria ends it fourteen day stretch of low temperatures at or below zero degrees Fahrenheit.
1889: Late season thunderstorm observed at Maple Plain.
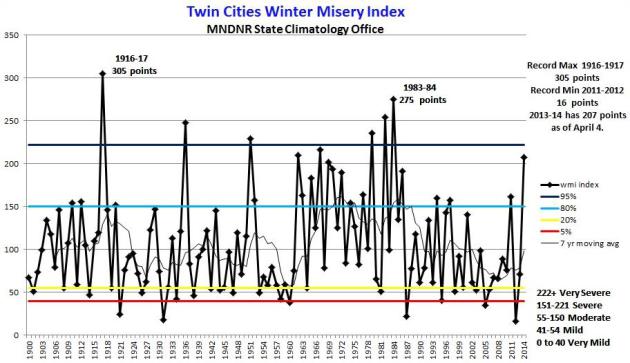
Less Misery
One
of my favorite attorneys (oxymoron?) sent me a holiday card that read
"Great working with you and your staff. Now, can you please fix the
(censored) weather?" I'm just the messenger, Curt.
A story at
FiveThirtyEight Science (on my blog) suggests that Rapid City has
America's most unpredictable weather. Other landlocked Midwestern cities
top the list, including the Twin Cities. No kidding.
And leave it
to meteorologists to leave you feeling worse than you thought possible,
from summer heat index to winter wind chills.
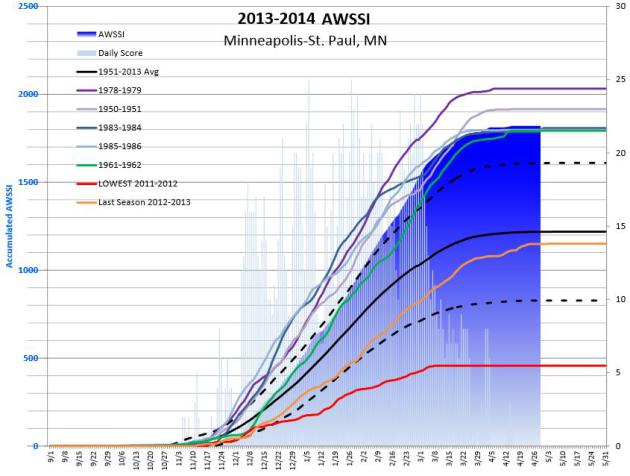
A NOAA meteorologist in Omaha came up with the WMI, the Winter Misery Index, also known as the
Accumulated Winter Season Severity Index, which factors duration of cold and snow. Last winter's
WMI score for Minnesota was the highest since 1983. That sounds about right.
I
am a gullible naive optimist, but I still predict this winter won't be
as severe as last with a more moderate Pacific breeze and fewer icy
shotgun blasts from the north.
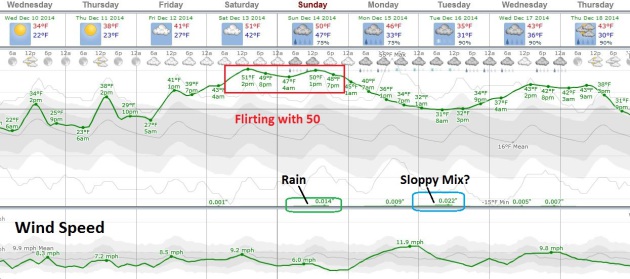
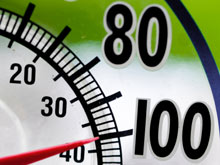
The warm front we've been
advertising for 2 weeks is still coming: 40s by late week, 50F Saturday
with some rain Sunday.
Most of the snow in your yard will be
gone within 5 days and I don't see any fresh piles of white between now
and Christmas.
Expect a little less misery this winter.
The Accumulated Winter Season Severity Index.
Yes, WMI roles off the tongue, but the original index is the AWSSI.
Here's an excerpt of a good explanation of how this running winter index
is calculated and updated from the
Midwest Regional Climate Center: "...
Daily
scores are calculated based on scores assigned to temperature,
snowfall, and snow depth thresholds. The daily scores are accumulated
through the winter season, allowing a running total of winter severity
in the midst of a season as well as a final, cumulative value
characterizing the full season. Accumulations of the temperature and
snow components of the index are computed separately and then added
together for the total index. This allows comparison of the relative
contribution of each to the total score..."
* More information on Barbara Boustead's new winter rating scale from the AMS, the
American Meteorological Society.
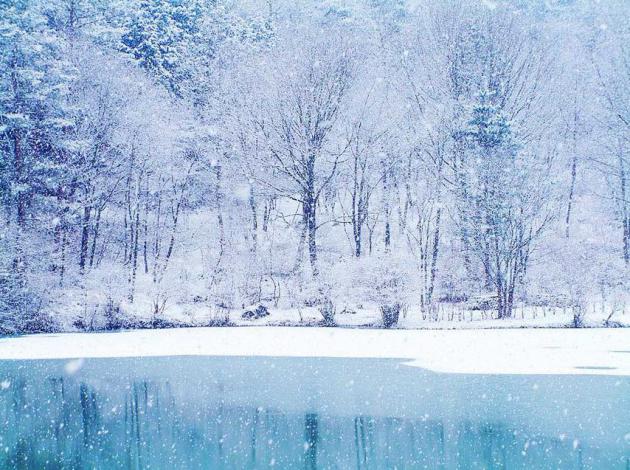
December Warm Front.
It's bordering on pathetic, but considering 50F is the average high on
April 1 in the Twin Cities we can be forgiven for a few feeble
high-fives later this week. 40s seem likely by Friday, a good shot at
50F over the weekend, even with potentially dense advection fog Saturday
and a little rain on Sunday. It cools off a bit next week, but
temperatures still run 10-15F above average.
Another West Coast Storm.
Although not quite as intense as last week's swirl of moisture pushing
in off the Pacific, flooding rains spread from north to south, right
down the coast over the next 48 hours, accompanied by 20-40 mph winds.
You can see the Nor'easter that dumped heavy rain on major northeastern
cities; moisture from this wobbling storm forecast to linger over
interior New England, dumping enough snow to shovel and plow from
Manchester and Stowe to Rochester, Syracuse and Buffalo.
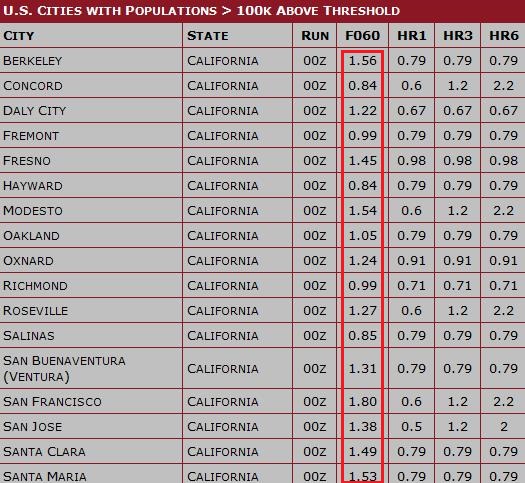
California Rainfall Amounts Exceeding Flash Flood Guidance.
This is a graphic from our Alerts Broadcaster service which alerts
corporate customers of potential extreme weather that can impact
operations. F060 is the 60-hour rainfall totals. HR1, HR3 and HR6 are
the 1, 3 and 6 hour flash flood guidance numbers, the amount of rain
over that period of time required to initiate urban and small stream
flooding. Close to 2" of rain is predicted for the Bay Area, where flash
floods, mudslides, road closures and even power outages are possible
over the next 48 hours.
New England Snow Event.
The Nor'easter that sparked coastal flooding from Delaware and New
Jersey into New England is forecast to temporarily stall, dumping as
much as 8-12" of snow on upstate New York and much of interior New
England over the next 60 hours. Animation: NOAA and HAMweather.com.
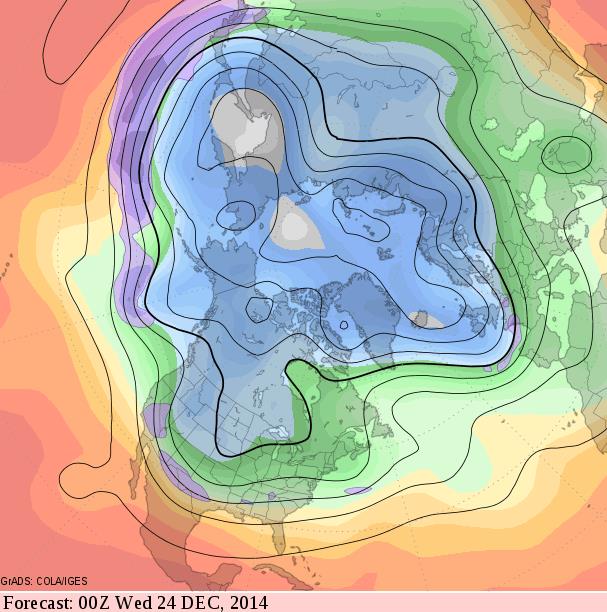
Turning Colder by Christmas?
GFS model data suggests a southward dip in the jet stream in 2 weeks as
colder air finally spills into the Lower 48. Right now it doesn't look
like a frigid outbreak, but after a relatively mild spell spilling over
into December 22-23 we may see a temperature correction in time for
Santa's arrival. Whether this push of colder air spins up a storm
capable of accumulating snow is yet to be determined. Map:
GrADS;COLA/IGES.
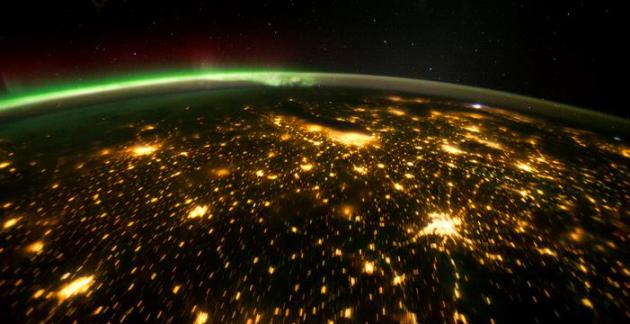
Is Weather A Barometer of Painful Joints and Achy Bones.
Yes, it would appear that many in our midst are walking, talking
barometers - much more sensitive to changes in barometric pressure (and
moisture) than others. Here's an excerpt from an interesting story at
The Star Tribune: "...
That’s
a widespread belief supported by an abundance of testimonials from
aging jocks and grandmas everywhere who claim that they’re able to
predict weather changes by increased aches and pains. The phenomenon
seems to strike arthritis sufferers the most, but it afflicts others,
too. Migraine headaches, sinus problems, toothaches and other maladies
have been linked to weather. People with previous injuries — maybe a
broken bone — say they can feel temperature shifts in those sore spots..." (Image credit: NASA).
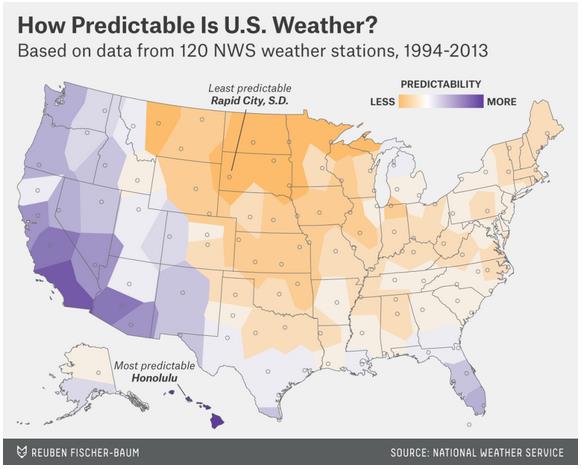
Which City Has The Most Unpredictable Weather?
Oh to be a meteorologist in Rapid City, South Dakota. The greatest
weather extremes in general come near the center of large continents,
well away from the moderating influence of warmer ocean water. Here's an
excerpt from a long but excellent story at Nate Silver's
FiveThirtyEight: "...
But
Rapid City isn’t alone; other cities in the Great Plains and Upper
Midwest dominate the most-unpredictable list. After Rapid City, those
with the most unpredictable weather are Great Falls, Montana; Houghton,
Michigan; Sioux Falls, South Dakota; Fargo, North Dakota; Duluth,
Minnesota; Bismarck, North Dakota; Aberdeen, South Dakota; Grand Island,
Nebraska; and Glasgow, Montana. For the most part, these cities are
landlocked. The presence of lakes or oceans can contribute to weather
problems — for instance, the huge amounts of lake-effect snow
in Houghton, in Michigan’s Upper Peninsula (about twice as much as in
notoriously snowy Buffalo, New York). But water usually does more to
regulate temperatures and severe weather..."
The Story Behind The Winter Misery Index. Meteorologist Andrew Freedman had a good story about the origin of the WMI at
Mashable back in February that's worth a read; here's an excerpt: "...
The
index attempts to put the “badness” or “goodness” of winter into
historical context, Bousted said. The index is based on daily
temperature and precipitation data, including snowfall and snow depth.
It uses thresholds of temperature and snowfall to assign a score to each
day, which gets tallied up throughout a season, with a running tally
and a final score at the end of the year to gauge a winter’s severity.
The scores correspond to a category, with a one-through-five system —
with five being the worst — similar to those used for other severe
weather phenomena..." (Graphic credit above:
Minnesota DNR).
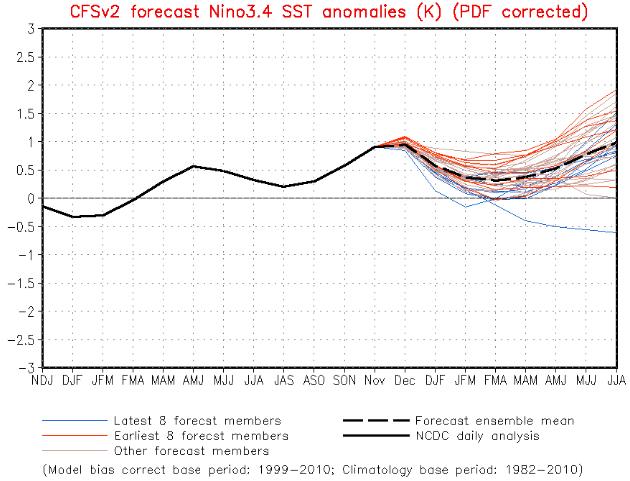
El Nino Lingers into Mid 2015. NOAA says a 65% chance of El Nino this winter, lasting into the middle of 2015.
Details here. This is one of many reasons why I suspect the core of the upcoming winter season won't be as harsh as last winter.
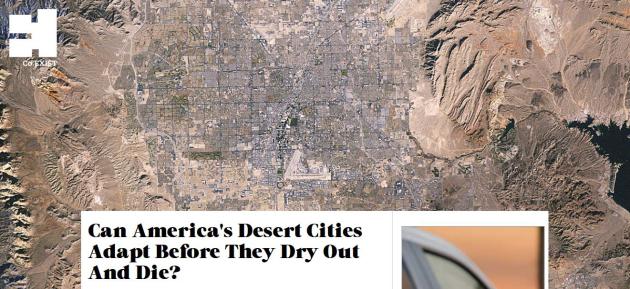
Can America's Desert Cities Adapt Before They Dry Out And Die?
Water will become a stark manifestation of the climate volatility we're
already witnessing. You may not care about a few degrees and more heat
waves in the summer. Odds are you will care if the water supply runs
out. Here's an excerpt from
Fast Company: "...
With some scientists saying California could be in the midst of a 35-year megadrought,
and other parts of the southwest feeling the same strain, desert cities
in America will have to cope with more water scarcity, projected
climate-change-induced temperature increases of up to 10 degrees Fahrenheit and a continuing growth in population. Some estimates put the population of the Greater Phoenix area at around 28 million by the year 2050,
from its current population of about 4 million. That's a lot of extra
water. There are several ways to combat these problems and change the
ways desert cities exist..."
5 Steps To Smarter Catastrophe Preparations.
Because when you come right down to it, nobody ever expects a
catastrophe to impact them, and I have yet to meet (anyone) who has
backed up all the digital records they should be backing up, for
personal and business. Here's a clip from a good summary at
Property Casualty 360 of what you should consider to lower the odds of a post-catastrophe catastrophe: "...
No
one can be totally prepared for everything, but taking steps before a
disaster strikes can minimize the impact for insurers and their
policyholders. Here are some recommendations to help prepare for a wide
variety of catastrophes.
General Preparation
- Prepare
a photo inventory of your home or office. Go room by room and take
digital photos of the contents. Pay particular attention to antiques,
unique works of art, office equipment and any irreplaceable items.
Jewelry, furs, expensive “toys,” electronics, collections (i.e., stamps,
coins, dolls, pottery, etc.) should be catalogued and may require their
own policies depending on their value. Memories become fuzzy and
establishing the value of heavily damaged items becomes a challenge
after the fact..."
 Getting Mooned
. Chris Hadfield argues (quite convincingly) that we should ignore Mars for now and set up a permanent base on the moon at
The Guardian.
Life Gets Better With Age? David Brooks has a great essay at
The New York Times.
4DX Movies,
complete with scents, rain, wind, motion, even bubbles? Get ready for a
more immersive movie experience that makes 3-D as cutting edge as
Betamax, according to a story at
Vulture.
TODAY: Mostly cloudy, a bit milder. Winds: SE 5-10. High: 32
WEDNESDAY NIGHT: Patchy clouds and fog. Low: 24
THURSDAY: Peeks of sun, lose a layer. High: 38
FRIDAY: Patchy clouds. Feeling better. Wake-up: 27. High: 42
SATURDAY: Gray & milder with some fog. Feels like March. Wake-up: 40. High: near 50
SUNDAY: Soggy & foggy, a little rain and drizzle likely. Wake-up: 47. High: 51
MONDAY: More fog, light rain and drizzle. Wake-up: 41. High: 43
TUESDAY: Light mix possible. Sloppy. Wake-up: 32. High: 34
Climate Stories....
'It is difficult to get a man to understand something, when his salary depends on his not understanding it.'
- Upton Sinclair
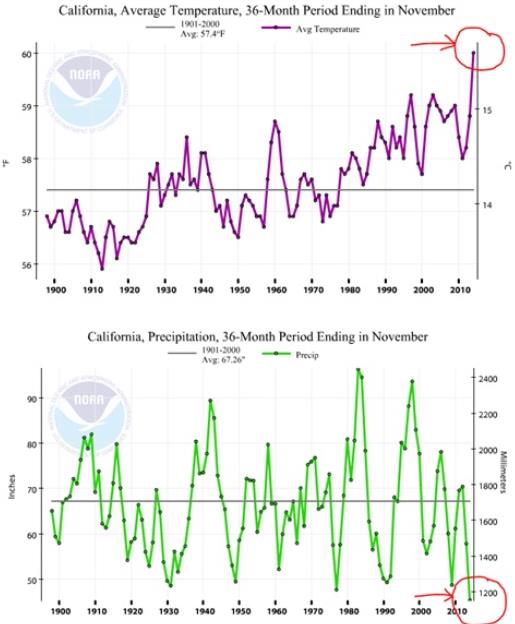
Once-In-1200-Year-California Drought Bears Signature of Climate Change. Here's an excerpt from Joe Romm at ThinkProgress: "...It
is the combination of reduced precipitation and record temperatures
that make this a 1-in-1200-year drought. This was the same point made to
me by California-based climatologist Dr. Peter Gleick, one of the
world’s leading water experts. He pointed out that in fact “the last 36
months are the hottest AND driest 36 months in the instrumental record.
for California,” and sent me these NOAA charts..."
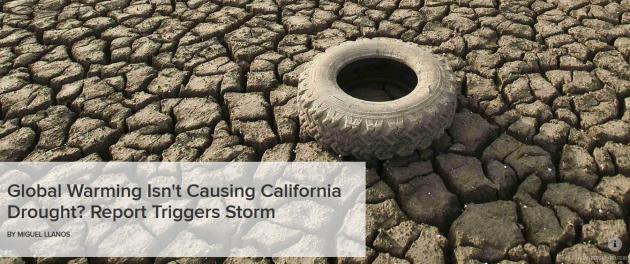
Global Warming Isn't Causing California Drought? Report Triggers Storm.
Many climate scientists are pointing out that the recent NOAA report
focused on California was a precipitation study, not a drought study.
Here's an excerpt of a summary of some new research at
NBC News: "
Natural
conditions, not human-caused emissions of greenhouse gases, are the
driving force behind California's three-year dry spell, scientists on a
federal task force concluded Monday. But the report came under fire from
some experts who said it downplayed other factors that have humanity's
fingerprints on them. The evidence suggests a naturally induced "warm
patch" of water in the western Pacific helped to create a high-pressure
ridge that blocked precipitation from entering California, the experts
said at a news conference to release the report..."
Photo credit above: Noah Berger, Reuters.
Asking What "Caused" California's Drought Misses The Point.
Meteorologist Eric Holthaus addresses the impact of extreme heat and
soil moisture depletion on the historic California drought in
Slate; here's a clip that caught my eye: "...
One
of Gleick’s main criticisms of the NOAA study was that “they completely
ignored the temperature question, which is by far the clearest signal.”
He continued, “There’s just no dispute that temperatures globally are
going up. There’s no dispute that temperatures regionally in California
are going up. There’s no dispute that the last three years have been the
hottest in the instrumental record [in California]. And, there’s no
dispute that hotter temperatures increase water demand in California.
The exact same drought with normal temperatures is not as bad...”
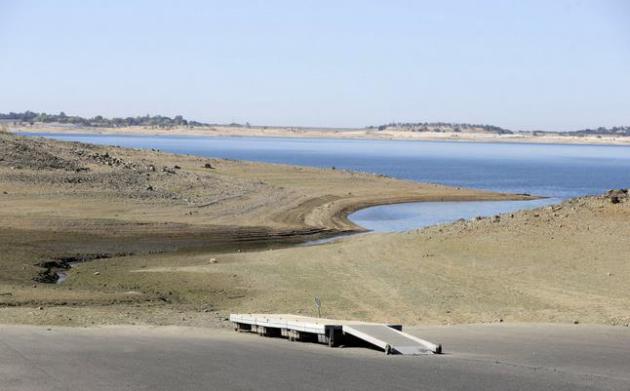
File Photo credit above: "In
this Oct. 6, 2014 file photo, a dock sits high and dry at the end of a
boat ramp yards away from the edge of Folsom Lake near Folsom, Calif.
Don’t blame man-made global warming for the devastating California
drought, a new federal report says. A report issued Monday by the
National Oceanic and Atmospheric Administration said natural variations _
mostly a La Nina weather oscillation _ were the primary drivers behind
the drought that has now stretched to three years." (AP Photo/Rich Pedroncelli, File)
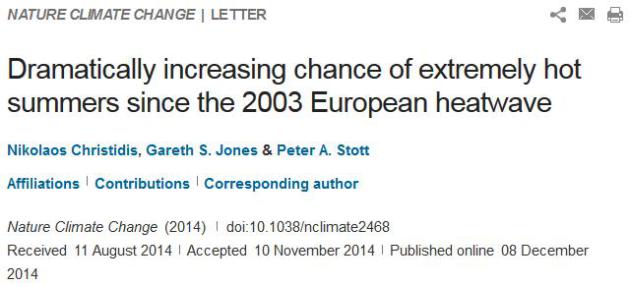
Dramatically Increasing Chance of Extremely Hot Summers Since The 2004 European Heatwave. The abstract and paper are available at
nature.com.
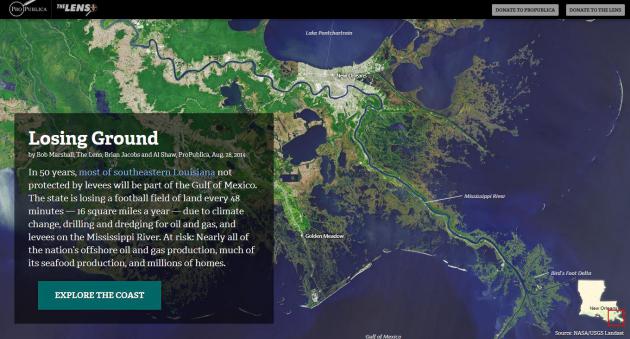
Louisiana's Moon Shot.
ProPublica
has the second installment of a important series focused on what's
happening in Louisiana. It's not a computer model - it's reality; the
water is rising and wetlands are disappearing. Here's an excerpt: "...
Southeastern
Louisiana might best be described as a layer cake made of Jell-O,
floating in a swirling Jacuzzi of steadily warming, rising water.
Scientists and engineers must prevent the Jell-O from melting – while
having no access to the Jacuzzi controls. The problem is manmade. Over
the last 80 years, Louisiana’s coast has been starved of sediment by river levees and eviscerated by canals dredged for oil and gas extraction. Now, southeastern Louisiana is sinking at one of the fastest rates on the planet as the Gulf is rising..."
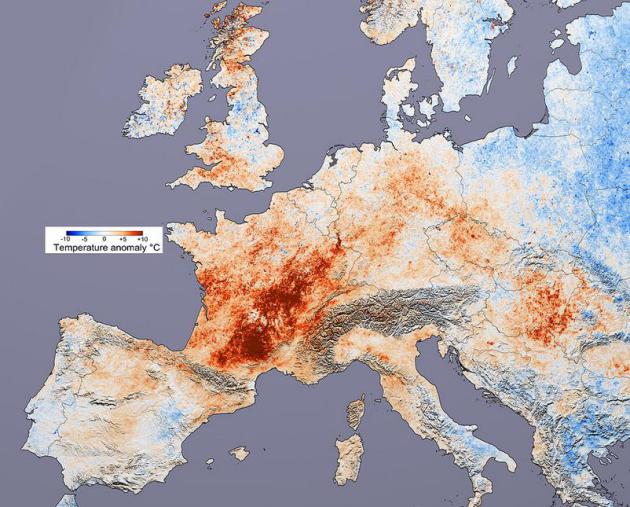
Heat Waves in Europe Will Increase, Study Finds.
A prolonged heat wave in 2003 resulted in the premature deaths of
nearly 70,000 Europeans. A slowly warming atmosphere will increase the
odds (load the dice) in favor of more extreme heat events, as reported
in
The New York Times; here's a clip: "...
Now, three scientists from the Met Office, the British weather agency, have concluded that human-caused global warming is going to make European summer heat waves "commonplace" by the 2040s. Their findings, published
Monday in the online journal Nature Climate Change, suggest that once
every five years, Europe is likely to experience "a very hot summer," in
which temperatures are about 1.6 degrees Celsius, or 2.9 degrees
Fahrenheit, above the 1961-90 average..." (Image credit above:
Wikipedia).
Deadly Heat in Europe 10X More Likely Than Decade Ago.
Climate Central has a slightly different perspective on the new research referenced above; here's an excerpt: "...
The
new study shows that a very hot summer could now occur every five years
and a heat wave like the one in 2003 could occur every 127 years. The
previous study just a decade earlier suggested that such a heat wave was
likely less than once every 1,000 years. “Our study, which comes 10
years later, shows that a rapid increase in the frequency of such events
has taken place within the last 10-15 years and confirms that this
increase in the frequency will continue...”
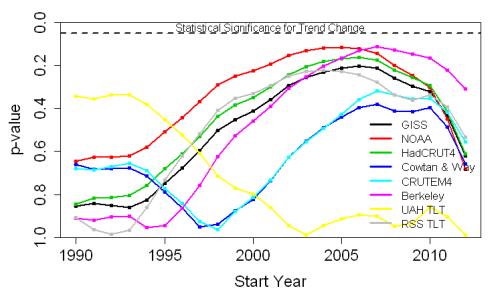
Is Earth's Temperature About To Soar?
There is no evidence of a substantive "pause" in the heating of Earth's
atmosphere, oceans and cryosphere. For a detailed explanation check out
the Tamino post at
Open Mind; here's an excerpt: "...
Therefore,
for no choice of start year, for no choice of data set, can you make a
valid claim to have demonstrated a slowdown in warming. As a matter of
fact, in no case does the p-value for any choice of start year, for any
choice of data set, get as low as the 10% level. To put it
another way, there’s just no valid evidence of a “slowdown” which will
stand up to statistical rigor. Bottom line: not only is there a lack of
valid evidence of a slowdown, it’s not even close..."
It's Time To Start Ignoring The Climate Deniers. Wait, climate change denier denial? Whoa. Here are two quick clips from an essay at
The Globe and Mail that resonated: "...
I
do not believe that climate change deniers exist. I have heard the
statistics and have seen the graphs, but I am not convinced. So I do
what the supposed deniers do – I ignore them and move on....The next
time you find yourself in a conversation with friends and colleagues
about climate change, I would ask that you do one thing – skip over the
discussion about the deniers. By talking about the deniers, the debate
focuses on how to fix the problem of denial rather than climate change
itself. Not everyone has to believe in it; what is required is that most
of us do something about it..."
The Plan To Get Climate Change Denial Into Schools. Here's an excerpt from a story at
The Atlantic: "...
Truth in Texas Textbooks
formed last year to shape how climate change and scores of other topics
are taught. It has no political or religious affiliation but organizers
recruit volunteers through tea-party networks and church groups—as well
as teachers associations, Rotary clubs, and other civic
organizations—and have accused publishers of creating textbooks with an
"anti-Christian" and "anti-American" bias. Teaching that the
global-warming theory is controversial reflects public opinion, as there
is a sharp divide over the connection between human activity and
Earth's evolving climate. But that approach is sharply at odds with
climate scientists, who nearly universally believe the former is driving
the latter..."


No comments:
Post a Comment