90 F. high in the Twin Cities Friday; only the second 90-degree day of 2015, to date.
84 F. average high on July 17.
79 F. high on July 17, 2014.
July 17, 2001:
Lightning struck a Minnesota National Guard field training site located
in Camp Ripley. Nearly two dozen Marine Corps reservists were sent to
hospitals. Most were released after treatment.
July 17, 1952:
5.20 inches of rain fell in 3 1/2 hours at Moose Lake. Numerous
basements were flooded and Highway 61 was impassable at Willow River.
July 17, 1934: Frost damages crops across the north with 34 in Baudette and Roseau.
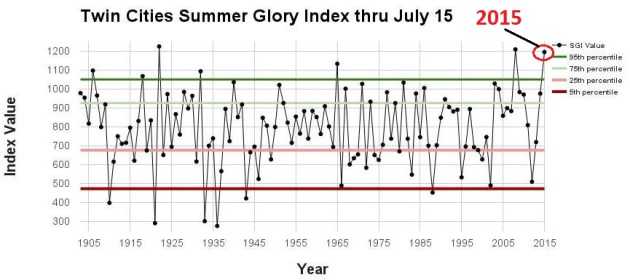
Summer Glory IndexThis
won't come as breaking news but summers in Minnesota are fleeting.
Every hour you can feel your toes (and not see your breath) is precious.
In the winter we torment you with wind chill and the
Winter Misery Index.
Demanding
equal time summer now has the SGI, the Summer Glory Index. The
Minnesota Climate Office factors in optimal temperature and dew point
ranges; the fewer the extremes the higher the score on a given day.
We
have seen only one 90-degree day, no low temperatures greater than 70F,
and just 2 calendar days with over an inch of rain during the first
half of meteorological summer.
Bottom line: welcome to the 3rd
most glorious first-half of summer since 1903 in the Twin Cities. Only
2008 and 1922 were nicer, according to climate office calculations.
Details on my blog below.
A thundery start gives way to murky
sunshine today with a shot at 90F and noticeable dew points in the low
70s. We should salvage most of the day for the lake, pool or deck.
Sunday looks better with a transfusion of Canadian air, blue sky and dew points in the upper 50s.
It's not exactly dog days but next week feels like summer: a streak of 80s; lake-worthy weather - bordering on glorious.
On second thought, this may have been a bad morning to introduce the Summer Glory Index. Just saying...
*
Here is a running list of damage from last night's storms, courtesy of the Twin Cities National Weather Service.
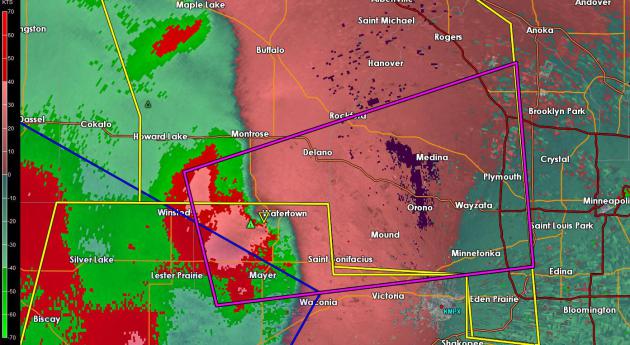
Evidence of Severe Rotation.
SRV or Storn Relative Velocity at 12:07 AM picked up evidence of
rotation strong enough to support a tornado circulation extending to the
ground around midnight. NWS Doppler courtesy of the Twin Cities office
loated in Chanhassen.
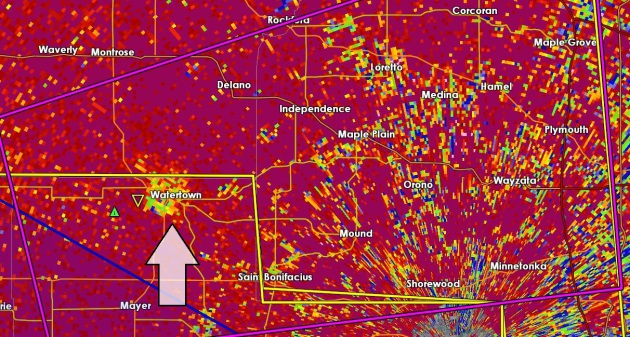
Doppler Dual-Pol Correlation Coefficient Detecting Tornado Debris In The Air?
The number went up to .80 around midnight over Watertown at about 12:09
AM Saturday, suggesting debris lofted into the air from a potential
tornado strike. It's consistent with strong rotation detected in the
image above, using Storm Relative Velocity (SRV).
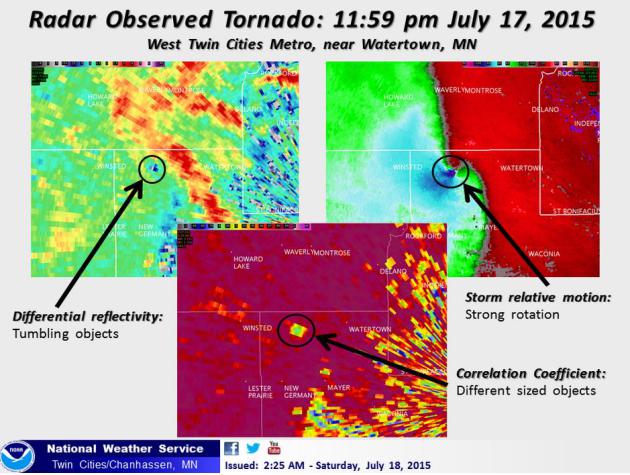
Strong Forensic Evidence of Tornado On The Ground.
Whatever hit the Watertown area around midnight was kicking up debris,
and there was a strong "couplet" on the radial velocity Doppler display.
I'll be surprised if it wasn't a tornado. Stating the obvious:
confirmation of a tornado becomes very difficult at night, even with the
nearly continuous lightning display we had last night. The storm may
have been rain-wrapped, making it very difficult to see.
First Half of Summer in the Twin Cities: 3rd Most Glorious Since 1903
In the winter we torment you with the WMI, the Winter Misery Index. So
the summer has a comparable index, based on temperature, dew point,
precipitation ranges and lack of crazy extremes.
The Minnesota DNR
and Minnesota Climate Office has put together their "Summer Glory
Index" or SGI, and your hunch is correct: so far this has been a
much-above average summer. Here's an excerpt: "...
The all-new Summer
Glory Index (SGI) can help us answer these questions. Any day from June
through August can earn up to 40 Glory points for being within “ideal”
temperature, dew point, and precipitation ranges, and can lose points
for being too hot, cold, wet, or humid. A given year’s SGI is then the
sum of all the points earned and lost, and tells us how frequently we’ve
experienced glorious conditions....Through July 15, this summer has
been the third most glorious on record. Only 1922 and 2008 were better.
Our current high ranking should come as no surprise: to date,
Minneapolis has only topped 90 degrees once, has not recorded a minimum
temperature of 70 or greater, has only had one 6 PM dew point reading
above 70 degrees, and has had just two calendar days with over an inch
of rain..."
How The SGI (Summer Glory Index) Is Calculated. The Minnesota Climate Office
explains the logic behind the SGI and how the scores for each day are
tabulated. As much as I like a hot day at the lake I think most of us
can probably agree on what constitutes a glorious summer day. Here's an
excerpt: "...
The index is based on the notion that we like to sleep
through the night soundly without excessive energy consumption, and we
want to be able to get outside and stay outside during the day without
having our activities postponed or cancelled. Of course some like it
hot, some like it muggy, and some like it stormy, but very few people
enjoy rain-outs, blasting the AC all night, or wearing winter clothes to
the barbeque. The SGI, therefore, rewards days that are comfortable and
dry, and punishes days for being too hot, too cold, too humid, or too
wet. In the index, a perfectly glorious day has a high temperature of
73-79, a low of 57-64, a 6 PM dew point of less than 60, and no
measurable rain. Such a day earns 10 points for each category, or 40
points total..."
Getting Better.
After a wet start the sun should come out later today as winds become a
bit more westerly. Expect a slight dip in dew point Sunday; an isolated
T-shower risk Monday, but the next chance of widespread showers and
T-storms comes late Wednesday into midday Thursday of next week. NAM
future radar guidance above: NOAA.
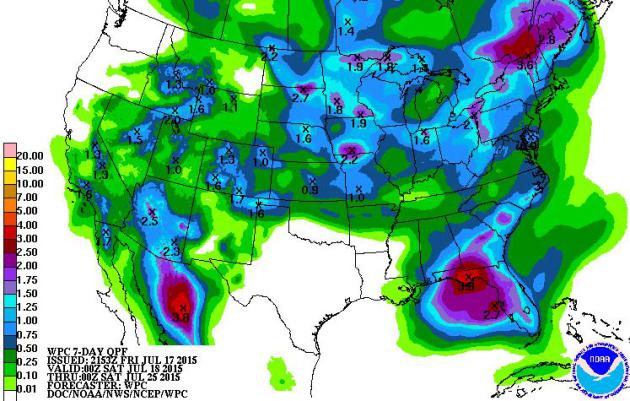
7-Day Rainfall Prediction.
For the first time in a long time I'm seeing some a heightened
potential for showers and T-storms over California and the Intermountain
West, some of this moisture streaming inland from a weakening Hurricane
Delores in the eastern Pacific. A few rounds of storms make watering
optional from the Dakotas and Minnesota and Iowa into New England,
another sloppy bullseye over the Florida Panhandle.
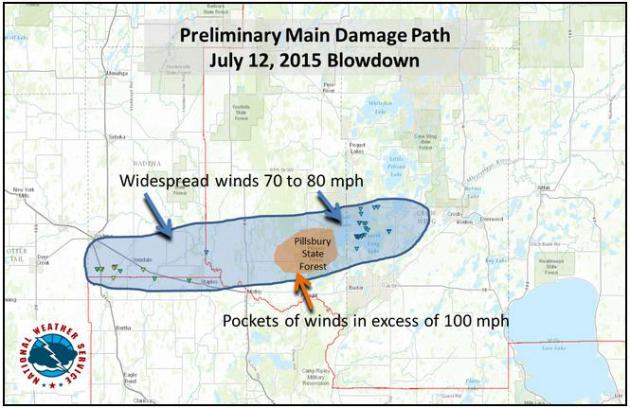
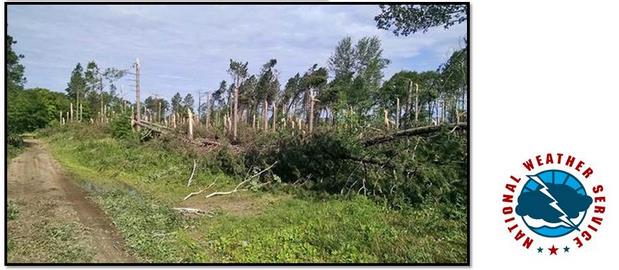
100 MPH Straight-Line Winds In Sunday's Storms near Brainerd?
The damage swath is consistent with a downburst, an extreme downdraft
reaching the ground and spreading out into damaging straight-line winds.
Here is a preliminary damage report from the
Duluth office of the National Weather Service: "
On
the evening of July 12th, 2015 a line of severe storms brought
significant straight line winds to the southern portions of Cass and
Crow Wing counties in north central Minnesota. An automated weather
station in Brainerd, MN recorded a peak wind of 65 mph during the storm.
Most of the storm damage in the Brainerd area was consistent with winds
in the 70-80 mph range. However, there were pockets of more devastating
tree damage, mainly in the Pillsbury State Forecast area northwest of
Brainerd, MN. Based on aerial photos provided by the Minnesota
Department of Natural Resources, prelinary assessments suggest wind
speeds in excess of 100 mph were likely in this area..."
Extreme Tree Damage.
It's one thing for sustained straight-line winds to blow trees over,
especially when the soil is wet. But having trees snap off 5-15 feet
above the ground? That's more consistent with a downburst or microburst
with winds approaching or even exceeding 100 mph. Photo: DLH NWS.
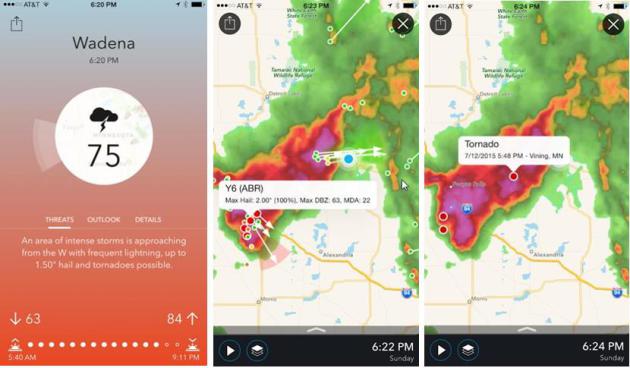
Tracking The July 12 Downburst.
I was at our cabin near Breezy Point Sunday evening, tracking the
severe storms on my iPhone using my company's new weather app:
Aeris Pulse
(which will set you back a whopping 99 cents, of which I get
approximately....zero). Not only do you get a running narration of
threats nearby but you can see detailed Doppler radar information,
direction of storm cells, hail size and rotation, along with storm
reports, wind data and the ability to keep track of multiple locations.
Oh, you can see hour by hour forecasts and the 7-Day too, The phones
came in handy, for information and flashlight capabilities. The power
went out but somehow cell towers stayed up and my phone was the only way
I could keep in touch.
Highly Variable Rainfall in Minnesota First Half of July. Here's an excerpt from this week's edition of Mark Seeley's
WeatherTalk: "...
Rainfall
in July has been highly variable, but with some observers already
reporting above normal totals for the month. In the northwestern portion
of the state New Folden (Marshall County) has already received 6.33
inches; in the north-central part of the state Aitkin reports 5.24
inches; in central Minnesota Milaca reports 5.13 inches and Mora reports
5.26 inches; in southern Minnesota Farmington reports 5.85 inches and
Hastings 5.29 inches..."
ADVERTISEMENT
More
than 100mm of rain fell on the Norwegian village of Ogndal, an amount
rarely seen outside the tropical rainforests of Brazil or Indonesia. The
downpour, which left farm animals petrified and meteorologists
scratching their heads, is believed to have shattered records for the
area,
the Local has reported.
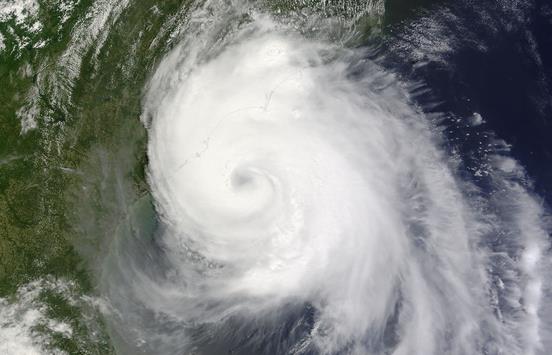
4 Reasons The Atlantic Hurricane Season Has Been So Quiet - And Is Likely To Stay That Way. Here's an excerpt from a good post at
The Capital Weather Gang: "...
The
lazy summer comes as no surprise to seasonal hurricane forecasters who
all predicted a relatively inactive season before it began June 1. NOAA’s forecast in late May called
for a 70 percent chance of a below-average season, with six to 11 named
storms, three to six of which could become hurricanes, and up to
two major hurricanes. It was the highest probability of a below-average
season that NOAA had ever forecast..."
Image credit above: "
The
first hurricane of the 2014 season made landfall in North Carolina. The
U.S. has had no such hurricane landfall this year, nor any hurricane
development in the Atlantic Ocean." (NASA).
The End of Capitalism Has Begun.
Companies reinvent themselves, or they die, as new crops of start-ups
innovate and take their place. Will the same thing happen with
market-based societies? My hunch is that we're moving, in fits and
starts, toward a more sustainable, resilient form of capitalism. Then
again I am a naive optimist. One observation: nothing stays the same;
even our current economic system may have to change with the times. This
will make a lot of old, white guys in Washington D.C. and New York City
very, very nervous. Because nobody likes to be disrupted. Here's an
excerpt of an interesting read from The Guardian: "...Postcapitalism
is possible because of three major changes information technology has
brought about in the past 25 years. First, it has reduced the need for
work, blurred the edges between work and free time and loosened the
relationship between work and wages. The coming wave of automation,
currently stalled because our social infrastructure cannot bear the
consequences, will hugely diminish the amount of work needed – not just
to subsist but to provide a decent life for all. Second, information is
corroding the market’s ability to form prices correctly. That is because
markets are based on scarcity while information is abundant..."
States Are Polluting Less And Their Economies Are Doing Just Fine.
Grist has the details; here's the introduction: "
Even
as America’s economy started to rebound from the recession between 2008
and 2013, climate change–causing power plant emissions in the majority
of American states did not, according to a new study. Earlier this year, environmentalists celebrated the news that, while the world’s economy continued to grow, CO2 emissions remained flat in 2014. This new report is the most thorough examination so far of how that trend is playing out in the U.S..."
Smartphone Usage Could Be Analyzed To Warn of Depression. Here's something of a head-scratcher, but maybe there's some merit to this. Details from
Gizmag; here's a clip: "
One
of the problems with depression is that because it often forms so
gradually, many people don't even realize that they're suffering from it
– they just assume that normal life is pretty dreary. With that in
mind, researchers from Chicago's Northwestern University have devised a
method of analyzing at-risk individuals' smartphone use, to see if
they're developing signs of the disorder..." (File photo: Shutterstock).
A Breathalyzer That Measures Cannabis? Quartz has the story; here's the intro: "
Legalizing
marijuana isn’t just about dropping rules—it’s also about creating new
ones. In the US, where over half of US states have now legalized some
degree of pot use, one of those new rules requires setting a limit on
marijuana intake while driving. That has drawn private tech companies,
such as Vancouver’s Cannabix Technologies, to develop a breathalyzer that detects Tetrahydrocannabinol (THC) levels of drivers for police officers to use at the roadside..."
TODAY: No drama. Sticky sunshine, probably storm-free. Dew point: 72. Winds: SW 10. High: 89
SATURDAY NIGHT: Mostly clear, turning slightly cooler. Low: 65
SUNDAY: Warm sun, less humidity. Dew point: 59. Winds: NW 10. High: 86
MONDAY: Sunny and pleasant. Wake-up: 68. High: 88
TUESDAY: Partly sunny, probably dry. Wake-up: 70. High: 86
WEDNESDAY: Few T-storms late in the day. Wake-up: 71. High: 84
THURSDAY: Morning showers, some PM sun. Wake-up: 70. High: 87
FRIDAY: Hot sun, severe storms late? Wake-up: 72. High: 91
Climate Stories....
A Cheap But Dangerous Global Warming Fix. Paging
Dr. Evil. Dr. Evil, your Gulfstream 7 is ready with the chemicals you
requested. God help us if we ever get to this stage. Here's an excerpt
of an interview at the
PBS Newshour: "...
A
controversial, but cheap solution of last resort has emerged known as
“solar radiation management.” A geoengineering technique, it would shoot
particles into the sky to reflect sunlight back to space. “The central
idea is to make the planet a little bit more reflective, which tends to
cool it down, because it will absorb less sunlight. And that will
partially and imperfectly compensate for the buildup of greenhouse gases
like carbon dioxide, which are tending to trap heat and make the earth
warmer,” says Harvard environmental scientist David Keith, who works at
the intersection of environmental science, energy technology and public
policy..."
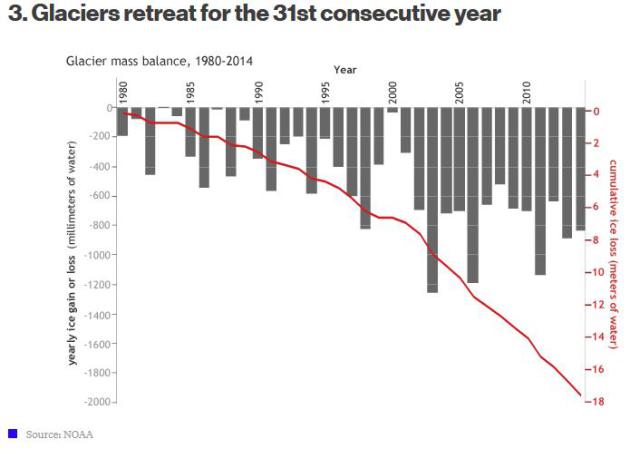
The Freakish Year In Broken Climate Records. It's
getting harder to ignore or refute the evidence. Forget the models,
just look at current conditions and trends worldwide. Here's an excerpt
from
Bloomberg Business: "
The annual State of the Climate report
is out, and it’s ugly. Record heat, record sea levels, more hot days
and fewer cool nights, surging cyclones, unprecedented pollution, and
rapidly diminishing glaciers. The U.S. National Oceanic and Atmospheric
Administration (NOAA) issues a report each year compiling the latest
data gathered by 413 scientists from around the world. It’s 288 pages,
but we’ll save you some time. Here’s a review, in six charts, of some of
the climate highlights from 2014..."
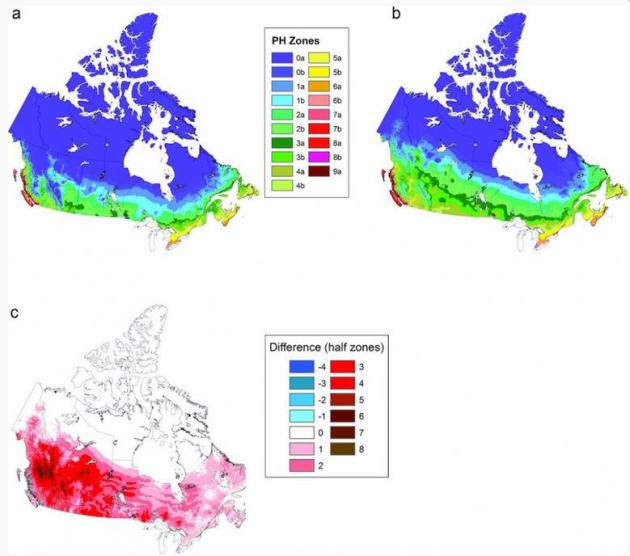
Climate Change Brings New Crops to Canadian Farms. Climate Central takes a look at the trends just north of the border; here's an excerpt that sparked interest: "...
The
Canadian Plant Hardiness Zone Maps are similar to the USDA’s, but they
take more variables into account, such as the average frost free period
and average maximum snow depth. The newest incarnation of the Canadian
PHZM showed that when comparing the numbers from 1931 to 1960 to the
numbers from 1981 to 2010, the average of the lowest daily temperatures
of the coldest month increased by 1.5 degrees Celsius; the frost free
period increased by 11 days, on average. The changes give
Canadian farmers more leeway in the plants they can grow, Pedlar said.
Even crops like corn and soybeans, which require longer, warmer growing
seasons, are now being grown in Canadian spaces they previously
couldn't..."
Map credit above: "
Canadian
plant hardiness (PH) zone maps for (a) 1931–1960, (b) 1981–2010, and
(c) the difference between those (1981–2010 minus 1931–1960)." Credit: American Institute of Biological Sciences.
Hillary Gets Heckled.
Wait, taking campaign donations from fossil fuel companies might impact
your worldview of carbon-based fuels vs. clean, renewable alternatives?
How quickly can we move and what is the role for regulation vs. opening
up the markets to speed up the transition? Here's an excerpt from Slate: "...The
trouble for Clinton started during a question-and-answer segment, when
she was asked a yes-or-no question about whether she would ban the
extraction of fossil fuels from public grounds. “The answer is no until
we get alternatives in place,” Clinton answered. That response, in turn,
prompted an aggressive follow-up from a second person in the crowd: “Is
your refusal to take leadership on climate change due to the fact that
you have contributions from the fossil fuel industry in your campaign?”
Clinton, who has spent the bulk of her campaign events fielding
questions from pre-screened voters, appeared to get caught flat-footed..."
File photo credit: "
Democratic
presidential candidate Hillary Rodham Clinton listens to a question
from a guest after a town hall meeting in Dover, N.H., Thursday, July
16, 2015." (AP Photo/Charles Krupa).
Warming of Oceans Due To Climate Change is Unstoppable, Say U.S. Scientists.
The Guardian has the article; here's a snippet: "...
Even
if we were to freeze greenhouse gases at current levels, the sea would
actually continue to warm for centuries and millennia, and as they
continue to warm and expand the sea levels will continue to rise,”
Johnson said. On the west coast of the US, freakishly warm temperatures
in the Pacific – 4 or 5F above normal – were already producing warmer
winters, as well as worsening drought conditions by melting the
snowpack, he said.The extra heat in the oceans was also contributing to
more intense storms, Tom Karl, director of Noaa’s National Centers for
Environmental Information, said..."
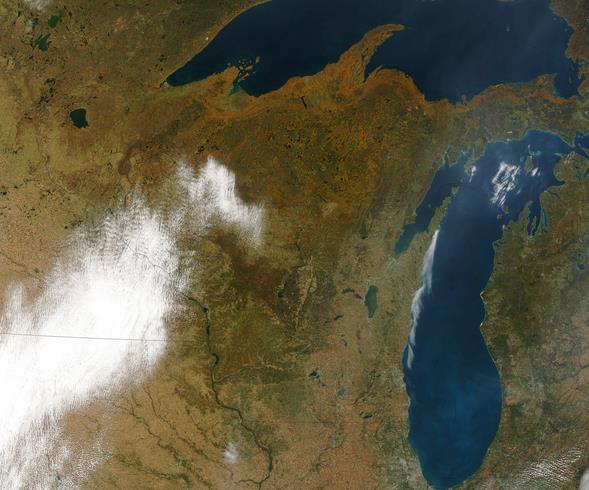
Wisconsin Good for Retirement, Bad for Climate Change. Here's a clip from a story at
The Milwaukee Journal-Sentinel: "...
Not
only is Wisconsin great to retire rich in, but it's also one of the
best states to live in when preparing for retirement, according to
research from the LPL Research Retirement Index, as reported by Forbes.
Wisconsin came in at No. 5 on the list, which ranked states based on
six categories, including financial, health care, housing and community
quality of life. Virginia topped the list, while New York came in at the
bottom. Wisconsin's Midwestern neighbor Minnesota was No. 3. If
weather.com's Climate Disruption Index
is correct, hopefully you're not too far from retirement. The website
looked at the 25 U.S. cities (with populations above 200,000) that would
be most affected by climate change, with both Madison (No. 23) and
Milwaukee (No. 18) both making the list..." (File image: NASA Earth Observatory).
"Hurricane" Schwartz: Are You A Climate Rejector or Acceptor? Glenn Schwartz is a friend, and a veteran TV meteorologist in Philadelphia; here's an excerpt of his thoughts at
philly.com: "...
But
that’s not where most of the climate change specialists live. They
publish papers and give lectures at scientific conferences. That’s where
the 97% + is: Surveys of climate scientists who publish “peer reviewed”
papers (thousands of them) agree with the basic consensus. That doesn’t
mean they agree on everything. For example, the connection between
hurricanes and climate change, tornadoes and climate change, and El Nino
and climate change are hotly debated..."
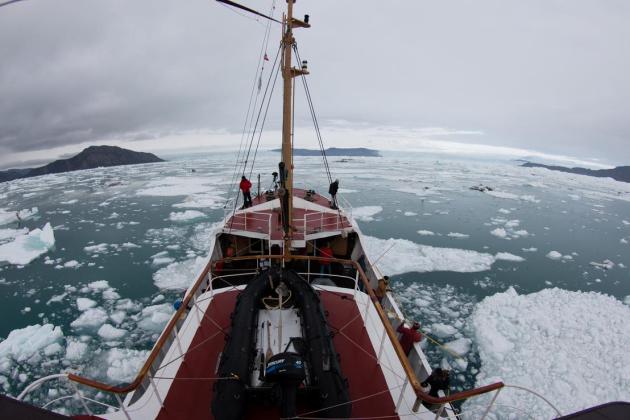
Greenland's Fjords Are Far Deeper Than Previously Thought, And Glaciers Will Melt Faster, Researchers Find. AGU (American Geophysical Union) Blogosphere has the story - here's the intro: "
West
Greenland’s fjords are vastly deeper than rudimentary models have
shown, allowing intruding ocean water to badly undercut glacier faces,
which will raise sea levels around the world much faster than previously
estimated. Those are the findings of a University of
California-Irvine-led research team that battled rough waters and an
onslaught of icebergs for three summers to map the remote channels for
the first time. The results have been accepted for publication
in Geophysical Research Letters, a journal of the American Geophysical
Union and are now available online..."
Photo credit above: "
University
of California-Irvine and JPL glaciologists aboard the Cape Race in
August 2014 mapped for the first time remote Greenland fjords and ice
melt that’s raising sea levels around the globe." Credit: Maria Stenzel.
Lindsey Graham: "Why Don't Republicans Believe The Scientists on Climate Change?"
I can answer that one: because they fear the cure will be worse than
the disease, that solving this problem will require massive new federal
subsidies, regulations; an EPA on steroids. Merely acknowleding the
elephant in the living room will require bigger government, more
government,which means less personal freedom. When, in fact, any
solutions will stimulate business, innovation and global
competitiveness, adding (clean energy) jobs while reducing the risk to
future generations. Here's an excerpt from
ThinkProgress: "
Well I’m not a scientist,” Graham responded, echoing the numerous lawmakers
who have plead ignorant to the mechanisms behind the earth’s weather
and climate when asked if they think climate change is happening. “I
know I’m not a scientist,” he continued, “but here’s the problem I’ve
got with some people in my party: When you ask the scientists what’s
going on, why don’t you believe them? If I went to 10 doctors and nine
said, ‘Hey, you’re gonna die,’ and one says ‘You’re fine,’ why would I
believe the one guy?...”
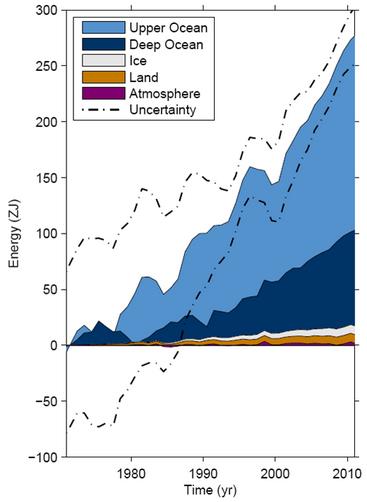
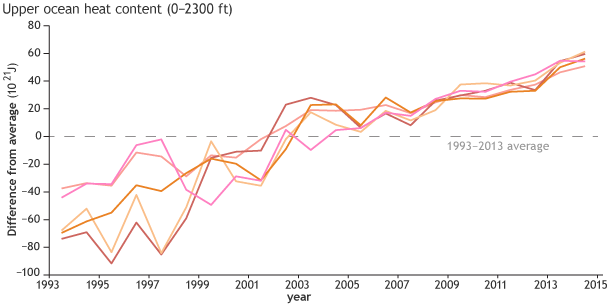
NOAA State Of The Climate Report: Which Seven Records Were Broken in 2014? One of many records was ocean heat content according to a summary at
Carbon Brief; here's an excerpt: "...
It
wasn't just the surface of the oceans that had a warm year, the report
finds. Measurements over the top 700m of the ocean show that 2014 was
also a record year for the amount of heat stored in the ocean.
This reflects the continued increase of energy in the oceans, which
absorb over 90% of the heat trapped in the atmosphere by greenhouse
gases, the report says..."
Image credit above: "Ocean heat content each year since 1993 compared to the 1993-2013 average (dashed line) from a variety of data sources." Graph adapted from Figure 3.7 in
State of the Climate in 2014
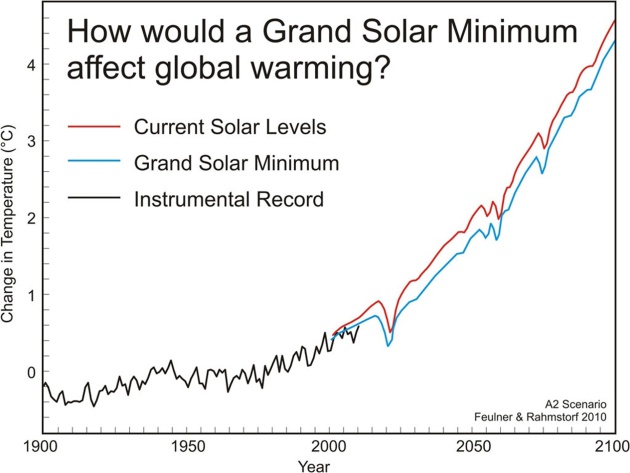
No, The Sun Isn't Going To Save Us From Global Warming.
The Guardian has the explanation - here's an excerpt: "
Some zombie myths just won’t die. In fact, I debunked this one two years ago right here at The Guardian.
To sum up, a number of scientific studies have asked the question, ‘if
the sun were to enter another extended quiet phase (a grand solar
minimum), how would that impact global surface temperatures?’. Every
study agrees, it would cause no more than 0.3°C cooling, which would
only be enough to temporarily offset about a decade’s worth of
human-caused global warming..."
Image credit above: "
The
global mean temperature difference is shown for the time period 1900 to
2100 for the IPCC A2 emissions scenario. The red line shows predicted
temperature change for the current level of solar activity, the blue
line shows predicted temperature change for solar activity at the much
lower level of the Maunder Minimum, and the black line shows observed
temperatures through 2010." Adapted from Feulner & Rahmstorf (2010) by SkepticalScience.com.


No comments:
Post a Comment