35 F. maximum temperature yesterday in the Twin Cities.
24 F. average high on January 23.
23 F. high on January 23, 2016.
January 24, 1950: An ice storm develops over southwest Minnesota. Ice on telephone wires from 1/3 to 1.5 inches. Bismarck, North Dakota had 17 inches of snow. A Northern Pacific passenger train derailed at Detroit Lakes with no injuries.
January 24, 1925: A solar eclipse is seen across northern Minnesota during the morning. The Duluth Herald reported that chickens were 'puzzled by the dark morning' and didn't leave their roosts.
Sloppy, Plowable Snowfall for MSP Metro and Southern Minnesota
I have been roused from my midwinter coma, thrilled to have something to track on Doppler radar. A fresh shellacking of wet, sloppy, March-like snow is likely tonight, and it may be 3-5 inches for the south metro - enough to plow and shovel. Temperatures stay above 32F, meaning some freeways will stay wet and slushy.
The worst travel conditions come tonight, south of the metro area. Considering we're running a 7 inch snowfall deficit so far this winter I'm not about to whine.
Temperatures cool off slightly for the start of the U.S. Pond Hockey Championships on Thursday. Long-range GFS data hints at a cold start to February; ECMWF (European) model data keeps the coldest air north of Minnesota. It would be fair to assume more cold fronts are imminent.
But let's keep some perspective. Alaska climate guru Brian Brettschneider has compiled a "Dreariness Index", based on total rainfall, wet days and cloud cover. Minnesota enjoys far more sunshine than New England, the Great Lakes or Pacific Northwest. In fact we rank right up there with Florida! It's on the Internet - must be true!
60-hour 4 KM NAM Snowfall Guidance through 12z Thursday courtesy of NOAA and Tropicaltidbits.com.
The Dreariness Index. My thanks to climate guru Brian Brettschneider (based in Alaska) for whipping together a useful index that combines total precipitation, wet days and average cloud cover to create one index that summarizes how gray/damp a specific part of the USA is. Here's an excerpt from Brian's post: "In previous posts, I have looked at total rainfall, number of wet days, and cloud cover independently of one another. Now seems like a good time to combine these variables to come up with a single composite value. Three different variables are used in this analysis to come up with Dreary Index – total annual precipitation, number of days per year with measurable precipitation, and average annual cloud coverage. An inverses distance weighted surfacing technique was used to generate a gridded data set for the entire U.S. for each of the three variables..."
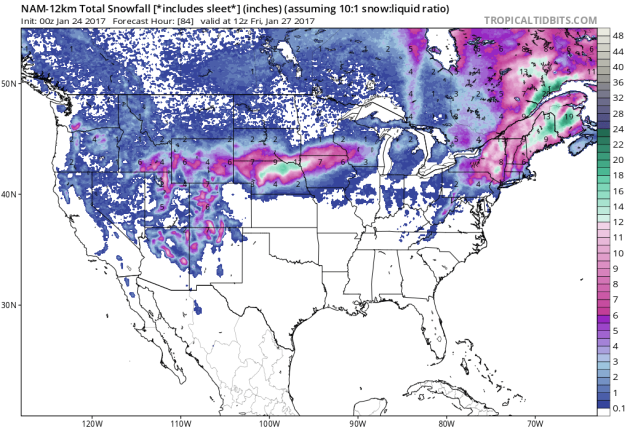
84-Hour Forecast. Here is 12 KM NAM guidance, showing today's Nor'easter pushing 50-60 mph wind gusts across coastal Massachusetts and New Hampshire into Maine. Meanwhile the storm that whacked southern California Sunday spreads a band of accumulating snow across the northern Plains and Upper Midwest today and Wednesday, followed by a northwesterly flow of moderately colder air the latter half of the week.
A Rare and Wondrous Snow Event. Ah, so this is what they mean by "snow". I get it now - water actually freezes into fancy little ice crystals that stick together, gravity pulls them to the ground at an average speed of 3 mph. And traffic grinds to a halt on I-35. It's just snow folks, not billowing clouds of radioactivity. Couple inches of slush for most of us - but enough to lead the news and spark waves of indignant muttering about the weather and traffic getting worse. Southern Minnesota will see the heaviest snows, enough to shovel and plow - and remind the locals they live in a far southern suburb of Winnipeg.

Super-Sized January Thaw. Here's more perspective on this current of temperatures above 32F, courtesy of Dr. Mark Seeley and Minnesota WeatherTalk: "...The proverbial "January Thaw" (two or more consecutive days with daily high temperatures greater than freezing) for the Twin Cities has historically about an 80 percent probability of occurrence (about a 91 percent probability since 1980 with a pronounced urban heat island effect). This January it is happening to us with an exclamation mark! We may have up to 10 consecutive days with daily high temperatures above freezing if the forecast through January 26th verifies. In this context it would be the 5th longest such streak in the Twin Cities climate records surpassed only by 18 days in January 1944, 15 days in January 1942, 13 days in January 1919, and 11 days in January 1880 and 1909. (thanks to NOAA's Michelle Margraf and DNR-SCO's Pete Boulay for pointing this out). Over 50 Minnesota climate stations have already reported daytime highs in the 40s F this week, including 48°F at both Grand Rapids and Forest Lake on the 18th..."
GOES-16 Image Gallery. Test imagery for CONUS and the full disk is available here.
The First From the New Weather Satellite Just Arrived, and They're Absolutely Incredible. Angela Fritz reports for Capital Weather Gang: "The satellite formerly known as GOES-R (so Prince, right?) has transmitted its first images back to Earth, and they are flooring. From the details on the face of the moon to the incredible resolution of cumulus over the Caribbean, these first pixels portend a sunny future for NOAA’s new GOES-16 satellite. Meteorologists are drooling. This release coincides with the first day of the American Meteorological Society’s annual meeting. There are thousands of weather geeks in Seattle this week, and — at least on Monday — they’re all looking at this next-gen satellite imagery. As we’ve written before, GOES-R satellite has six instruments, two of which are weather-related. The Advanced Baseline Imager, developed by Harris Corp., is the “camera” that looks down on Earth. The pictures it sends back will be clearer and more detailed than what’s created by the current satellites..."
Image credit: "GOES-16 captured this view of the moon, as it looks across the Pacific Northwest on Jan. 15. As with earlier GOES spacecraft, GOES-16 will use the moon for calibration." (NOAA/NASA).
"Not something you are unfamiliar with at this point, but just wanted to say that 12 of the 16 deaths in GA this past weekend occurred in tornadoes that took place in the middle of the night (2-4am local time). Quite a rare time for tornado activity. It certainly creates a unique "Dixie Alley" tornado danger that is almost unheard of the in the Central Plains (i.e., their tornadoes are mostly afternoon/evening occurrences)..."
- meteorologist Dan Lilledahl, Atlanta
Photo credit: "Among the structures damaged by a tornado that moved through Albany, GA, on Sunday, Jan. 22, 2017, was this gas station." Image credit: AP Photo/Branden Camp.
Putting High Risk Severe Outbreaks Into Perspective. An average of 51 to 62 tornadoes? I learned something at ustornadoes.com; Ian Livingston takes a look at the average number of tornadoes during high-risk severe days since 2000, as defined by NOAA SPC: "Looking at the averages from these events, the numbers are fairly stark. Since any small sample that includes April 27, 2011 is going to be skewed more than normal, I’ll share the figures with and without it included (these are 15 and 14 event averages respectively):
- With 4/27/2011: Average high risk has 62 tornadoes, 16 of which are strong (EF2+), and two are violent (EF4-5). Four killer tornadoes occur on average, causing 31 deaths. The deadliest averages 10 killed. The longest track tornado averages 58.0 miles.
- Without 4/27/2011: Average high risk has 51 tornadoes, 13 of which are strong, and one is violent. Two killer tornadoes occur on average, causing 11 deaths. The deadliest averages six killed. The longest track tornado averages 52.7 miles..."
The First Observations of Sea Ice Came From 8th Century Irish Monks in Iceland. Who knew? Atlas Obscura has more detail: "...Iceland
was settled more permanently in the 900s, and the people living there
started keeping records of sea ice and icebergs that an Icelandic
geographer later used to reconstruct sea ice records in the area going
back to 1,000 A.D. More systematic records of Arctic sea ice weren’t
collected until about a millennium after Iceland was first settled. In
the 1880s, the Danish Meteorological Institute started drawing up sea
ice charts using reports from the shore and sea, from ships and
scientific expeditions, as the National Snow & Ice Data Center explains,
and by the turn of the century, the institute was regularly publishing a
report on “The State of the Ice in the Arctic Seas” that covered the
whole Arctic..."
Photo credit: "The frozen sea goes north." Pink floyd88 a/CC BY-SA 3.0
Image credit: "A true color image of 2016 Hurricane Matthew making landfall over the U.S. eastern coast. True color imagers have historically been a part of many polar-orbiting satellites, unlike their geostationary cousins." Image credit: SSEC.
Image credit: iweathernet.com.
Solar Employs More Workers Than Coal, Natural Gas and Oil Combined. Here's a clip from EcoWatch: "U.S. solar employs more workers than any other energy industry, including coal, oil and natural gas combined, according to the U.S. Department of Energy's second annual U.S. Energy and Employment Report. 6.4 million Americans now work in the traditional energy and the energy efficiency sector, which added more than 300,000 net new jobs in 2016, or 14 percent of the nation's job growth..."
Photo credit: Walmart, Flickr.

Photo credit: Slate, which is skeptical about the whole flying car thing.

Predicting the Weather with Shark Oil. Hey, I'll give it a try. Atlas Obscura reports: "Hanging
outside the homes across Bermuda are little vials of fluid that are the
locals’ secret to predicting the island weather. Or so they say.
Bermuda has a long tradition of using shark oil as a meteorological
tool, but the true efficacy and mechanics of the predator’s oil is a
matter of debate. According to the Bermuda Institute of Ocean Sciences (BIOS),
the local tradition of using a vial of shark oil to predict the weather
has been in place for up to 300 years. “Now where they developed, I
don’t know,” says Captain Alan Card, a lifelong Bermuda fisherman, now
69. “I can remember 65 years ago seeing a bottle of shark oil hanging
down at the marina...”

TODAY: Winter Storm Watch/Warning southern Minnesota. Snow arrives, getting slushy by afternoon. Winds: E 8-13. High: 36
TUESDAY NIGHT: Heavier wet snow - slow, sloppy, slippery travel, especially south of MSP. Low: 30
WEDNESDAY: Snow slowly tapers. 1-3" north metro, 3-6"+ possible south metro. Winds: NW 10-20. High: 33
THURSDAY: Mostly cloudy, colder breeze. Winds: NW 10-15. Wake-up: 24. High: 29
FRIDAY: More clouds than sun, "average" temperatures. Winds: W 8-13. Wake-up: 18. High: 26
SATURDAY: Mix of clouds and sun, still dry. Winds: NW 10-15. Wake-up: 17. High: 27
SUNDAY: More sun, less wind. Not bad for late January. Winds: NW 5-10. Wake-up: 13. High: 26
MONDAY: More clouds, breezy and milder. Winds: SW 10-15. Wake-up: 20. High: 37
Climate Stories...
Think Global Warming's a Fraud? These Scientists Want to Change Your Mind. Here's an excerpt from The Columbus Dispatch: "...In my opinion, the most convincing piece of evidence for a "discernible human influence" on global climate is the very distinctive pattern of warming of the lower atmosphere (the troposphere) and cooling of the upper atmosphere (the stratosphere). We know of no natural causes that can produce such changes. This pattern of tropospheric warming and stratospheric cooling is a clear 'fingerprint' of human-caused changes in greenhouse gases … and it was predicted 50 years ago by Suki Manabe and his colleagues at the Geophysical Fluid Dynamics Lab in Princeton using only very sparse temperature measurements from weather balloons. Subsequent satellite observations confirmed professor Manabe's prediction..."
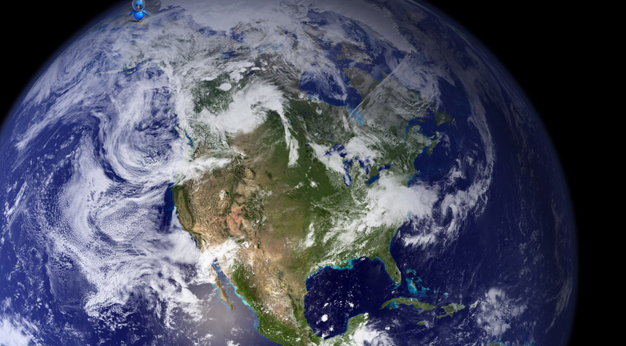
Photo credit: "Highway 63 is washed out in the Town of Grand View in Bayfield County in July 2016 due to heavy rains. More flooding is predicited with climate change. State emergency planners posted information online last week on climate change planning." (Photo: Photo courtesy of Ready Wisconsin, Photo courtesy of Ready Wisconsin).

Alternate Facts. Thanks to Tim O'Brien for the illustration above. It gave me a lot to think about.

The Scramble to Protect Climate Data Under Trump. Here's an excerpt from InsideClimate News: "More than 250 people gathered at the University of Pennsylvania last week for Data Rescue Philly,
one of the latest examples of a grassroots effort to save environmental
and climate change data that scientists fear could vanish under the
Trump administration's many climate deniers. Over two days, volunteers from academia, nonprofits and the tech industry were trained and then preserved data from more than 3,000 websites hosted by the National Oceanic and Atmospheric Administration. Bethany Wiggin,
director of the Penn Program in the Environmental Humanities (PPEH),
said the idea emerged from conversations recalling how government data
became less accessible during the George W. Bush administration. Wiggin
said a scan of agency websites showed that some data sets were archived
in multiple locations, while others were more vulnerable..."
Photo credit: "Volunteers
gathered at an event at the University of Pennsylvania to archive
climate data that could be vulnerable under the Trump administration." Photo courtesy of DataRefuge.
Earth Sets a Temperature Record for the Third Straight Year. Just in case you missed Justin Gillis's report at the New York Times: "...In 2015 and 2016, the planetary warming was intensified by the weather pattern known as El Niño, in which the Pacific Ocean released a huge burst of energy and water vapor into the atmosphere. But the bigger factor in setting the records was the long-term trend of rising temperatures, which scientists say is being driven by increasing levels of carbon dioxide and other greenhouse gases. “A single warm year is something of a curiosity,” said Deke Arndt, chief of global climate monitoring for the National Oceanic and Atmospheric Administration. “It’s really the trend, and the fact that we’re punching at the ceiling every year now, that is the real indicator that we’re undergoing big changes...”
Photo credit: "Ice in the Arctic Ocean’s Chukchi Sea region. “What’s going on in the Arctic is really very impressive; this year was ridiculously off the chart,” said Gavin A. Schmidt, the head of NASA’s Goddard Institute for Space Studies." Credit: Esther Horvath.

Fearing White House Purse of Climate Science, Scientists Frantically Copying Data. Here's an excerpt from a story at Forbes: "...After the election in November, a bipartisan group of defense experts and former military leaders urged the President-Elect, through the Trump Transition Team, to consider climate change as a grave threat to our national security. In 2014, the Military Advisory Board came out with a report, called National Security and the Accelerating Risks of Climate Change, that discusses what the military sees as the threats of climate change and the actions to be taken to mitigate them: “The potential security ramifications of global climate change should be serving as catalysts for cooperation and change. Instead, climate change impacts are already accelerating instability in vulnerable areas of the world and are serving as catalysts for conflict...”
Photo credit: "A U.S. Navy Carrier Strike Group in the South China Sea. The U.S. military is worried that climate change is a significant threat multiplier for future conflicts. And the Navy may bear the brunt of these effects. Unfortunately, the new Administration is purging this type of thinking from all branches of government, including our military." Source: U.S. Navy photo by Mass Communication Specialist 1st Class David Mercil/Released.
No comments:
Post a Comment