1 hour and 26 minutes of additional daylight since December 21.
21 F. high yesterday in the Twin Cities.
27 F. average high on February 9.
17 F. high on February 9, 2016.
Trace of snow on the ground at MSP International Airport.
February 10, 1861: An ice storm impacts Elk River. Coatings of 1/2 inch of ice are reported. The ice broke off many large branches and saplings were bent to the ground.
February 10, 1857: Extreme cold at Fort Ripley. E.J. Baily, Assistant Surgeon notes: 'Spirit thermometer -50 at 6am. Mercury frozen in charcoal cup. Spirit thermometer at Little Falls 16 miles from the fort -56 at 6am. The lowest degree of cold on record in the territory'.
Minnesota Winters: The Bark Is Now Worse Than The Bite
We've all had the conversation - the weather intervention. "How do you people LIVE up there with the winters being SO BAD?" I don't know, how do you live with hurricanes, scorching heat and the ever-present threat of earthquakes? We get by.
Based on snowfall & temperatures this has been yet another mild winter, according to the Minnesota DNR's Winter Misery Index. If anyone asks, the Twin Cities have only seen 2 severe winters since 2000. There were 2 severe winters in the 90s, 3 in the 80s, 4 in the 70s and 5 in the 1960s. At the rate we're going snowbirds may move back.
A good thing? Please discuss amongst yourselves.
10 of the next 15 days are forecast to see highs in the 40s, according to the ECMWF (European) model. A week from now highs may top 50F as far north as Brainerd. No accumulating snow to speak of, but plenty of mud in the coming weeks. Gloriously unsettling.
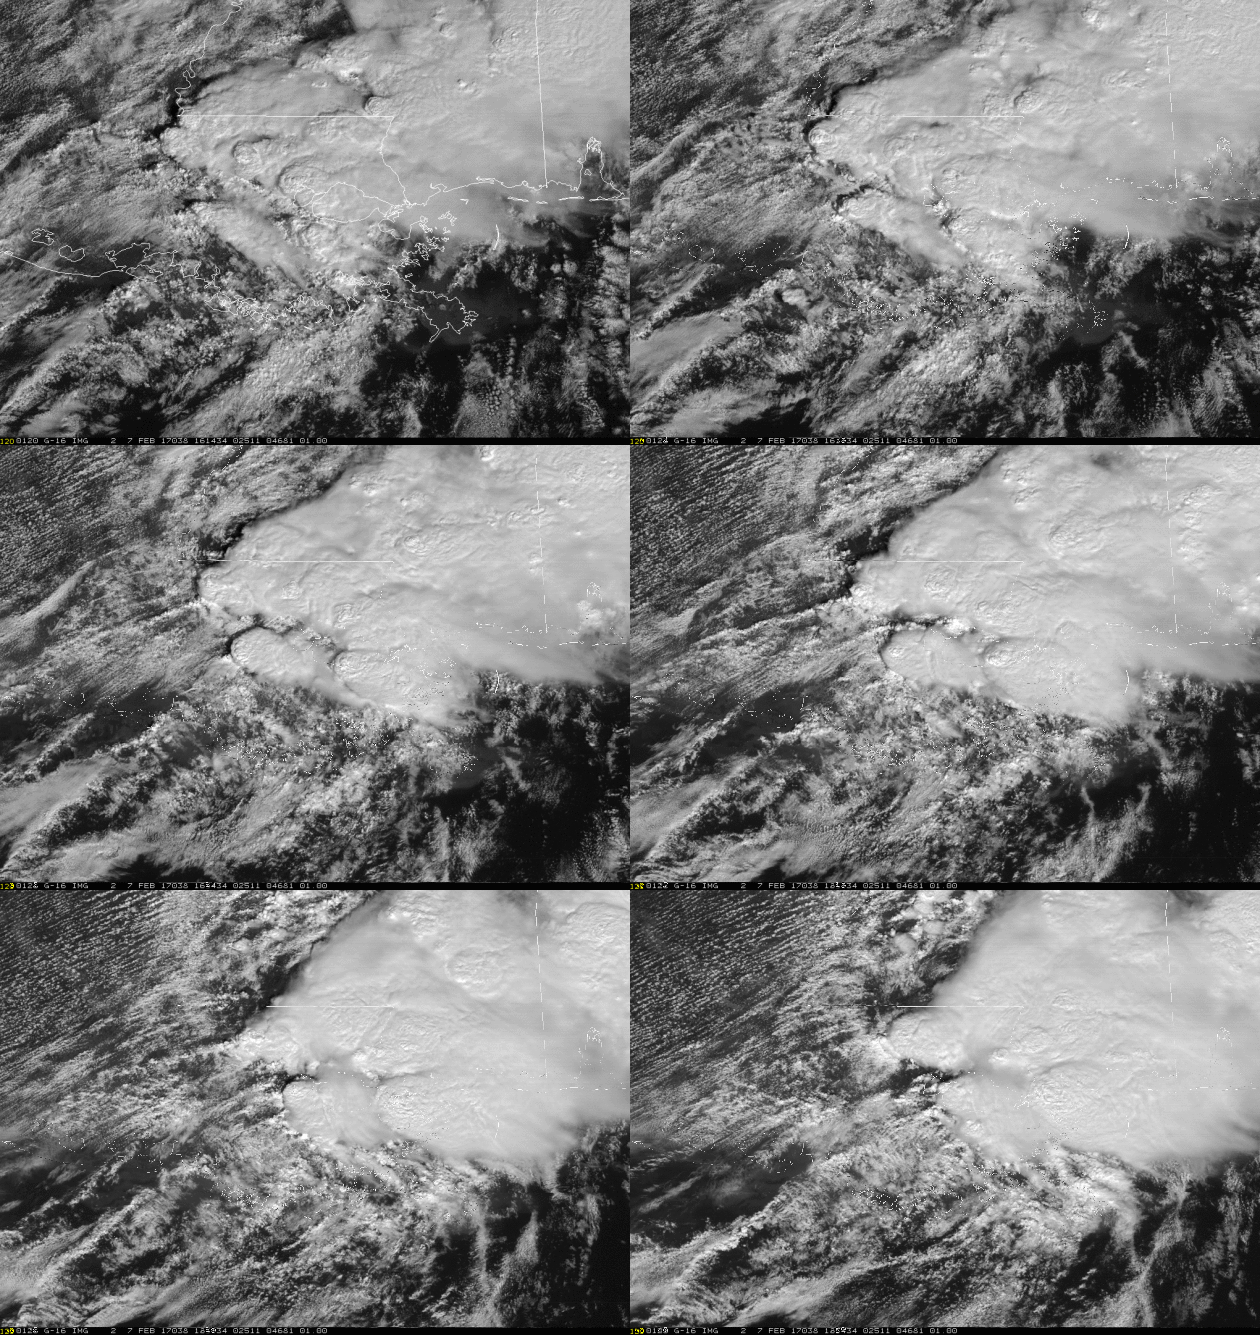
Meanwhile the northeast is digging out from the biggest blizzard of the winter. The EF-3 tornado that hit New Orleans was the strongest they've ever seen.
Minnesota? We seem to have skipped a month.
Winter Misery Index courtesy of the Minnesota DNR. Click here for details on how the index is calculated.
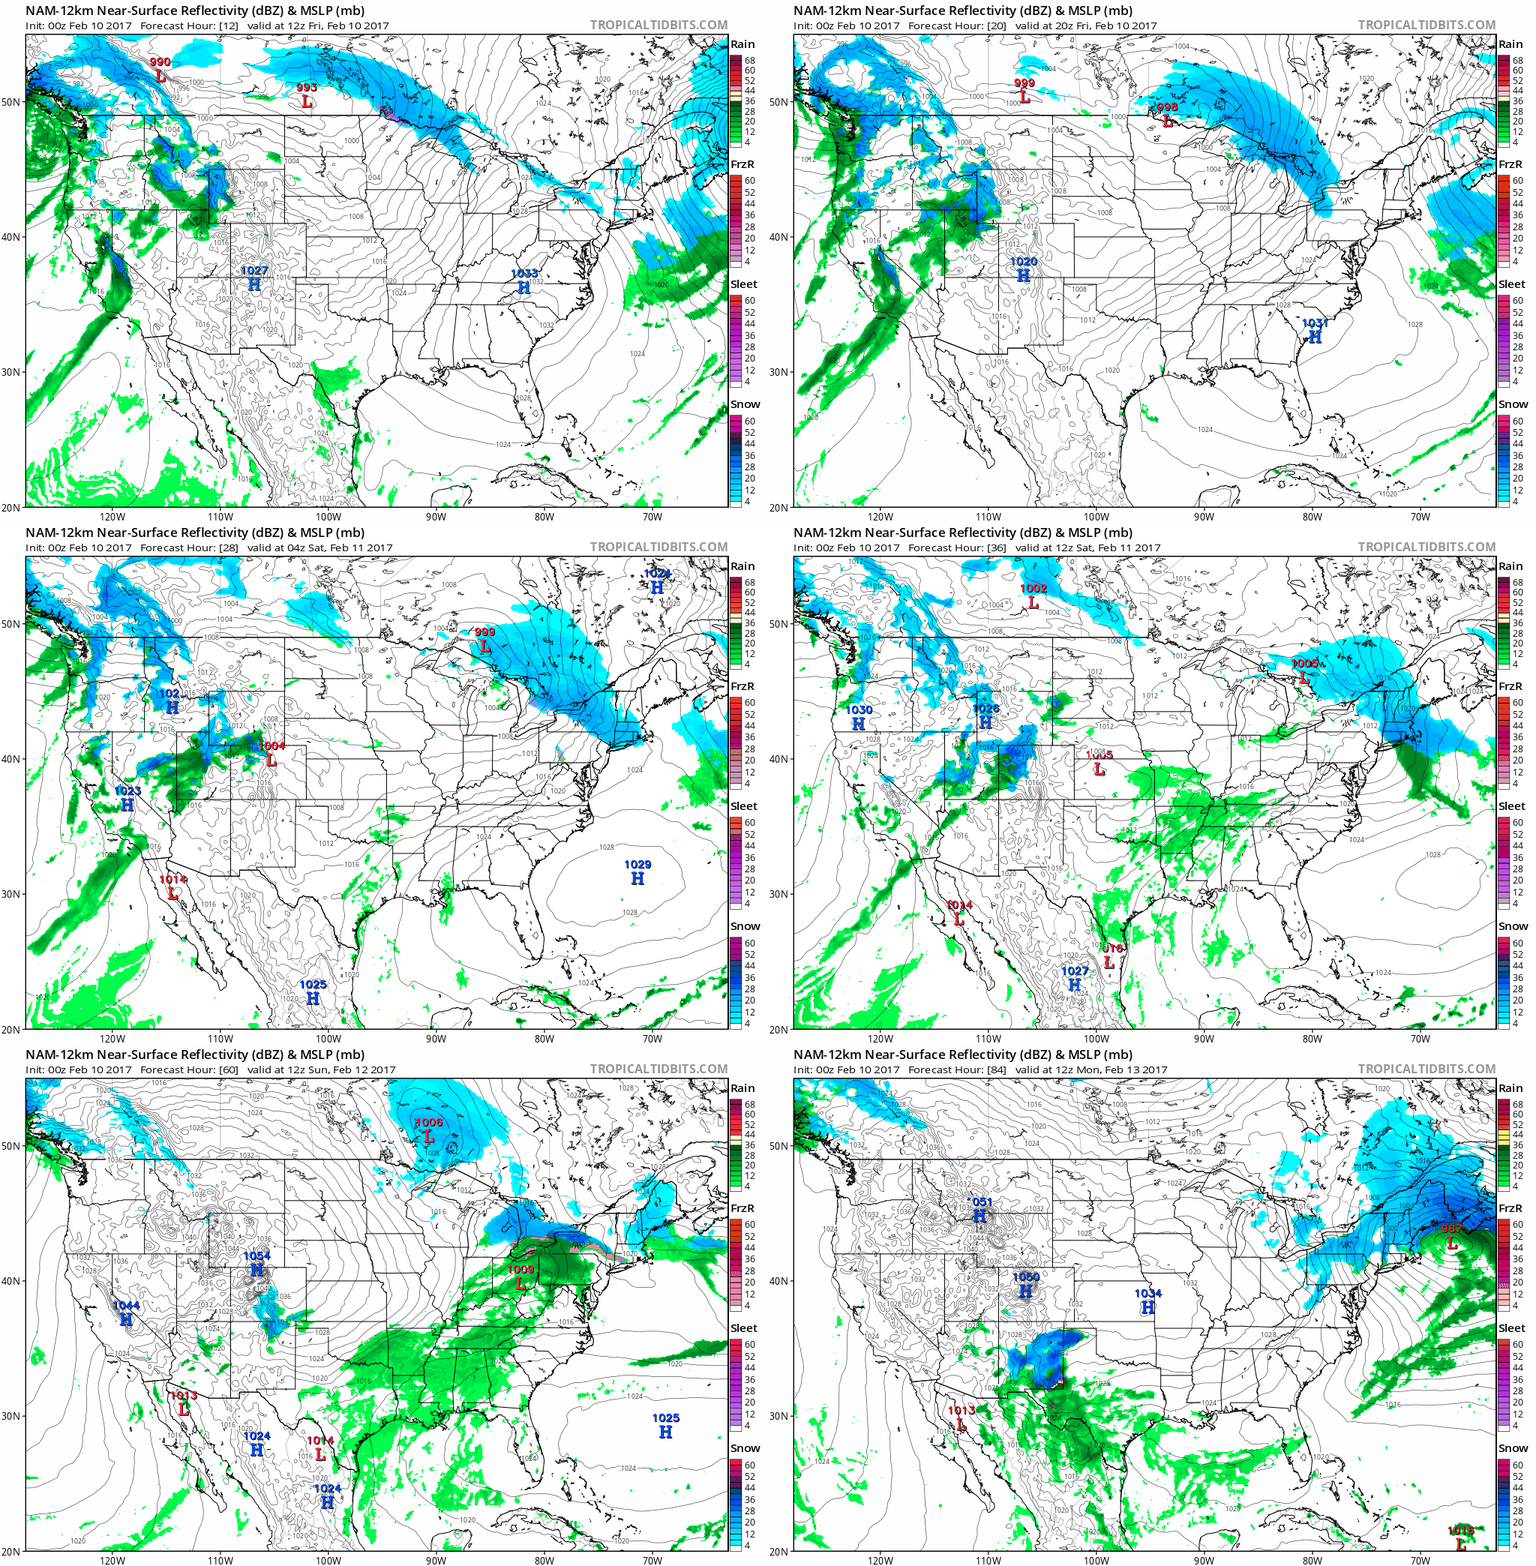
Leap-Frogging into March Early. There's a lot of green (rain) on the Future Radar animation (NAM data) for February. Guidance shows a few more inches of snow spreading into New England by the weekend; more heavy snow for the Rockies with rain for most of Texas and the Mid South. 84-hour loop: NOAA and Tropicaltidbits.com
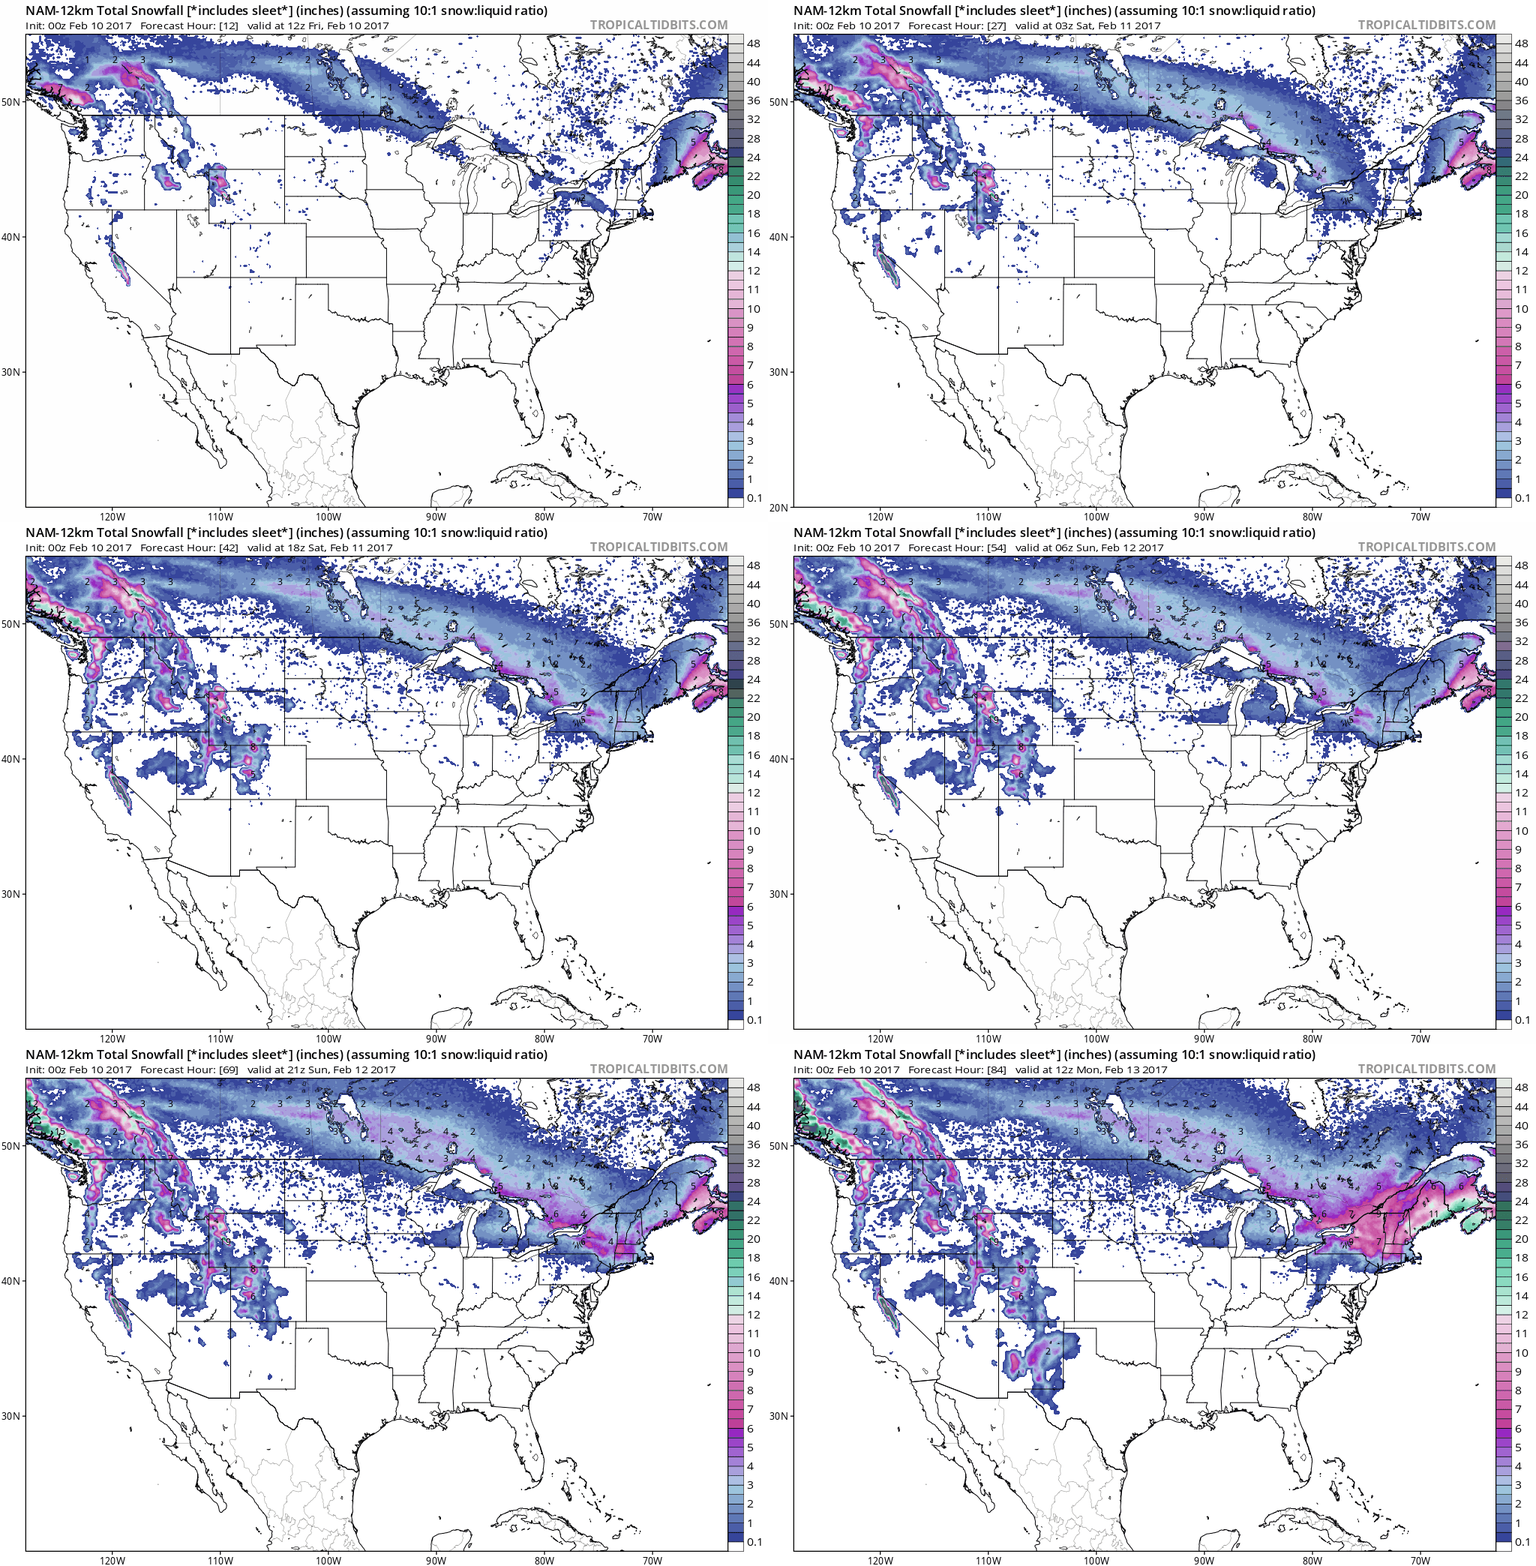
84-Hour Snowfall Potential. 12 KM NAM numbers show another plowable snow for much of New England and upstate New York by Saturday; heavy snow piling up over the Rockies, with some accumulation as far south as the Texas Panhandle by Monday morning.
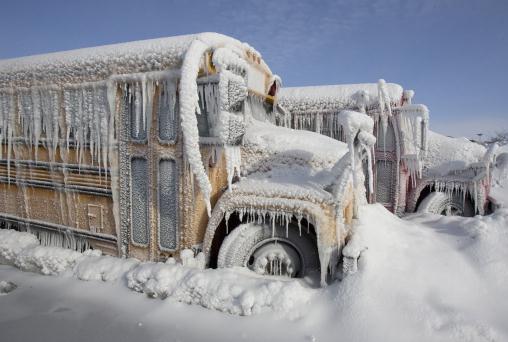
File photo: AP.
Graphic credit: "Forecast of future tropical Pacific SST conditions from 25 different models." (NOAA).
Snowfall totals around the northeast Thursday, courtesy of NOAA:
California Conservation Corp Tackles Snow Removal in Mammoth Lakes.
They prayed for snow - and it came. Now they can't make the snow in
Sierra Nevada mountains of California stop. Now there's a threat to 20
propane tanks buried under 20 feet of snow, and flat or low-pitch roofs
collapsing under the weight of snow. And potentially serious river
flooding. Details here.
Photo credit: Patrick Dennis.
Details on the tornadoes that hit Louisiana here, courtesy of the New Orleans National Weather Service.
Broader Updrafts in Severe Storms May Increase Chance of Damaging Hail. ScienceDaily has the results of new research from Penn State: "...New research that Kumjian and Eli Dennis, graduate student in meteorology, published in the Journal of the Atmospheric Sciences, suggests that changes in environmental vertical wind shear influence the growth of "significant" hail -- bigger than two inches in diameter. Vertical wind shear is the variation in wind speed or direction from the bottom to the top of a layer in the atmosphere. The greater the difference in speed and/or directionality, the greater the shear. Hail forms when small particles like frozen raindrops -- hail embryos -- are ingested into a storm's updraft. Once they rise in the updraft, the embryos grow as additional liquid water freezes onto them..."
Photo credit: "A supercell thunderstorm passes near Elm Creek, Nebraska, in July 2014. Penn State meteorologists have been examining the widths of storms' updrafts to predict the likelihood of dangerous hail." Credit: NOAA.
Coastal Cities Could Flood Three Times a Week by 2045. Climate Central explains that the Mid Atlantic region is most vulnerable to flooding from rising seas: "...Washington and Annapolis, Md. could see more than 120 high tide floods every year by 2045, or one flood every three days, according to the study, published last week in the journal PLOS ONE. That’s up from once-a-month flooding in mid-Atlantic regions now, which blocks roads and damages homes. “The flooding would generally cluster around the new and full moons,” said Erika Spanger-Siegfried, a Union of Concerned Scientists analysts who helped produce the new study. “Many tide cycles in a row would bring flooding, this would peter out, and would then be followed by a string of tides without flooding.” The analysis echoed findings from previous studies, though it stood out in part because of its focus on impacts that are expected within a generation — instead of, say, by the end of the century. It showed high tide floods along southeastern shorelines are expected to strike nearly as often as they will in the mid-Atlantic, portending a fast-looming crisis for more than 1,000 miles of coastal America...."
California Could Be Overdue for a 100-Year Mega-Flood. Details via SFist.com: "It may not be in the cards this year, but California has an extended history of mega-floods — the likes of which the state has not seen since 1862, when about 40 days of straight rain turned the Central Valley and much of Sacramento into a lake, killing countless people and thousands of livestock and leveling a number of barely decade-old west coast towns. Hydrology researcher Dave Reynolds argued in a 2012 paper that despite the lack of weather records for the state prior to the 1850s, the Great Flood of 1862 should be considered a 200-year event that could be expected to repeat itself with much more disastrous effects now that the west coast is so much more densely populated. But now KPIX/CBS 5 picked up on this historic flood narrative, noting that the "atmospheric river" effects we're seeing this season from the colloquially named Pineapple Express could lead to a mega-flood catastrophe sooner than we think..."
Image credit: "An illustration of K Street in Sacramento in January 1862."
- Bridgeport, CT: 36.9 (Warmest)
- Oak Ridge, TN: 46.8 (2nd warmest)
- Sault Ste Marie, MI: 24.8 (2nd warmest)
- Tupelo, MS: 50.8 (2nd warmest)
- Huntsville, AL: 50.9 (3rd warmest)
- Charleston, SC: 56.6 (4th warmest)
- Paducah, KY: 42.4 (4th warmest)
- Caribou, ME: 18 (5th warmest)
- Nashville, TN: 47 (5th warmest)
- Birmingham, AL: 52.5 (5th warmest)
- Atlanta, GA: 52 (6th warmest)..."
Minnesota Trending Warmer and Wetter. If there was any doubt in your mind a time series from The University of Minnesota Department of Soil, Water and Climate shows the actual trends since 1891.
55 Year Anniversary of TIROS-4. OK, the onboard black and white TV cameras lasted about 4 months, but we suddenly had imagery from space, an entirely new perspective on weather and the planet - and it set a benchmark for everything that has come since. Details via NASA: "TIROS 4 (Television and InfraRed Observation Satellite) was a spin-stabilized meteorological spacecraft designed to test experimental television techniques and infrared equipment. The satellite was in the form of an 18-sided right prism, 107 cm in diameter and 56 cm high. The top and sides of the spacecraft were covered with approximately 9000 1- by 2-cm silicon solar cells. It was equipped with two independent television camera subsystems for taking cloudcover pictures and three radiometers (two-channel low-resolution, omnidirectional, and five-channel scanning) for measuring radiation from the earth and its atmosphere..."
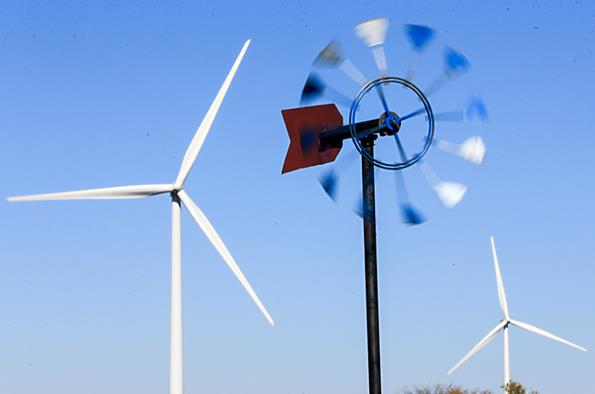
Wind Power Becomes the Top Renewable Energy Source. The New York Times reports: "The
wind industry crossed an important threshold last year, according to
its main trade group, the American Wind Energy Association, surpassing hydroelectric
power to become the largest source of renewable energy in the United
States. The nation’s fleet of dams has long stood as the top renewable
energy source, but there has been little market interest in building
more big hydroelectric generating stations. In the meantime, wind has
rapidly expanded — more than tripling in capacity since 2008 — with many
more installations on the way..."
File photo credit: Nati Harnik, Associated Press.
The "New Normal" in America: Renewables Boom, Emissions Plunge and Consumers Save More Than Ever. Here's the intro to a summary at Greentech Media: "After decades of technology development, business model innovation and policy progress, the U.S. economy is now decisively growing -- independent of energy consumption and carbon emissions. Since 2007, U.S. GDP has grown by 12 percent, while energy consumption has fallen by 3.6 percent, according to the new 2017 Sustainable Energy in America Factbook, compiled by Bloomberg New Energy Finance (BNEF) for the Business Council for Sustainable Energy (BCSE). This year’s fifth edition report builds on last year’s Factbook findings that show the U.S. economy grew by 10 percent since 2007, while energy consumption fell by 2.4 percent. “In other words, energy productivity continues to improve as less and less energy is needed to fuel growth,” the authors wrote..."
Renewable Energy Continues to Beat Fossil Fuels. TIME has the details: "Clean energy grew at a record pace as the United States added 22GW of capacity — the equivalent of 11 Hoover Dams — to the grid from renewable sources last year, significantly trumping new fossil fuel additions, according to a new report.The report from Bloomberg New Energy Finance (BNEF) and the Business Council for Sustainable Energy (BCSE) cites the declining cost of wind and solar power, largely due to advances in technology, as prime reasons for the rapid adoption of renewables. The cost of building large utility-scale solar photovoltaic power plants for example has been fallen by 50% in just five years..."
Support for a Clean Energy Economy is Higher Than You Might Think. Only 9% of Americans believe climate change is a hoax or not happening at all, according to new polling highlighted by Dan Satterfield at AGU Blogosphere.
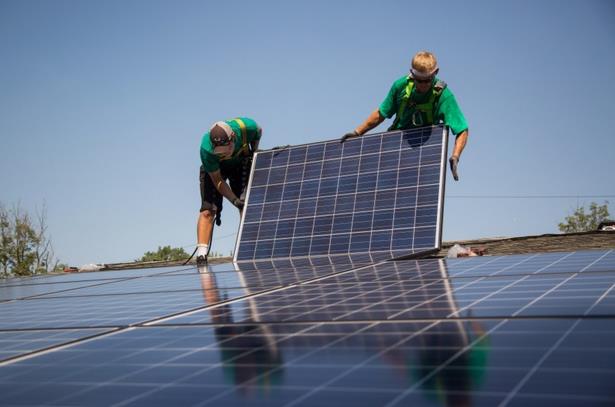
File photo: Michael Nagle, Bloomberg.
Exclusive: Tesla Pausing Factory for Model 3 Preparation This Month. Reuters has an update: "Tesla Inc (TSLA.O) said on Wednesday it will shut down production at its California assembly plant for a week this month to prepare for production of its high-volume Model 3 sedan, moving the company closer to meeting its target to start production in July. Tesla said the "brief, planned" pause would allow the company to add capacity to the existing paint shop to prepare it for the Model 3, and other general maintenance. "This will allow Tesla to begin Model 3 production later this year as planned and enable us to start the ramp towards 500,000 vehicles annually in 2018," said a Tesla spokesman..."
Photo credit: "Tesla Motors' mass-market Model 3 electric cars are seen in this handout picture from Tesla Motors on March 31, 2016." Tesla Motors/Handout via REUTERS/File Photo.

Of Thousands of Apps Tested, These Endured. Most of us use less than 5% of the apps on our smart phones. Here's a list of apps that The New York Times says pass the long-term smell test: "...The TED app (free on iOS and Android)
has also stayed on my phone for years, always ready to serve up a
fascinating and educational TED Talks video when I have a free
half-hour. Sleep Cycle (free on iOS)
has been a longtime companion, too, waking me at a more comfortable
moment in my sleep cycle and helping me avoid the horrid lurch one
sometimes gets with a timed alarm. Even though Apple has now built in
some sleep systems into iOS, I still use Sleep Cycle because it has more
features and has stored my sleep history. Last, because I have a
terrible memory for music, Shazam (free on iOS and Android) has been prominent on my phone's home page for years, always ready to identify a song..."

Best All-Inclusive Resorts in the Caribbean. If you need a mental health break check out the list from U.S. News: "U.S.
News ranks the best resorts by taking into account reputation among
professional travel experts, guest reviews and hotel class ratings. Use
the filters and settings below to help find the best resort for you.
Read the Best Hotels Methodology."
20 Metro Areas Are Home to 6 in10 Unauthorized Immigrants in U.S. Pew Research Center has the details: "Most
of the United States’ 11.1 million unauthorized immigrants live in just
20 major metropolitan areas, with the largest populations in New York,
Los Angeles and Houston, according to new Pew Research Center estimates
based on government data. The analysis shows that the nation’s
unauthorized immigrant population is highly concentrated, more so than
the U.S. population overall. In 2014, the 20 metro areas with most
unauthorized immigrants were home to 6.8 million of them, or 61% of the
estimated nationwide total. By contrast, only 36% of the total U.S.
population lived in those metro areas..."
Map credit: Pew Research Center.
U.S. Presidents Do Have Spending Limits for Securing Private Homes. Atlas Obscura has the details: "Franklin
D. Roosevelt had Hyde Park. Lyndon Johnson had his ranches. The first
President Bush had a house in Kennebunkport, Maine, and the second a
ranch in Crawford, Texas. Even after they’re elected, U.S. presidents
often keep their private homes as retreats from the White House;
America’s newest president, Donald Trump, has at least two. Since his
election in November, President Trump and his family have spent time at
his Fifth Avenue apartment, where the First Lady and their son continue
to live, and Mar-a-Lago, the president’s Florida resort. In the decades
since the Kennedy assassination, when presidential protection became
more rigorous, no president has kept a home in the thick of a city as
big as New York, and critics have questioned the millions of dollars being spent on securing the president’s apartment in Trump Tower..."
Photo credit: "New York City is spending millions of dollars securing President Trump’s private residence." nestor ferraro/CC BY 2.0
“Encouragement is food for the heart, and every heart is a hungry heart.” – Pat Morley
TODAY: Partly sunny, milder. Winds: SW: 10-15. High: 46 (50 possible south/west of MSP)
FRIDAY NIGHT: Partly to mostly cloudy. Low: 31
SATURDAY: More clouds, chance of light rain, especially southern MN. Winds: NW 5-10. High: 41
SUNDAY: More clouds than sun, drying out. Winds: NW 10-20. Wake-up: 28. High: 39
MONDAY: Plenty of sun, March-like. Winds: S 10-15. Wake-up: 26. High: 45
TUESDAY: Intervals of sun, what February? Winds: NW 8-13. Wake-up: 25. High: 43
WEDNESDAY: Mix of clouds and sun, tranquil. Winds: N 8-13. Wake-up: 23. High: 38
THURSDAY: Blue sky, warming up again. Winds: S 7-12. Wake-up: 22. High: 43
Model guidance is hinting at 50F close to home the end of next week.
Climate Stories...
Photo credit: Reuters. "James Baker III, the former secretary of state under George H.W. Bush, tours parts of Florida affected by Hurricane Ike in October 2008."
Photo credit: "
Something is Very, Very Wrong with the Arctic Climate. Are we at a tipping point at the top of the Earth? Andrew Freedman provides perspective at Mashable.
What David Rose fails to mention is that the new NOAA results have been validated by independent data from satellites, buoys and Argo floats and that many other independent groups, including Berkeley Earth and the UK’s Met Office Hadley Centre, get effectively the same results.
Rose’s claim that NOAA’s results “can never be verified” is patently incorrect, as we just published a paper independently verifying the most important part of NOAA’s results."
How a Culture Clash at NOAA Led to a Flap Over a High Profile Warming Pause Study. Science AAAS takes a look at the latest scuffle over data and trends: "...If there’s a dirty secret to the 2015 paper, it’s that “there wasn't a lot of new science in it,” says Karl, who retired in August 2016. It simply assembled the updated, already published NOAA ocean temperature record that their center had been assembling since 2011, and paired it with a published, nonoperational data set of land surface temperatures that included much more coverage around the world. “We said, let’s just put it together, and that’s what made it newsworthy and important.” At its heart, Bates’s concerns amount to a desire for Karl and his team to have more clearly stated that one data set used for their study was not defined by NOAA to have been in a final, “operational” form. One focus is the handling of a new approach to estimating temperatures on land around the globe. The agency’s monthly temperature estimates—which it uses to track climate trends—are drawn from 7000 stations scattered around the world..."
Photo credit: NOAA. "Data collected by satellites, land-based sensors, and NOAA ocean buoys like this are at the heart of the dispute."
Photo credit: "Petitioners Gabe Mandell, 14, center, and Adonis Williams, 12, look on as state Department of Ecology attorney Katharine G. Shirey speaks at a court hearing Tuesday, Nov. 22, 2016, in Seattle. Eight children are asking a Seattle judge to find Washington state in contempt for failing to adequately protect them and future generations from the harmful effects of climate change, part of a nationwide effort by young people to try to force action on global warming." (AP Photo/Elaine Thompson)
The Plan referenced above is here.
A Conservative Answer to Climate Change. The same group of conservatives pushing for a revenue-neutral carbon tax wrote an Op-Ed for The Wall Street Journal: "Thirty years ago, as the atmosphere’s protective ozone layer was dwindling at alarming rates, we were serving proudly under President Ronald Reagan. We remember his leading role in negotiating the Montreal Protocol, which continues to protect and restore the delicate ozone layer. Today the world faces a similar challenge: the threat of climate change. Just as in the 1980s, there is mounting evidence of problems with the atmosphere that are growing too compelling to ignore. And, once again, there is uncertainty about what lies ahead. The extent to which climate change is due to man-made causes can be questioned. But the risks associated with future warming are so severe that they should be hedged. The responsible and conservative response should be to take out an insurance policy..." (Image credit: NASA).
Photo credit: "James A. Baker, seen here at former first lady Nancy Reagan’s funeral in March 2016, is a member of the Climate Leadership Council. Despite its impeccable Republican credentials, the group faces long odds with its carbon-tax idea." (Jae C. Hong/Associated Press).
Photo credit: "Tests of the Orion spacecraft were made at Naval Station Norfolk in August 2013. The low-lying base is at risk from rising seas." Photograph by NASA, eyevine, Redux.

Image credit: 2016 Microsoft Corporation Earthstar Geographics.
Image credit: The Arctic Institute.
3 Ways You Can Help the World's Climate Scientists Right Now. Dr. Marshall Shepherd has some good suggestions at Forbes: "I often sit back and watch certain things quietly. This past week has been one of those moments. An article this weekend in the British media brought up the old and oft disproven argument about the"warming pause." However, as scientists dug into this latest desperate "Hail Mary" pass, it was apparent that there was more to this latest saga. My colleagues Phil Plait at Blastr and Andrew Freedman at Mashable have written excellent pieces laying out how scientists debunked these latest claims. They also fill in other pieces to this rather odd story. This latest drama just highlights the level of innuendo and confirmation bias that still can rear its head in the climate discussion. However, my focus herein is different. This week I saw three opportunities that I wanted to share with the broader public that can actually help climate scientists rather than continually distracting them..." (Image credit: NOAA).
No comments:
Post a Comment